

Rhythm of the streets: a street classification framework based on street activity patterns
- PMID: 35915632
- PMCID: PMC9331080
- DOI: 10.1140/epjds/s13688-022-00355-5
Rhythm of the streets: a street classification framework based on street activity patterns
Abstract
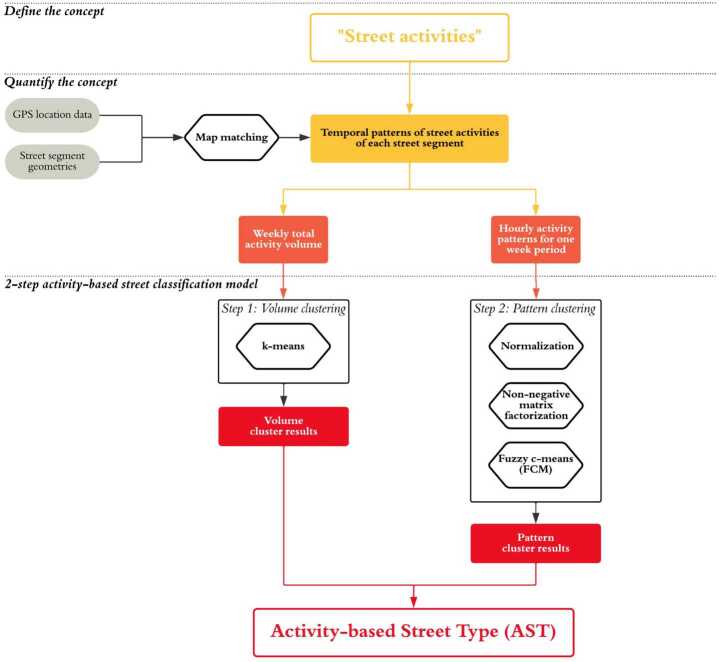
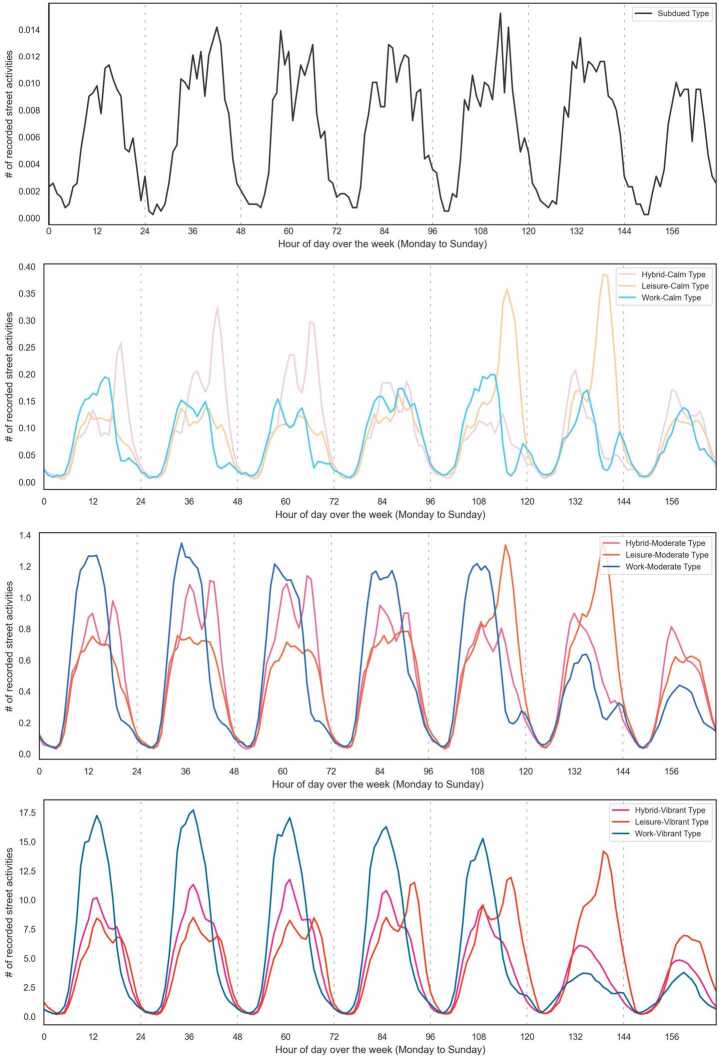
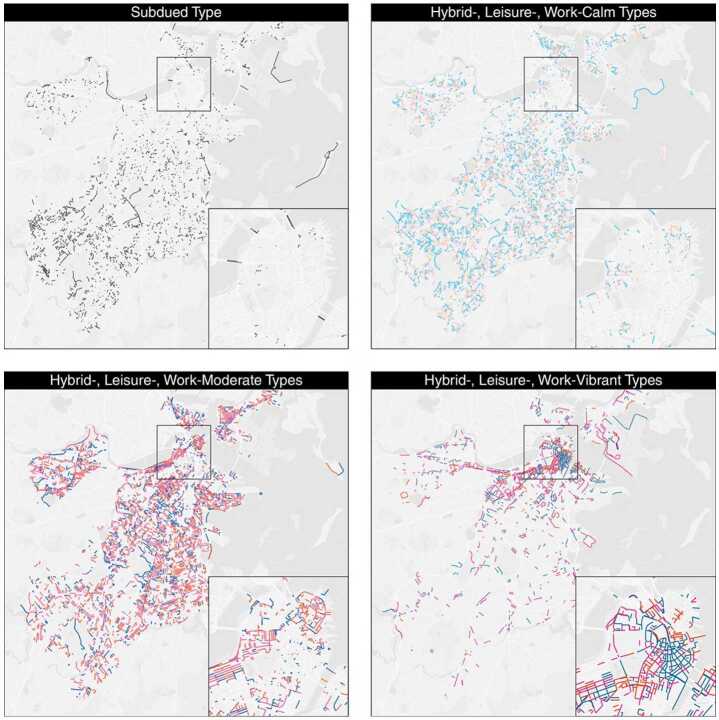
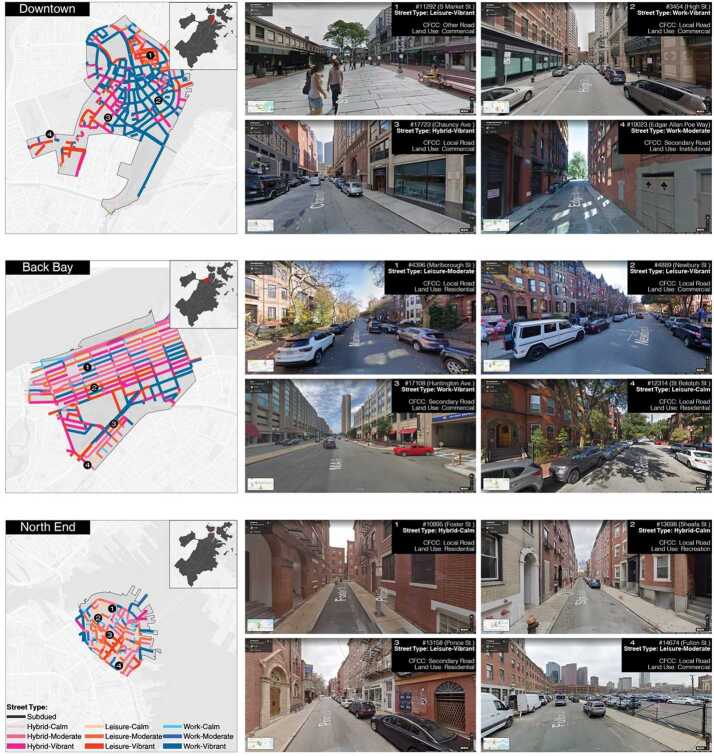
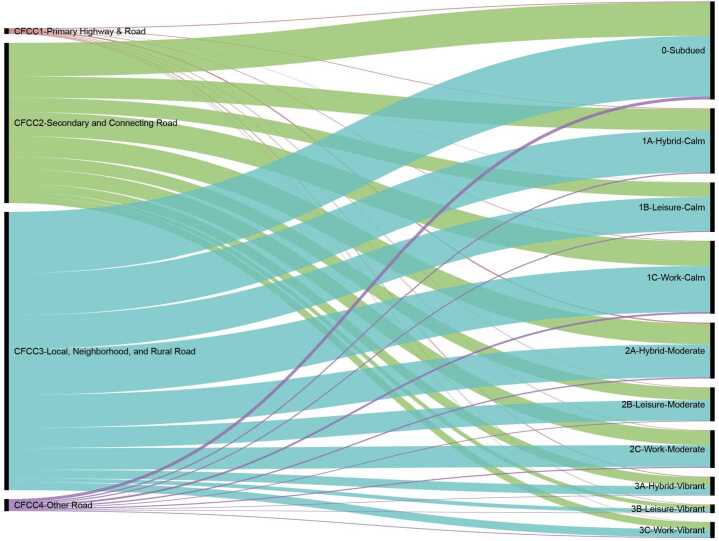
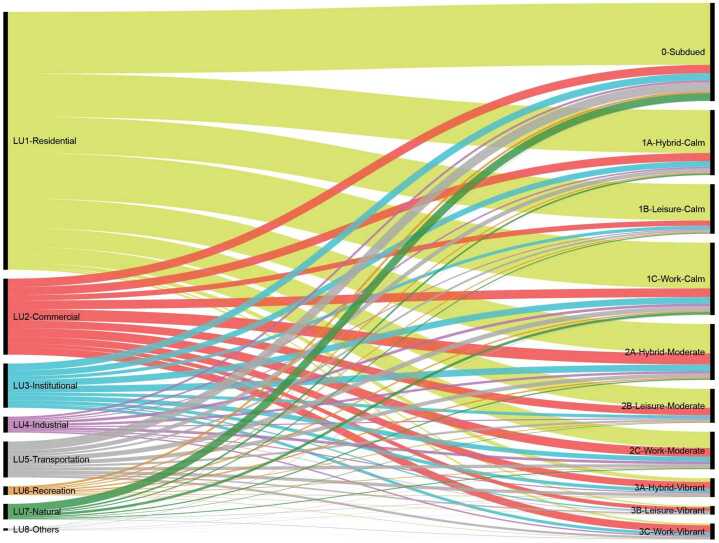
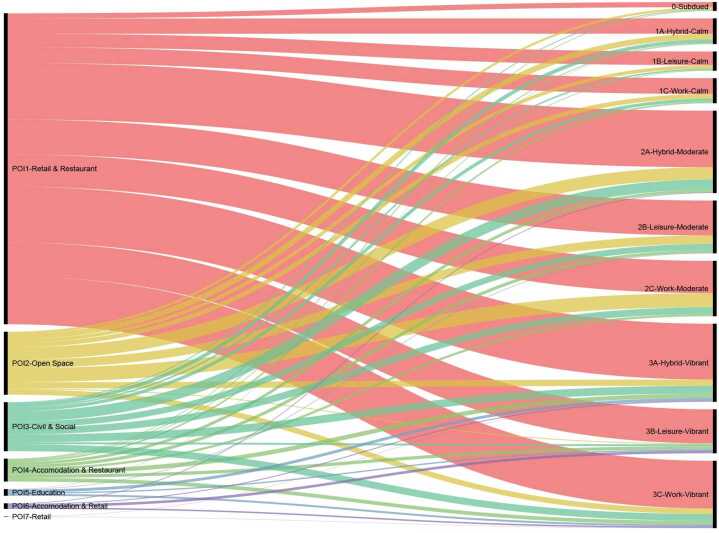
As the living tissue connecting urban places, streets play significant roles in driving city development, providing essential access, and promoting human interactions. Understanding street activities and how these activities vary across different streets is critical for designing both efficient and livable streets. However, current street classification frameworks primarily focus on either streets' functions in transportation networks or their adjacent land uses rather than actual activity patterns, resulting in coarse classifications. This research proposes an activity-based street classification framework to categorize street segments based on their temporal street activity patterns, which is derived from high-resolution de-identified and privacy-enhanced mobility data. We then apply the proposed framework to 18,023 street segments in the City of Boston and reveal 10 distinct activity-based street types (ASTs). These ASTs highlight dynamic street activities on streets, which complements existing street classification frameworks, which focus on the static or transportation characteristics of the street segments. Our results show that a street classification framework based on temporal street activity patterns can identify street categories at a finer granularity than current methods, which can offer useful implications for state-of-the-art urban management and planning. In particular, we find that our classification distinguishes better those streets where crime is more prevalent than current functional or contextual classifications of streets.
Keywords: Clustering; FCM; Mobile phone GPS data; Street activity; Street classification; Temporal patterns; Urban management.
© The Author(s) 2022.
Conflict of interest statement
Competing interestsThe authors declare that they have no competing interests.
Figures
Similar articles
-
Evaluation of spatial visual perception of streets based on deep learning and spatial syntax.Sci Rep. 2025 May 26;15(1):18439. doi: 10.1038/s41598-025-03189-z. Sci Rep. 2025. PMID: 40419619 Free PMC article.
-
Street design scenarios using vegetation for sustainable thermal comfort in Erzurum, Turkey.Environ Sci Pollut Res Int. 2021 Jan;28(3):3672-3693. doi: 10.1007/s11356-020-10555-z. Epub 2020 Sep 14. Environ Sci Pollut Res Int. 2021. PMID: 32926277
-
Study on the Effect of Streets' Space Forms on Campus Microclimate in the Severe Cold Region of China-Case Study of a University Campus in Daqing City.Int J Environ Res Public Health. 2020 Nov 12;17(22):8389. doi: 10.3390/ijerph17228389. Int J Environ Res Public Health. 2020. PMID: 33198425 Free PMC article.
-
Evaluating the impact of urban street network topology on human spatial cognition: a systematic review.Cogn Process. 2025 May 31. doi: 10.1007/s10339-025-01279-4. Online ahead of print. Cogn Process. 2025. PMID: 40448803 Review.
-
Examining the Implementation of Play Streets: A Systematic Review of the Grey Literature.J Public Health Manag Pract. 2020 May/Jun;26(3):E1-E10. doi: 10.1097/PHH.0000000000001015. J Public Health Manag Pract. 2020. PMID: 31033807 Free PMC article.
Cited by
-
Future workspace needs flexibility and diversity: A machine learning-driven behavioural analysis of co-working space.PLoS One. 2023 Oct 18;18(10):e0292370. doi: 10.1371/journal.pone.0292370. eCollection 2023. PLoS One. 2023. PMID: 37851592 Free PMC article.
-
Integrative Analysis of Rhythmicity: From Biology to Urban Environments and Sustainability.Int J Environ Res Public Health. 2022 Dec 31;20(1):764. doi: 10.3390/ijerph20010764. Int J Environ Res Public Health. 2022. PMID: 36613088 Free PMC article. Review.
-
Exploring the Relationship between Urban Street Spatial Patterns and Street Vitality: A Case Study of Guiyang, China.Int J Environ Res Public Health. 2023 Jan 16;20(2):1646. doi: 10.3390/ijerph20021646. Int J Environ Res Public Health. 2023. PMID: 36674400 Free PMC article.
References
-
- Lynch K. The image of the city. Cambridge: MIT Press; 1992.
-
- Gehl J. Life between buildings: using public space. 2012.
-
- Ben-Joseph E. Changing the residential street scene: adapting the shared street. J Am Plan Assoc. 1995;61(4):504–515. doi: 10.1080/01944369508975661. - DOI
-
- Gehl J, Svarre B. How to study public life. 2013.
-
- Whyte WH. The social life of small urban spaces. 1980.
LinkOut - more resources
Full Text Sources
Research Materials