

Molecular detection and quantification of the Striga seedbank in agricultural soils
- PMID: 35915645
- PMCID: PMC9322021
- DOI: 10.1111/wre.12535
Molecular detection and quantification of the Striga seedbank in agricultural soils
Abstract
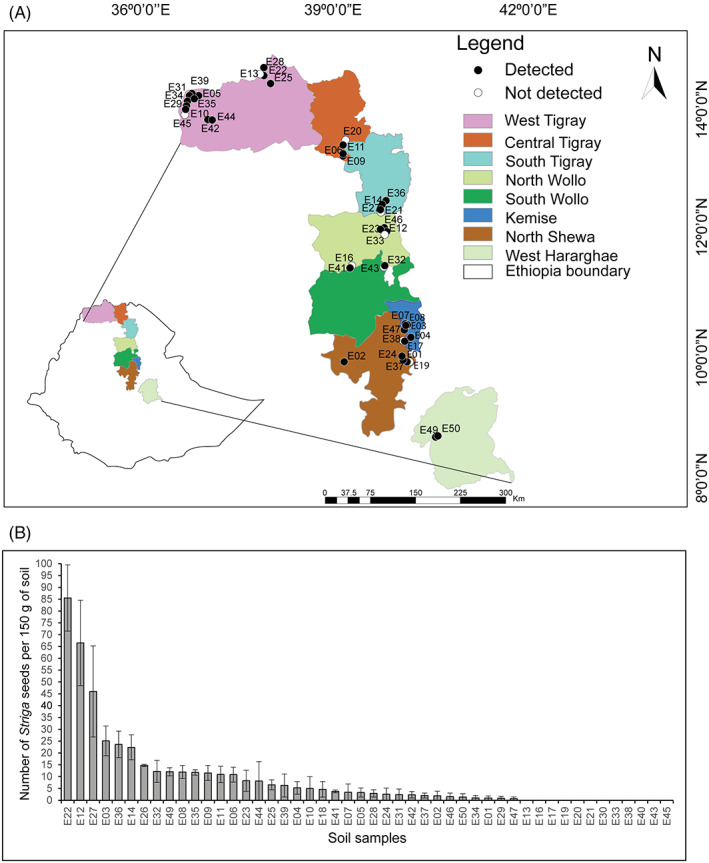
Striga hermonthica (Del.) Benth is a devastating parasitic weed in Sub-Saharan Africa (SSA) and its soil seedbank is the major factor contributing to its prevalence and persistence. To date, there is a little information on the Striga seedbank density in agricultural fields in SSA due to the lack of reliable detection and quantification methods. We developed a high-throughput method that combines density- and size-based separation techniques with quantitative polymerase chain reaction (qPCR)-based detection of Striga seeds in soil. The method was optimised and validated by introducing increasing numbers of Striga seeds in two physicochemically different Striga-free agricultural soils. The results showed that as little as one seed of S. hermonthica per 150 g of soil could be detected. This technique was subsequently tested on soil samples of 48 sorghum fields from different agro-ecological zones in Ethiopia to map the geospatial distribution of the Striga seedbank along a trajectory of more than 1500 km. Considerable variation in Striga seed densities was observed. Striga seeds were detectable in 75% of the field soils with densities up to 86 seeds per 150 g of soil. The Striga seed density in soil and the number of emerged Striga plants in the field showed a non-linear relationship. In conclusion, the method developed allows for accurate mapping of the Striga seedbank in physicochemically diverse SSA field soils and can be used to assess the impact of management strategies on Striga seedbank dynamics.
Keywords: Striga seed density; mapping; qPCR; sorghum field; sub‐Saharan Africa; weed seed.
© 2022 The Authors. Weed Research published by John Wiley & Sons Ltd on behalf of European Weed Research Society.
Conflict of interest statement
We declare no conflicts of interest.
Figures


Similar articles
-
Assessment of Management Options on Striga Infestation and Maize Grain Yield in Kenya.Weed Sci. 2018;66(4):516-524. doi: 10.1017/wsc.2018.4. Epub 2018 Jul 1. Weed Sci. 2018. PMID: 33583963 Free PMC article.
-
Evaluating Mechanisms of Soil Microbiome Suppression of Striga Infection in Sorghum.Bio Protoc. 2024 Sep 5;14(17):e5058. doi: 10.21769/BioProtoc.5058. eCollection 2024 Sep 5. Bio Protoc. 2024. PMID: 39282232 Free PMC article.
-
Integrating Fusarium oxysporum f. sp. strigae into cereal cropping systems in Africa.Pest Manag Sci. 2009 May;65(5):572-80. doi: 10.1002/ps.1741. Pest Manag Sci. 2009. PMID: 19288458
-
Molecular basis of strigolactone perception in root-parasitic plants: aiming to control its germination with strigolactone agonists/antagonists.Cell Mol Life Sci. 2020 Mar;77(6):1103-1113. doi: 10.1007/s00018-019-03318-8. Epub 2019 Oct 5. Cell Mol Life Sci. 2020. PMID: 31587093 Free PMC article. Review.
-
Combining host plant defence with targeted nutrition: key to durable control of hemiparasitic Striga in cereals in sub-Saharan Africa?New Phytol. 2021 Jun;230(6):2164-2178. doi: 10.1111/nph.17271. Epub 2021 Mar 21. New Phytol. 2021. PMID: 33577098 Review.
References
-
- Abate, M. , Mekbib F., Hussien T., Bayu W. & Reda F. (2014). Assessment of genetic diversity in sorghum (Sorghum bicolor [L.] Moench) for reactions to Striga hermonthica (Del.) Benth. Australian Journal of Crop Science, 8, 1248‐1256.
-
- Abunyewa, A.A. & Padi, F.K. (2003) Changes in soil fertility and Striga hermonthica prevalence associated with legume and cereal cultivation in The Sudan savannah zone of Ghana. Land Degradation & Development, 14, 335–343.
-
- Aly, R. , Bari, V.K. , Londner, A. et al. (2019) Development of specific molecular markers to distinguish and quantify broomrape species in a soil sample. European Journal of Plant Pathology, 155, 1367–1371.
-
- Aly, R. , Eizenberg, H. , Kocherman, M. , Abu‐Nassar, J. , Taha, L. & Saadi, I. (2012) Use of ITS nuclear sequences from Phelipanche aegyptiaca as a direct tool to detect single seeds of broomrape species in the soil. European Journal of Plant Pathology, 133, 523–526.
-
- Andrews, F.W. (1945) The parasitism of Striga hermonthica Benth. On sorghum spp. under irrigation: I. preliminary results and the effect of heavy and light irrigation on Striga attack. Annals of Applied Biology, 32, 193–200. - PubMed
LinkOut - more resources
Full Text Sources
Research Materials