

Genome-wide association mapping of Hagberg falling number, protein content, test weight, and grain yield in U.K. wheat
- PMID: 35915786
- PMCID: PMC9314726
- DOI: 10.1002/csc2.20692
Genome-wide association mapping of Hagberg falling number, protein content, test weight, and grain yield in U.K. wheat
Abstract
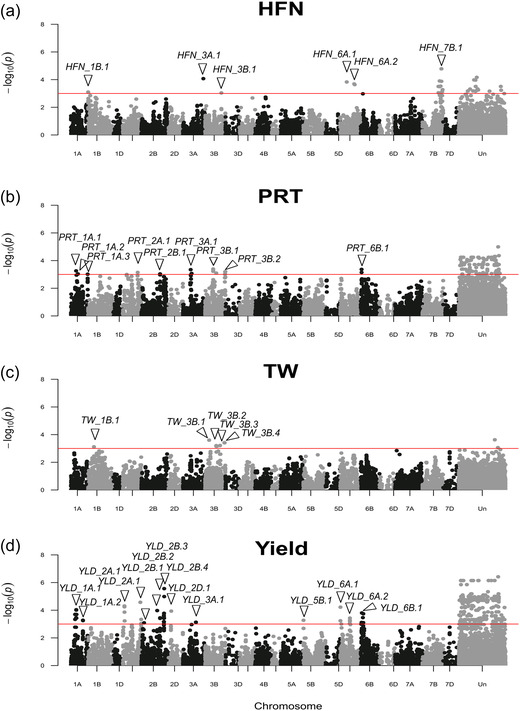
Association mapping using crop cultivars allows identification of genetic loci of direct relevance to breeding. Here, 150 U.K. wheat (Triticum aestivum L.) cultivars genotyped with 23,288 single nucleotide polymorphisms (SNPs) were used for genome-wide association studies (GWAS) using historical phenotypic data for grain protein content, Hagberg falling number (HFN), test weight, and grain yield. Power calculations indicated experimental design would enable detection of quantitative trait loci (QTL) explaining ≥20% of the variation (PVE) at a relatively high power of >80%, falling to 40% for detection of a SNP with an R2 ≥ .5 with the same QTL. Genome-wide association studies identified marker-trait associations for all four traits. For HFN (h 2 = .89), six QTL were identified, including a major locus on chromosome 7B explaining 49% PVE and reducing HFN by 44 s. For protein content (h 2 = 0.86), 10 QTL were found on chromosomes 1A, 2A, 2B, 3A, 3B, and 6B, together explaining 48.9% PVE. For test weight, five QTL were identified (one on 1B and four on 3B; 26.3% PVE). Finally, 14 loci were identified for grain yield (h 2 = 0.95) on eight chromosomes (1A, 2A, 2B, 2D, 3A, 5B, 6A, 6B; 68.1% PVE), of which five were located within 16 Mbp of genetic regions previously identified as under breeder selection in European wheat. Our study demonstrates the utility of exploiting historical crop datasets, identifying genomic targets for independent validation, and ultimately for wheat genetic improvement.
© 2022 The Authors. Crop Science published by Wiley Periodicals LLC on behalf of Crop Science Society of America.
Conflict of interest statement
The authors report no conflicts of interest.
Figures
Similar articles
-
Development of a High-Density SNP-Based Linkage Map and Detection of QTL for β-Glucans, Protein Content, Grain Yield per Spike and Heading Time in Durum Wheat.Int J Mol Sci. 2017 Jun 21;18(6):1329. doi: 10.3390/ijms18061329. Int J Mol Sci. 2017. PMID: 28635630 Free PMC article.
-
Mapping of quantitative trait loci for grain yield and its components in a US popular winter wheat TAM 111 using 90K SNPs.PLoS One. 2017 Dec 21;12(12):e0189669. doi: 10.1371/journal.pone.0189669. eCollection 2017. PLoS One. 2017. PMID: 29267314 Free PMC article.
-
Genetic dissection of wheat panicle traits using linkage analysis and a genome-wide association study.Theor Appl Genet. 2018 May;131(5):1073-1090. doi: 10.1007/s00122-018-3059-9. Epub 2018 Feb 22. Theor Appl Genet. 2018. PMID: 29470622
-
Genetic dissection of protein and starch during wheat grain development using QTL mapping and GWAS.Front Plant Sci. 2023 Jun 12;14:1189887. doi: 10.3389/fpls.2023.1189887. eCollection 2023. Front Plant Sci. 2023. PMID: 37377808 Free PMC article.
-
Identification and validation of new quantitative trait loci for spike-related traits in two RIL populations.Mol Breed. 2023 Jul 31;43(8):64. doi: 10.1007/s11032-023-01401-4. eCollection 2023 Aug. Mol Breed. 2023. PMID: 37533603 Free PMC article. Review.
Cited by
-
Wheat genetic loci conferring resistance to stripe rust in the face of genetically diverse races of the fungus Puccinia striiformis f. sp. tritici.Theor Appl Genet. 2022 Jan;135(1):301-319. doi: 10.1007/s00122-021-03967-z. Epub 2021 Nov 27. Theor Appl Genet. 2022. PMID: 34837509 Free PMC article.
-
Nutritional Genomic Approach for Improving Grain Protein Content in Wheat.Foods. 2023 Mar 25;12(7):1399. doi: 10.3390/foods12071399. Foods. 2023. PMID: 37048220 Free PMC article.
-
Genome-wide association study reveals 18 QTL for major agronomic traits in a Nordic-Baltic spring wheat germplasm.Front Plant Sci. 2024 Jun 21;15:1393170. doi: 10.3389/fpls.2024.1393170. eCollection 2024. Front Plant Sci. 2024. PMID: 38974985 Free PMC article.
-
Current Progress and Future Prospect of Wheat Genetics Research towards an Enhanced Nitrogen Use Efficiency.Plants (Basel). 2023 Apr 25;12(9):1753. doi: 10.3390/plants12091753. Plants (Basel). 2023. PMID: 37176811 Free PMC article. Review.
-
Modeling QTL-by-environment interactions for multi-parent populations.Front Plant Sci. 2024 Jul 31;15:1410851. doi: 10.3389/fpls.2024.1410851. eCollection 2024. Front Plant Sci. 2024. PMID: 39145196 Free PMC article.
References
-
- Adamski, N. , Borrill, P. , Brinton, J. , Harrington, S. A. , Marchal, C. , Bentley, A. R. , Bovill, W. D. , Cattivelli, L. , Cockram, J. , Contreras‐Moreira, B. , Ford, B. , Ghosh, S. , Harwood, W. , Hassani‐Pak, K. , Hayta, S. , Hickey, L. T. , Kanyuka, K. , King, J. , Maccaferrri, M. , … Uauy, C. (2020). A roadmap for gene functional validation in large genome crops: Lessons from polyploid wheat. eLIFE, 9, e55646. 10.7554/eLife.55646 - DOI - PMC - PubMed
-
- Assanga, S. O. , Fuentealba, M. , Zhang, G. , Tan, C. , Dhakal, S. , Rudd, J. C. , Ibrahim, A. M. H. , Xue, Q. , Haley, S. , Chen, J. , Chao, S. , Baker, J. , Jessup, K. , & Liu, S. (2017). Mapping of quantitative trait loci for grain yield and its components in a US popular winter wheat TAM 111 using 90K SNPs. PLOS ONE, 12, e0189669. 10.1371/journal.pone.0189669 - DOI - PMC - PubMed
-
- Beavis, W. D. (1994). The power and deceit of QTL experiments: lessons from comparative QTL studies. In Proceedings of the 49th Annual Corn and Sorghum Industry Research Conference (pp. 250–266). American Seed Trade Association.
-
- Bentley, A. R. , Scutari, M. , Gosman, N. , Faure, S. , Bedford, F. , Howell, P. , Cockram, J. , Rose, G. A. , Barber, T. , Irigoyen, J. , Horsnell, R. , Pumfrey, C. , Winnie, E. , Schacht, J. , Beauchêne, K. , Praud, S. , Greenland, A. , Balding, D. , & Mackay, I. J. (2014). Applying association mapping and genomic selection to the dissection of key traits in elite European wheat. Theoretical and Applied Genetics, 127, 2619–2633. 10.1007/s00122-014-2403-y - DOI - PubMed
-
- Blanco, A. , Mangini, G. , Giancaspro, A. , Giove, S. , Colasuonno, P. , Simeone, R. , Signorile, A. , De Vita, P. , Mastrangelo, A. M. , Cattivelli, L. , & Gadaleta, A. (2012). Relationships between grain protein content and grain yield components through quantitative trait locus analyses in a recombinant inbred line population derived from two elite durum wheat cultivars. Molecular Breeding, 30, 79–92. 10.1007/s11032-011-9600-z - DOI
Grants and funding
LinkOut - more resources
Full Text Sources
Miscellaneous