. 2022 Jul 23:2022:1093945.
doi: 10.1155/2022/1093945. eCollection 2022.

WT1 Inhibits Human Renal Carcinoma Cell Proliferation and Induces G2/M Arrest by Upregulating IL-24 Expression

Affiliations

WT1 Inhibits Human Renal Carcinoma Cell Proliferation and Induces G2/M Arrest by Upregulating IL-24 Expression

Y J Jing et al. Biomed Res Int. .

Abstract

The transcription factor Wilms' tumor 1 (WT1) is involved in development, tissue homeostasis, and disease. However, the exact roles and the mechanisms of WT1 in renal carcinoma are not well understood. Therefore, in this study, we evaluated the ability of WT1 to block proliferation in renal carcinoma cells in vitro. Experimental analysis showed that WT1 overexpression inhibited the proliferation of renal carcinoma A498 cells and promoted arrest at the G2/M checkpoint. RNA-Seq identified differentially expressed genes, including IL-24, related to both the cell proliferation and the cell cycle. WT1 overexpression upregulated IL-24 expression, and IL-24 overexpression induced G2/M arrest. ChIP-Seq identified JUN as a direct target of WT1 in A498 cells, in which positive regulation was shown by RT-qPCR. It has been shown that the transcription factor JUN can regulate IL-24 expression, and therefore, we hypothesize that WT1 might regulate the IL-24 through JUN. Furthermore, analysis based on TCGA datasets showed that the expression of WT1-regulated genes, including TXNIP and GADD45A, was significantly correlated with the stage and histological grade of tumors, with high levels linked to favorable prognoses. Our results demonstrated that the overexpression of WT1 upregulates IL-24, leading to G2/M checkpoint arrest to reduce proliferation. These results indicate that regulation of IL-24 by WT1 inhibits proliferation and may represent a potential target for treating renal carcinoma.


Conflict of interest statement

The authors declare that there are no competing interests.

Figures

Figure 1
Figure 1
WT1 levels in normal and KIRC tissues. (a) WT1 levels in various cancers from the TIMER database. (b) WT1 levels in renal cancer from the UALCAN database. (c) WT1 protein levels in renal cancer from the HPA database.
Figure 2
Figure 2
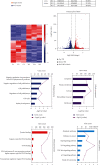
KEGG and GO enrichment analyses of WT1-related genes showing their relationship with cell proliferation. (a) Pearson correlations between WT1 and differentially expressed genes. (b) Heatmap of the top 50 positively correlated genes. (c–f) DAVID analysis of significantly enriched GO annotations and KEGG pathways. (c) Biological processes, (d) molecular functions, (e) cellular components, and (f) KEGG pathway analysis.
Figure 3
Figure 3
WT1 overexpression inhibits the proliferation of A498 cells by promoting G2/M arrest. WT1 levels in renal cancer cell lines from the CCLE database (a). WT1 mRNA levels measured by RT-qPCR (b). Cells were transfected with WT1 or control vectors (2 μg/well), and WT1 levels were measured by RT-qPCR (c) or Western blotting (d). A498-Luc2 cells transfected with the WT1 vector or empty vector (0.2 μg/well). FLUX measurements were captured (e). For normalization of luciferase activity, the luciferase signal per well of the control cells was set to 1. Quantitative data represent the mean ± standard error (n = 3 per group) (f). Cell cycle analysis of WT1-overexpressing A498 cells by flow cytometry. Flow cytometry of WT1-overexpressing A498 cells showing G2/M arrest was assessed via flow cytometry. Histograms of cell cycle distribution (g). Statistical diagram of the cell cycle distribution (h). Experiments were conducted in triplicate (n = 3); error bars represent standard errors; ∗∗∗p < 0.001.
Figure 4
Figure 4
Transcriptomic analysis of WT1-regulated genes. (a) The mRNA expression level of WT1 in A498 cells after transfection with the WT1 vector or empty vector after 48 h was detected by RT-qPCR. (b) Data and flowchart of AmpliSeq arrays assessing gene expression in triplicate biological replicates (W1-W3: WT1 vector; C1-C3: empty vector) in A498 cells. (c) Volcano plot of the transcriptome. (d) Volcano plot of the transcriptome. Upregulated (blue color) and downregulated (red color) genes in A498 cells transfected with WT1 along with statistically nonsignificant expressed genes (gray color) are plotted. (e–h) Significantly enriched GO annotations and KEGG pathways of WT1-related genes analyzed by DAVID. (e) Biological processes, (f) molecular functions, (g) cellular components, and (h) KEGG pathway analysis. ∗∗∗p < 0.001.
Figure 5
Figure 5
WT1 overexpression can induce G2/M arrest by upregulating IL-24 expression in RCC cells. The expression of (a) WT1 or (b) IL-24 mRNA in A498 cells transfected with the WT1 vector was detected by RT-qPCR. (c) Standard curve for ELISA-based detection of IL-24 levels. (d) The expression of IL-24 protein in A498 cells transfected with the WT1 vector was detected by ELISA. (e) IL-24 levels in IL-24-overexpressing cells detected by ELISA. Flow cytometry of IL-24-overexpressing A498 cells showing G2/M arrest was assessed via flow cytometry. (f) Histograms of cell cycle distribution. (g) Statistical diagram of the cell cycle distribution. Experiments were conducted in triplicate (n = 3); error bars represent standard errors; ∗∗∗p < 0.001.
Figure 6
Figure 6
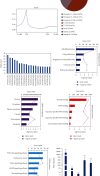
Genome-wide WT1 association in renal cancer cells. (a) Table showing data and flow of analysis of the ChIP-Seq experiment from sequence reads to annotated gene assignment of the WT1-binding sites. (b) Analysis of the motifs associated with WT1 peaks showed enrichment for known WT1-binding sequences. (c) Distribution of WT1-binding regions in the renal cancer cell genome. (d) Distribution of WT1 promoter peaks relative to the TSS. (e) WT1-binding motifs identified by ChIP-Seq analysis. (f–i) Significantly enriched GO annotations and KEGG pathways of WT1-related genes analyzed by DAVID. (f) Biological processes, (g) molecular functions, (h) cellular components, and (i) KEGG pathway analysis. (j) The expression level of WT1-target genes was verified in WT1-overexpressing cells by RT-qPCR. Experiments were conducted in triplicate (n = 3); error bars represent standard errors; ∗∗∗p < 0.001.

Similar articles

Cited by

References

    1. Si Y., Liu J., Shen H., et al. Fisetin decreases TET1 activity and CCNY/CDK16 promoter 5hmC levels to inhibit the proliferation and invasion of renal cancer stem cell. Journal of Cellular and Molecular Medicine . 2019;23(2):1095–1105. - PMC - PubMed
    1. Xu M., Wang Y., Zhou L. N., et al. The therapeutic value of SC66 in human renal cell carcinoma cells. Cell Death & Disease . 2020;11(5):1–11. - PMC - PubMed
    1. Lu J., Zhu L., Zheng L. P., et al. Overexpression of ULK1 represents a potential diagnostic marker for clear cell renal carcinoma and the antitumor effects of SBI-0206965. EBioMedicine . 2018;34:85–93. - PMC - PubMed
    1. Wu Z., Qiu M., Mi Z., et al. WT1 interacting protein inhibits cell proliferation and tumorigenicity in nonsmall cell lung cancer via the AKT/FOXO1 axis. Molecular Oncology . 2019;13(5):1059–1074. - PMC - PubMed
    1. Liao L., Zhang L., Yang M., et al. Expression profile of SYNE3 and bioinformatic analysis of its prognostic value and functions in tumors. Journal of Translational Medicine . 2020;18(1):1–13. - PMC - PubMed

MeSH terms