. 2022 Dec;112(6):1387-1397.
doi: 10.1002/JLB.1A0122-080R. Epub 2022 Aug 2.

Selenoprotein I deficiency in T cells promotes differentiation into tolerant phenotypes while decreasing Th17 pathology

Affiliations

Selenoprotein I deficiency in T cells promotes differentiation into tolerant phenotypes while decreasing Th17 pathology

Chi Ma et al. J Leukoc Biol. 2022 Dec.

Abstract

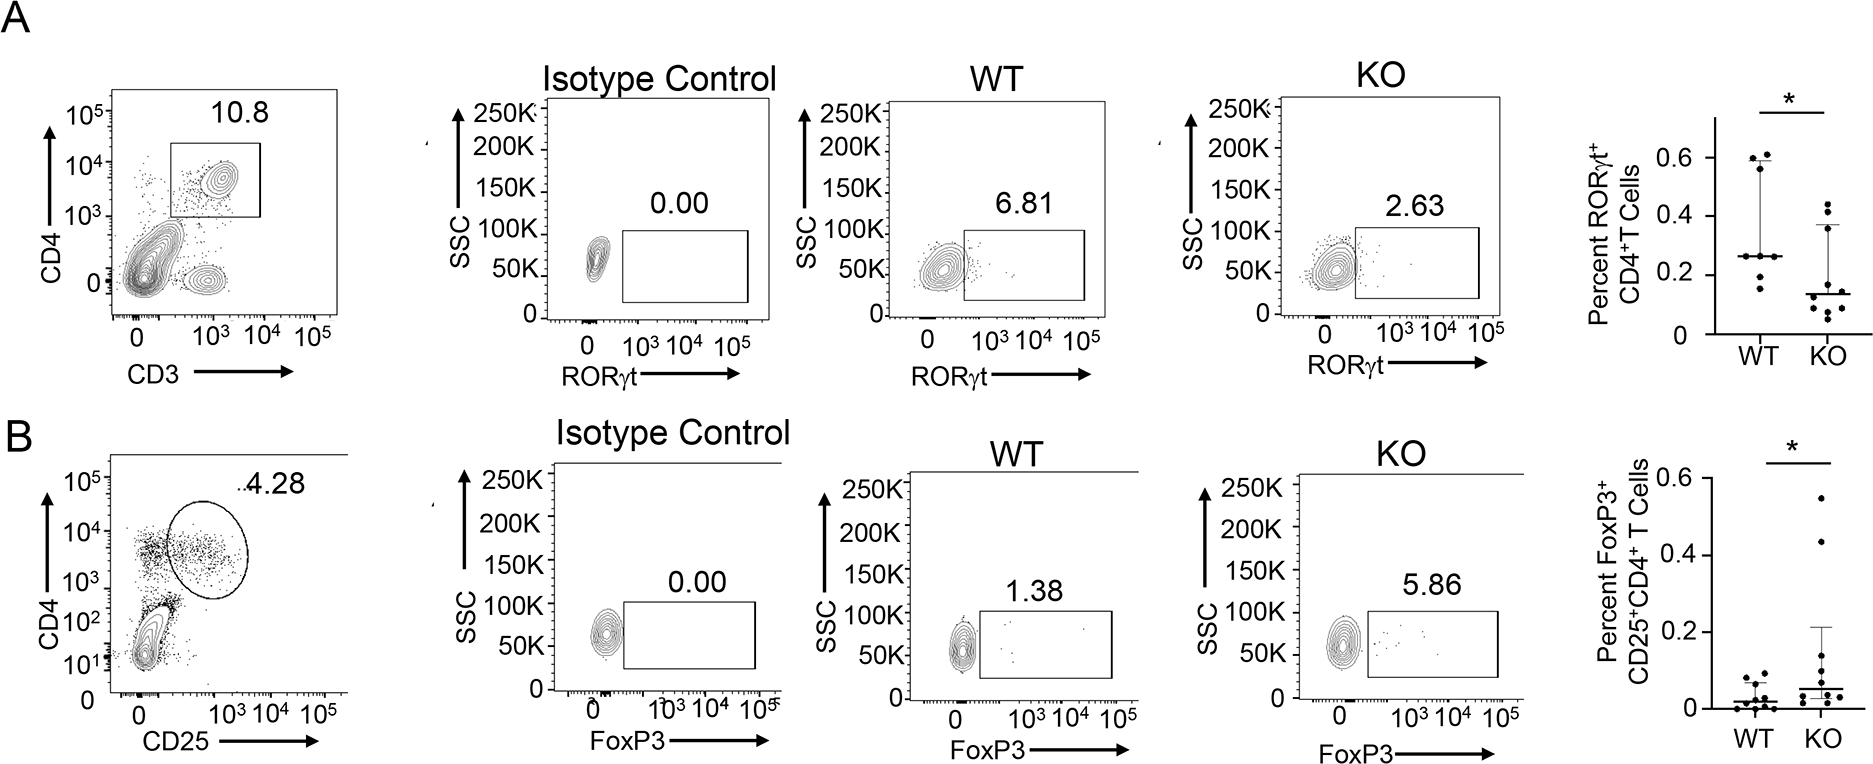
Selenoprotein I (SELENOI) is an ethanolamine phospholipid transferase contributing to cellular metabolism and the synthesis of glycosylphosphatidylinositol (GPI) anchors. SELENOI knockout (KO) in T cells has been shown to impair metabolic reprogramming during T cell activation and reduce GPI-anchored Thy-1 levels, which are both crucial for Th17 differentiation. This suggests SELENOI may be important for Th17 differentiation, and we found that SELENOI was indeed up-regulated early during the activation of naïve CD4+ T cells in Th17 conditions. SELENOI KO reduced RORγt mRNA levels by decreasing SOX5 and STAT3 binding to promoter and enhancer regions in the RORC gene encoding this master regulator of Th17 cell differentiation. Differentiation of naïve CD4+ T cells into inflammatory versus tolerogenic Th cell subsets was analyzed and results showed that SELENOI deficiency skewed differentiation away from pathogenic Th17 cells (RORγt+ and IL-17A+ ) while promoting tolerogenic phenotypes (Foxp3+ and IL-10+ ). Wild-type and T cell-specific SELENOI KO mice were subjected to experimental autoimmune encephalitis (EAE), with KO mice exhibiting diminished clinical symptoms, reduced CNS pathology and decreased T cell infiltration. Flow cytometry showed that SELENOI T cell KO mice exhibited lower CD4+ RORγt+ and CD4+ IL-17A+ T cells and higher CD4+ CD25+ FoxP3+ T cells in CNS tissues of mice subjected to EAE. Thus, the metabolic enzyme SELENOI is up-regulated to promote RORγt transcription that drives Th17 differentiation, and SELENOI deficiency shifts differentiation toward tolerogenic phenotypes while protecting against pathogenic Th17 responses.

Keywords: autoimmunity; ethanolamine phospholipid transferase; inflammation; metabolism; phosphatidylethanolamine.


Conflict of interest statement

Conflict-of-Interest Disclosure

The authors declare no conflict of interests.

Figures

Figure 1.
Figure 1.
SELENOI is upregulated during Th17 differentiation to promote increased RORγt expression. Naïve CD4+ T cells purified from C57BL/6 spleens were stimulated with plate-bound anti-CD3/anti-CD28 in the presence of TGF-β (2.5 ng/mL), IL-6 (20 ng/mL) and IL-23 (10 ng/mL). (A) Real-time PCR results for 4 different target mRNAs are shown normalized to housekeeping mRNA (ubc) with 4 replicates per timepoint. (B) Western blot analysis of SELENOI levels 24 h after TCR stimulation in Th17 conditions described above, including 2 biological replicates and β-actin as a loading control. (C) Real-time PCR analyses of WT and KO CD4+ naïve T cells unstimulated or TCR stimulated (24 h) in Th17 conditions. (D) Flow cytometry was used to analyze RORγt levels in WT and KO CD4+ T cells during Th17 differentiation. Means of replicates (N=4) were compared using a student’s t-test and expressed as median ± IQR with *p < 0.05.
Figure 2.
Figure 2.
SELENOI KO decreases transcription of the RORγt gene (RORC) by reducing STAT3 and SOX5 binding to enhancer and promoter regions. WT and SELENOI KO naïve CD4+ T cells were nonactivated or activated for 18 h using anti-CD3/anti-CD28 in Th17 conditions. (A) Confocal immunofluorescence was used to analyze nuclear levels of STAT3 and SOX5. Results showed that levels of SOX5, but not STAT3, were slightly reduced in DAPI-positive nuclei of SELENOI KO T cells compared to WT controls. Scalebar = 10 μm. (B) ChIP assays were performed to determine the binding of STAT3 and SOX5 to established enhancer and promoter regions of the RORC gene after 18 h activation in Th17 conditions. The DNA/protein fraction prior to IP (i.e. input) was used as a template for real-time PCR, and the results of the real-time PCR from each ChIP were normalized to their corresponding input real-time PCR results as described in the Methods section. Means of replicates (N=10 fields/group in A; N=3–4 in B) were compared using a student’s t-test and expressed as median ± IQR with *p < 0.05.
Figure 3.
Figure 3.
SELENOI KO increases STAT5 binding to enhancer regions of the FoxP3 gene. WT and SELENOI KO naïve CD4+ T cells were activated for 18 h using anti-CD3/anti-CD28 in Th17 conditions and ChIP assays were performed to determine the binding of STAT5 to established CNS0 and CNS2 enhancers in the FoxP3 gene. Results showed higher binding of STAT5 to both enhancers, but no differences in IPs using an isotype control antibody. Means of replicates (N=4) were compared using a student’s t-test and expressed as median ± IQR with *p < 0.05.
Figure 4.
Figure 4.
SELENOI deficiency skews CD4+ T cell differentiation away from a pathogenic Th17 phenotype. Purifed WT and SELENOI KO T naïve CD4+ cells isolated using magnetic beads were activated with plate-bound anti-CD3/28 under different culture conditions for 72 h as described in the Methods section. (A-B) The high purity and viability of CD4+ T cells prior to and after 72 h activation did not differ between WT and KO as confirmed by flow cytometry. (C-D) Naïve CD4+ T cells activated for 72 h in Th17 conditions that were confirmed as live CD4+ T cells as described above were analyzed for Th17 pathogeic and tolerogenic markers. Compared to WT controls, SELENOI KO CD4+ T cells showed significantly lower levels of IL-17A+, IL-22+, and IL-23+ cells, but higher levels of IL-10+ cells. KO were also lower in levels of RORγt+ cells, but higher in levels of FoxP3+ cells. Means of replicates (N=4) were compared using a student’s t-test and expressed as median ± IQR with *p < 0.05.
Figure 5.
Figure 5.
SELENOI deficiency in T cells protects mice from EAE. (A) A time course of EAE protocol including experimental readouts is shown. (B) Female (8–10 wks of age) T cell-specific SELENOI KO and WT mice subjected to EAE protocol were monitored daily for disease symptoms and scored as described in the Methods section. (C) Means of replicates (n=6 mice/group; data pooled from 2 independent experiments) were compared using a student’s t-test and expressed as median ± IQR with *p < 0.05.
Figure 6.
Figure 6.
SELENOI KO in T cells preferentially reduces CD4+IL-17A+ T cell levels in CNS tissues of EAE mice. After 15 d on EAE protocol, female mice were sacrificed and cerebellum and spinal cord tissues were analyzed by flow cytometry for IL-17A+ and IL-10+ T cells. (A) Single cell suspensions were gated on CD3+CD4+ T cells, which were then analyzed for levels of IL-17A and IL-10 (B). Compared to WT controls, levels of CD4+IL-17A+ T cells were reduced by SELENOI KO but levels of CD4+IL-10+ T cells were unaffected. Means of replicates (N=6 in top panel, N=5 in bottom panel) were compared using a student’s t-test and expressed as median ± IQR with *p < 0.05.
Figure 7.
Figure 7.
CNS tissues analyzed for T cell inflammation and lesions show that SELENOI deficiency reduces EAE. After 30 d on EAE protocol, female mouse were sacrificed and cerebellum and spinal cord tissues were analyzed by immunohistochemistry and immunofluorescence. (A) Representative images are shown along with quantification of CD3+ T cells (dark brown). (B) Representative images are shown along with quantification of IL-17A (red), with nuclei counterstained by DAPI (blue). (C) Representative images are shown along with quantification of SMI-32+ lesions (dark brown). Scalebar = 50 μm for 5A-C. Means of replicates (n=5 mice/group, 2 fields counted per mouse) were compared using a student’s t-test and expressed as median ± IQR with *p < 0.05.
Figure 8.
Figure 8.
SELENOI deficiency in T cells favors a tolerogenic versus pathogenic T helper cell phenotype during EAE. Single cell suspensions from combined cerebellum and spinal cord tissues from each female mouse at day 30 in EAE protocol were analyzed by flow cytometry. (A) Pro-inflammatory CD4+RORγt+ T cells were calculated by multiplying CD3+CD4+ percentages by RORγt+ percentages. (B) Pro-tolerant CD4+CD25+FoxP3+ T cells were calculated by multiplying CD4+CD25+ percentages by FoxP3+ percentages. Means (n=8 mice/group) were compared using a student’s t-test and expressed as median ± IQR with *p < 0.05.

Similar articles

Cited by

References

    1. Chisolm DA and Weinmann AS (2018) Connections Between Metabolism and Epigenetics in Programming Cellular Differentiation. Annu Rev Immunol 36, 221–246. - PubMed
    1. Loftus RM and Finlay DK (2016) Immunometabolism: Cellular Metabolism Turns Immune Regulator. J Biol Chem 291, 1–10. - PMC - PubMed
    1. Pawlak M, Ho AW, Kuchroo VK (2020) Cytokines and transcription factors in the differentiation of CD4(+) T helper cell subsets and induction of tissue inflammation and autoimmunity. Curr Opin Immunol 67, 57–67. - PMC - PubMed
    1. Harrington LE, Hatton RD, Mangan PR, Turner H, Murphy TL, Murphy KM, Weaver CT (2005) Interleukin 17-producing CD4+ effector T cells develop via a lineage distinct from the T helper type 1 and 2 lineages. Nat Immunol 6, 1123–32. - PubMed
    1. Gaffen SL, Jain R, Garg AV, Cua DJ (2014) The IL-23-IL-17 immune axis: from mechanisms to therapeutic testing. Nat Rev Immunol 14, 585–600. - PMC - PubMed

Publication types

Substances