. 2022 Dec;112(6):1471-1484.
doi: 10.1002/JLB.4A0122-068R. Epub 2022 Aug 2.

IL-22 and Lactobacillus delbrueckii mitigate alcohol-induced exacerbation of DSS-induced colitis

Affiliations

IL-22 and Lactobacillus delbrueckii mitigate alcohol-induced exacerbation of DSS-induced colitis

Abigail R Cannon et al. J Leukoc Biol. 2022 Dec.

Abstract

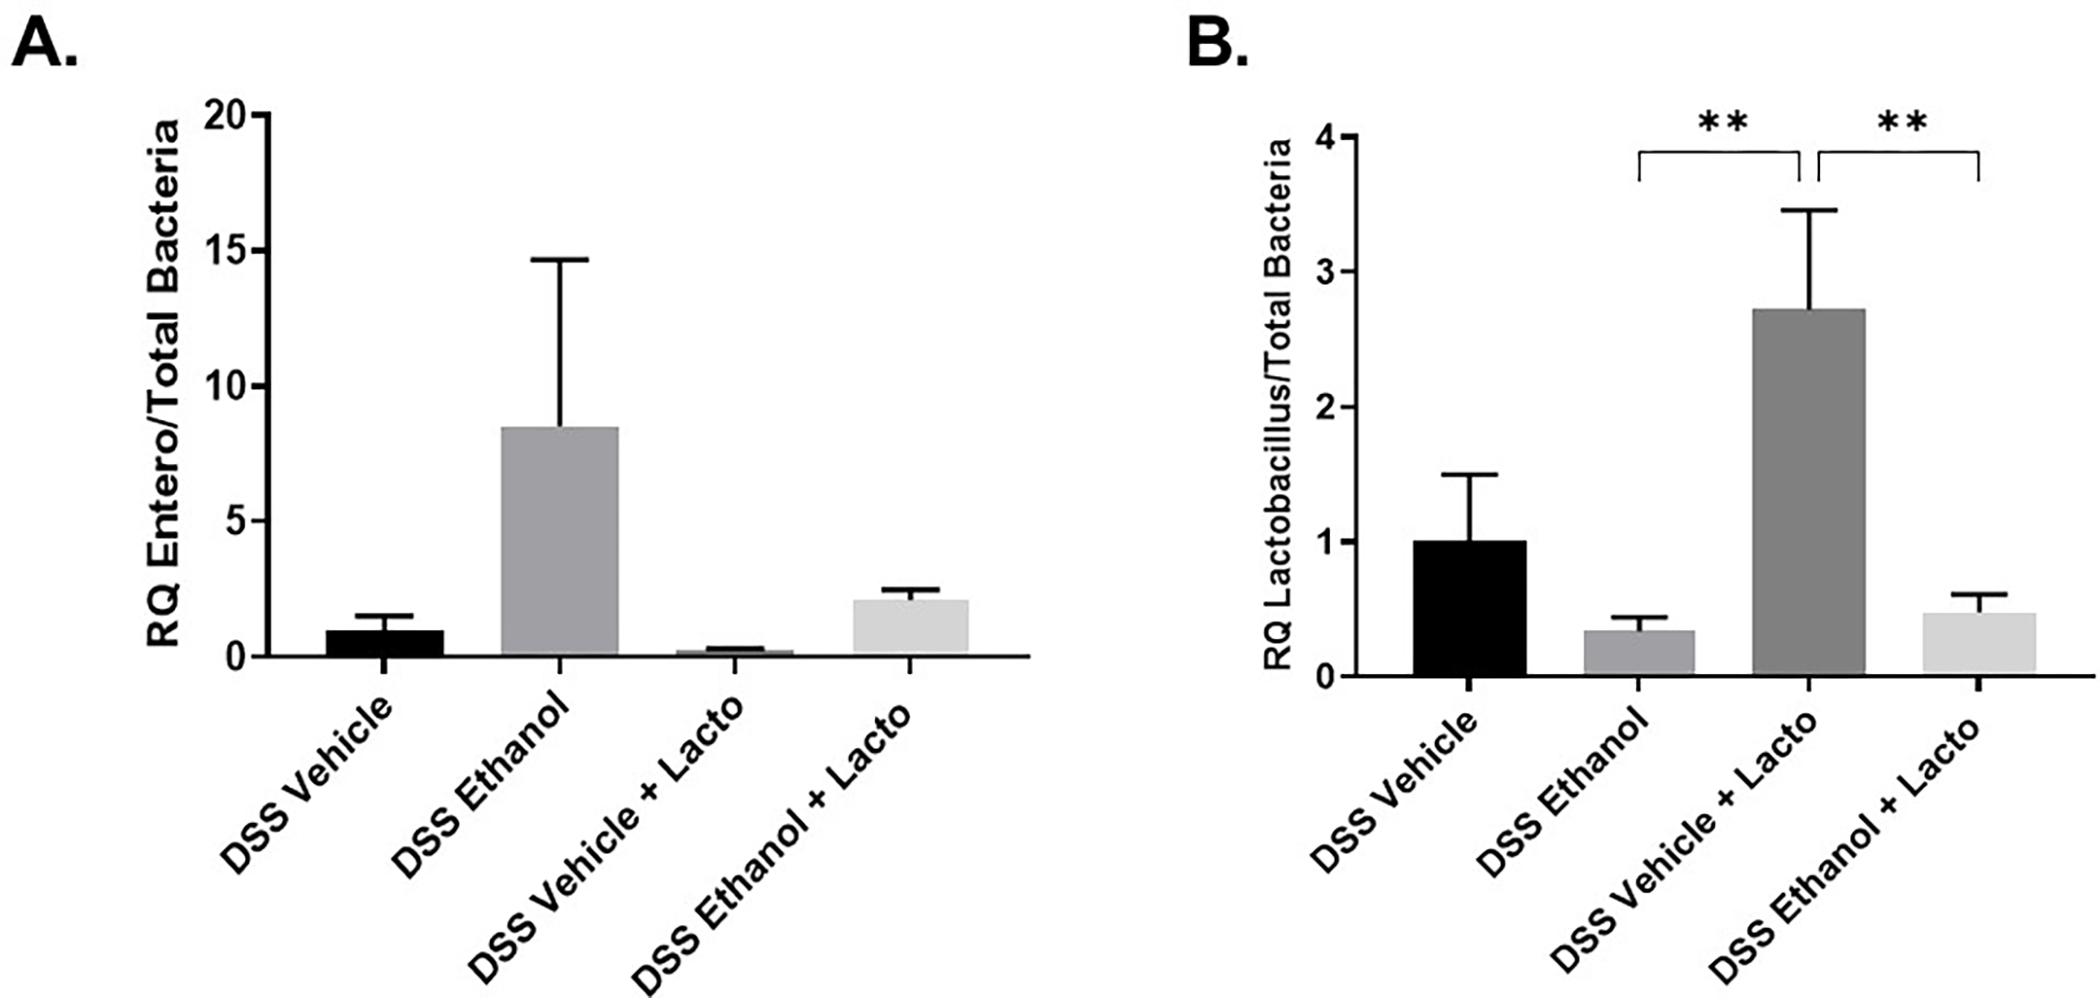
Ulcerative colitis (UC) is characterized by cycles of active disease flare and inactive disease remission. During UC remission, IL-22 is up-regulated, acting as a hallmark of entrance into UC remission. Recently, we found that in our mouse model of binge alcohol and dextran sodium sulfate (DSS)-induced colitis, alcohol increases severity of UC pathology. In this study, we assessed not only whether alcohol influenced IL-22 expression and thereby perpetuates UC, but also whether recombinant IL-22 (rIL-22) or treatment with a probiotic could alleviate exacerbated symptoms of UC. Levels of large intestine IL-22 were significantly decreased ∼6.9-fold in DSS ethanol compared with DSS vehicle. Examination of lamina propria (LP) cells in the large intestine revealed IL-22+ γδ T cells in DSS vehicle-treated mice were significantly increased, while IL-22+ γδ T cells in DSS ethanol mice were unable to mount this IL-22 response. We administered rIL-22 and found it restored weight loss of DSS ethanol-treated mice. Colonic shortening and increased Enterobacteriaceae were also attenuated. Administration of Lactobacillus delbrueckii attenuated weight loss (p < 0.01), colon length (p < 0.001), mitigated increases in Enterobacteriaceae, increased levels of IL-22, and increased levels of p-STAT3 back to that of DSS vehicle group in DSS ethanol mice. In contrast, sole administration of L. delbrueckii supernatant was not sufficient to reduce UC exacerbation following alcohol. Our findings suggest L. delbrueckii contributes to repair mechanisms by increasing levels of IL-22, resulting in phosphorylation of STAT3, thus attenuating the alcohol-induced increases in intestinal damage after colitis.

Keywords: STAT3; Ulcerative colitis; ethanol; immune cells; inflammation; probiotics.


Conflict of interest statement

Disclosures:

The authors have nothing to disclose.

Figures

Figure 1.
Figure 1.. IL-22 Levels After Alcohol Consumption in DSS-Induced Colitis.
A. Elevated Levels of IL-22 in DSS Vehicle but Not DSS Ethanol Treated Mice. Values are mean ± SEM 3–5 animals per group. *p<0.05 DSS Vehicle compared to all other groups by two-way ANOVA. B. Binge Alcohol Consumption Following DSS-Induced Colitis Decreases the Percentage of IL-22+ cells in Large Intestine Lamina Propria. Values are mean ± SEM 2–6 animals per group. *p<0.05 DSS Ethanol compared to Sham Vehicle by two-way ANOVA.
Figure 2.
Figure 2.. DSS-Induced Colitis Decreases the Percentage of CD3+CD4+IL-22+ T Cells.
A. and B. Representative two color FACs plots of A. CD+CD4+ T cells and B. CD3+CD4+ T cells gated for IL-22+. C. Summary of percentage of CD3+CD4+ T cells in the large intestine LP. D. Summary of percentage of CD3+CD4+IL-22+ T cells in the large intestine LP. Values are mean ± SEM 5–12 animals per group. *p<0.05 Sham Ethanol compared to Sham Vehicle; ****p<0.0001 DSS Vehicle and DSS Ethanol compared to Sham Vehicle by two-way ANOVA.
Figure 3.
Figure 3.. No Difference in Percentage of CD3−NKp46+IL-22+ ILC3s Between Vehicle and Ethanol Treated Mice.
A. and B. Representative two color FACs plots of A. CD-CD4− lymphocytes to sort ILC3s and B. CD3−CD4− lymphocytes were further gated on the ILC3 marker NKp46 and also IL-22. C. Summary of percentage of CD3−CD4−NKp46+IL-22+ ILC3s in the large intestine LP. Values are mean ± SEM 5–11 animals per group. *p<0.05 DSS Ethanol compared to Sham Vehicle by two-way ANOVA.
Figure 4.
Figure 4.. No Difference in Percentage of GR1+IL-22+ Neutrophils After Alcohol Consumption in DSS-Induced Colitis.
A. and B. Representative two color FACs plots of A. Large intestine LP lymphocytes were further gated on neutrophil marker GR1. B. GR1+ cells were further gated on IL-22 to determine percentage of GR1+IL-22+ neutrophils in the large intestine lamina propria. C. Summary of % GR1+ neutrophils in the large intestine LP. Values are mean ± SEM 5 animals per group. **p<0.001 DSS Vehicle vs. Sham Vehicle and Sham Ethanol; ***p<0.001 DSS Ethanol vs. Sham Vehicle and Sham Ethanol by two-way ANOVA. D. Summary of % GR1+IL-22+ neutrophils in the large intestine LP. Values are mean ± SEM 5 animals per group. *p<0.05 DSS Vehicle vs. Sham Ethanol; **p<0.01 DSS Ethanol vs. Sham Ethanol by two-way ANOVA.
Figure 5.
Figure 5.. The Percentage of IL-22+ γδ T Cells Significantly Increased After DSS-Induced Colitis, but Following Binge Alcohol this Increase Was Impaired.
A. and B. Representative two color FACs plots of %γδ T cells. A. Large intestine LP lymphocytes were further gated on γδTCR. Values are mean ± SEM 5 animals per group. **p<0.01 DSS Vehicle vs. Sham Ethanol; ***p<0.001 DSS Vehicle vs. Sham Vehicle ***p<0.001 DSS Ethanol Sham Ethanol by two-way ANOVA. ****p<0.0001 DSS Ethanol vs. Sham Ethanol % IL-22+ γδ T cells. Values are mean ± SEM 5 animals per group. *p<0.05 DSS Vehicle vs. Sham Vehicle and Sham Ethanol by two-way ANOVA.
Figure 6.
Figure 6.. rIL-22 Treatment Prevented the Alcohol Induced Increase in Weight Loss and Colonic Shortening Following DSS-Induced Colitis.
A. Model of Treatment with rIL-22 in the Context of DSS-Induced Colitis and Binge Alcohol. B. Percent Weight Change of Animals. Determined by the following equation: % weight change = (weight at day X-weight at day 0/weight at day 0)*100. Values are mean ± SEM 4–12 animals per group. By two-way ANOVA on day 7 with Tukey post-hoc *p<0.05 DSS Ethanol vs. DSS Vehicle; p=0.07 DSS Ethanol vs. DSS Ethanol + rIL-22. ***p<0.001 DSS Ethanol vs DSS Vehicle +rIL-22. C. Colon Length Measured in Centimeters (cm) on Day 7. Values are means ± SEM, n=4–12 animals/group. *p<0.05 DSS Ethanol vs. DSS Vehicle; **p<0.01 DSS Ethanol vs DSS Vehicle + rIL-22; *p<0.05 DSS Ethanol vs DSS Ethanol + rIL-22 by two-way ANOVA with Tukey Post-hoc.
Figure 7.
Figure 7.. rIL-22 Prevents Overgrowth of Gram-negative Enterobacteriaceae and Partially Restores Lactobacillus Copy Numbers Following Alcohol and Colitis.
Real-time PCR 16S rRNA sequencing of large intestine luminal content with primers specific for A. Enterobacteriaceae *p<0.05 DSS Ethanol vs DSS Vehicle + rIL-22 by two-way ANOVA B. Lactobacillus. Values are mean ± SEM 4–12 animals per group.
Figure 8.
Figure 8.. Treatment with Lactobacillus delbrueckii Attenuated the Alcohol Induced Increases in Weight Loss and Colonic Shortening Following DSS Colitis.
A. Model of Treatment with Lactobacillus delbrueckii in the Context of DSS-Induced Colitis and Binge Alcohol. B. Percent weight change of animals was determined by the following equation: % weight change = (weight at day X-weight at day 0/weight at day 0)*100. Values are mean ± SEM n = 6–8 animals per group. *p<0.05 DSS Ethanol vs. DSS Vehicle; *p<0.05 DSS Ethanol vs DSS Ethanol + Lacto; ****p<0.0001 DSS Ethanol vs DSS Vehicle + Lacto; *p<0.05 DSS Ethanol + Lacto vs. DSS Vehicle + Lacto by two-way ANOVA on day 7 with Tukey post-hoc. C. Colon length measured in centimeters (cm) on day 7. Values are means ± SEM, n=6–8 animals/group. *p<0.05 DSS Ethanol compared to DSS Vehicle by student’s test; ***p<0.01 DSS Vehicle + Lacto compared to DSS Ethanol; ****p<0.001 DSS Ethanol + Lacto compared to DSS Ethanol by two-way ANOVA with Tukey Post-hoc.
Figure 9.
Figure 9.. Lactobacillus delbrueckii Prevents Overgrowth of Gram-negative Enterobacteriaceae.
Real-time PCR 16S rRNA sequencing of large intestine luminal content with primers specific for A. Enterobacteriaceae B. Lactobacillus, **p<0.01 DSS Vehicle + Lacto compared to DSS Ethanol and DSS Ethanol + Lacto by two-way ANOVA with Tukey Post-hoc. Values are mean ± SEM n = 6–8 animals per group.
Figure 10.
Figure 10.. Lactobacillus delbrueckii Treatment Trended Towards an Increase in Large Intestine Levels of IL-22, but Did Not Decrease Levels of IL-17.
A. Levels of total large intestine IL-22 quantified by ELISA. Values are mean ± SEM 6–8 animals per group. p=0.056 DSS Ethanol vs. DSS Vehicle by two-way ANOVA with Tukey post-hoc. *p<0.05 DSS Ethanol vs. DSS Ethanol + Lacto by student’s t-test. B. Levels of total large intestine IL-17 quantified by ELISA. Values are mean ± SEM 6–8 animals per group. *p<0.05 DSS Ethanol + Lacto vs. DSS Vehicle by ANOVA with Tukey post-hoc.
Figure 11.
Figure 11.. Treatment with Lactobacillus delbrueckii Attenuates Decreased Levels of pSTAT3 in DSS Ethanol Mice.
Protein isolated from total large intestine tissue was probed for STAT3 and pSTAT3 (Y705) by representative Western blot. Densiometric analysis was performed to express the ratio of pSTAT3/β-actin. *p<0.05 DSS Ethanol compared to DSS Vehicle by two-way ANOVA. Values are mean ± SEM 4–6 animals per group.
Figure 12.
Figure 12.. Lactobacillus delbrueckii Bacteria are Required to Attenuate the Alcohol Induced Increases in Weight Loss and Colonic Shortening Following DSS Colitis.
A. Percent weight change of animals was determined by the following equation: % weight change = (weight at day X-weight at day 0/weight at day 0)*100. Values are mean ± SEM n = 5 animals per group. **p<0.01 DSS Ethanol vs. DSS Vehicle by; **p<0.01 DSS Ethanol + Lacto Sup. vs DSS Vehicle by two-way ANOVA on day 7 with Tukey post-hoc. B. Colon length measured in centimeters (cm) on day 7. Values are means ± SEM, n=5 animals/group. *p<0.05 DSS Ethanol compared to DSS Vehicle and DSS Ethanol + Lacto bacteria compared to DSS Ethanol + Lacto sup; **p<0.01 DSS Vehicle compared to DSS Ethanol + Lacto sup. by two-way ANOVA with Tukey Post-hoc.

Similar articles

Cited by

References

    1. Crohn’s and colitis foundation of america. http://www.ccfa.org/resources/facts-about-inflammatory.html. Updated May, 2011March, 2016.
    1. Sartor RB. Microbial influences in inflammatory bowel diseases. Gastroenterology. 2008;134(2):577–594. - PubMed
    1. Maslowski KM, Vieira AT, Ng A, et al. Regulation of inflammatory responses by gut microbiota and chemoattractant receptor GPR43. Nature. 2009;461(7268):1282–1286. - PMC - PubMed
    1. Ivanov II, Frutos Rde L, Manel N, et al. Specific microbiota direct the differentiation of IL-17-producing T-helper cells in the mucosa of the small intestine. Cell Host Microbe. 2008;4(4):337–349. - PMC - PubMed
    1. Neurath MF, Travis SP. Mucosal healing in inflammatory bowel diseases: A systematic review. Gut. 2012;61(11):1619–1635. - PubMed

Publication types