. 2022 Aug 1;78(Pt 8):945-963.
doi: 10.1107/S2059798322005939. Epub 2022 Jul 14.

Evaluating the impact of X-ray damage on conformational heterogeneity in room-temperature (277 K) and cryo-cooled protein crystals

Affiliations

Evaluating the impact of X-ray damage on conformational heterogeneity in room-temperature (277 K) and cryo-cooled protein crystals

Filip Yabukarski et al. Acta Crystallogr D Struct Biol. .

Abstract

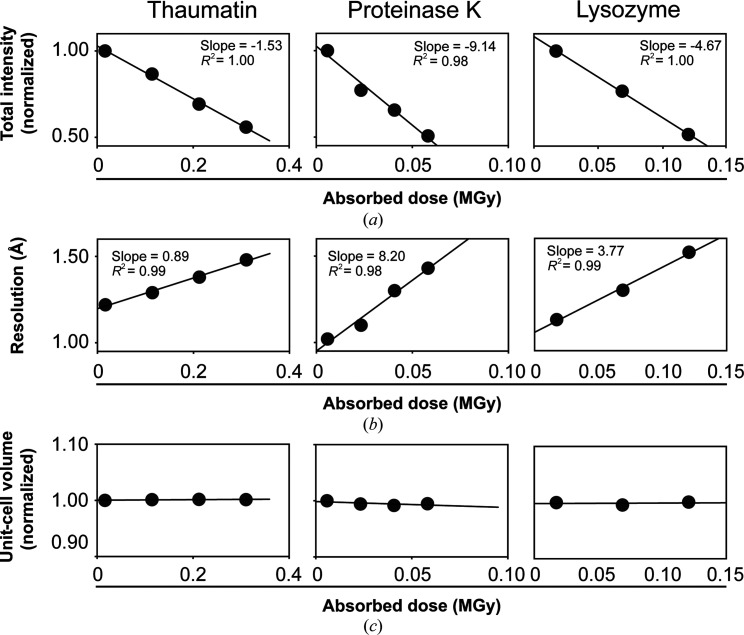
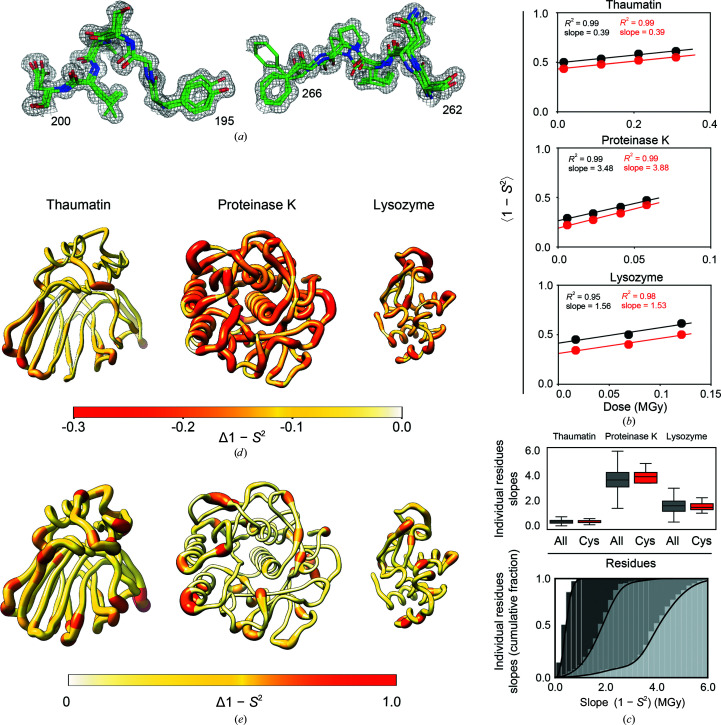
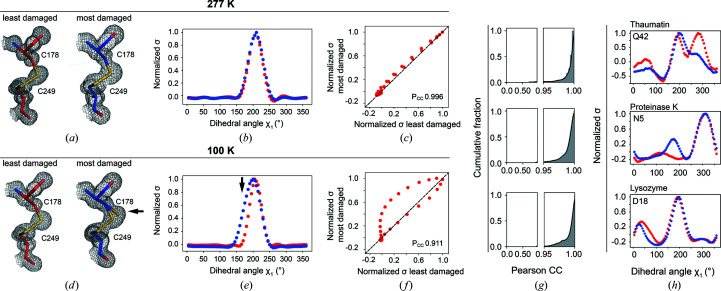
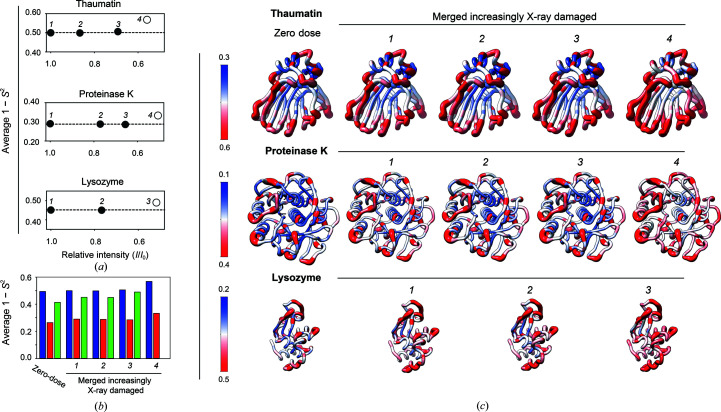
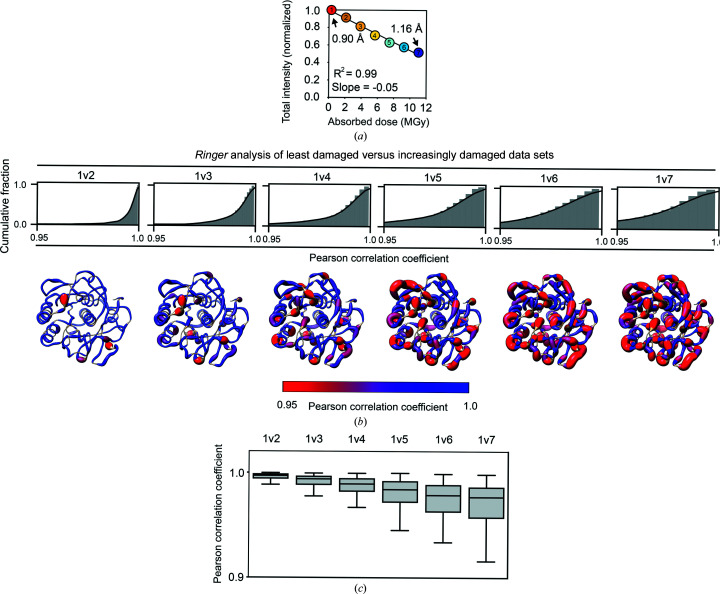
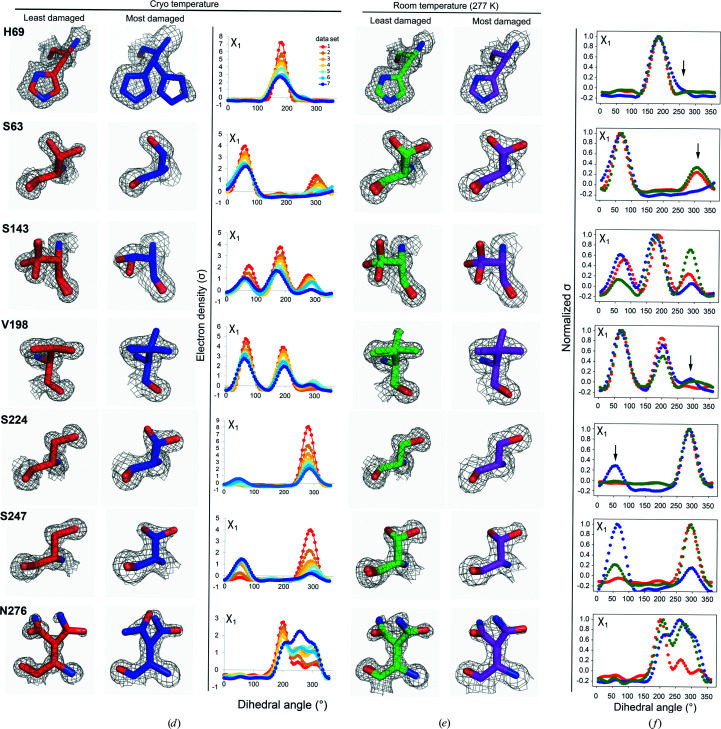
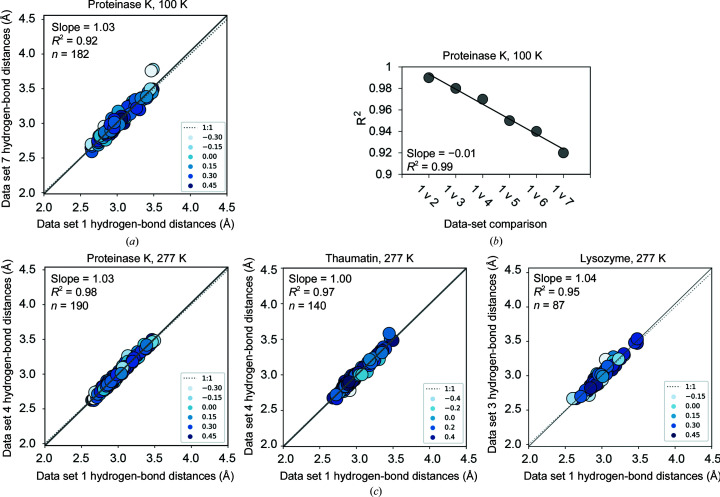
Cryo-cooling has been nearly universally adopted to mitigate X-ray damage and facilitate crystal handling in protein X-ray crystallography. However, cryo X-ray crystallographic data provide an incomplete window into the ensemble of conformations that is at the heart of protein function and energetics. Room-temperature (RT) X-ray crystallography provides accurate ensemble information, and recent developments allow conformational heterogeneity (the experimental manifestation of ensembles) to be extracted from single-crystal data. Nevertheless, high sensitivity to X-ray damage at RT raises concerns about data reliability. To systematically address this critical issue, increasingly X-ray-damaged high-resolution data sets (1.02-1.52 Å resolution) were obtained from single proteinase K, thaumatin and lysozyme crystals at RT (277 K). In each case a modest increase in conformational heterogeneity with X-ray damage was observed. Merging data with different extents of damage (as is typically carried out) had negligible effects on conformational heterogeneity until the overall diffraction intensity decayed to ∼70% of its initial value. These effects were compared with X-ray damage effects in cryo-cooled crystals by carrying out an analogous analysis of increasingly damaged proteinase K cryo data sets (0.9-1.16 Å resolution). X-ray damage-associated heterogeneity changes were found that were not observed at RT. This property renders it difficult to distinguish real from artefactual conformations and to determine the conformational response to changes in temperature. The ability to acquire reliable heterogeneity information from single crystals at RT, together with recent advances in RT data collection at accessible synchrotron beamlines, provides a strong motivation for the widespread adoption of RT X-ray crystallography to obtain conformational ensemble information.

Keywords: X-ray damage; conformational ensembles; hydrogen bonds; protein X-ray crystallography; room temperature.


Figures

Figure 1
Figure 1
Increasingly X-ray-damaged room-temperature data sets from single crystals of thaumatin, proteinase K and lysozyme. Each point represents a complete data set of 120 images that was collected with the same crystal orientation (referred to here as a sequential X-ray-damaged data set; see Section 2). (a) Normalized data-set intensity, (b) data-set resolution and (c) unit-cell volume as a function of the absorbed X-ray dose [average diffraction-weighted dose (DWD); see Section 2].
Figure 2
Figure 2
Evaluating the effects of X-ray damage on conformational heterogeneity at room temperature using multi-conformer models and disorder parameters (1 − S 2). (a) Illustration of multi-conformer models; two regions of the proteinase K 277 K multi-conformer model from the least damaged data set (PDB entry 7lpu) are shown. The multi-conformer model is shown as green sticks while the electron density is shown as a gray mesh (contour level of 1σ). (b) Average 1 − S 2 for all residues (black circles) and for disulfide bond-forming cysteine residues (red circles) as a function of the absorbed X-ray dose for each protein. (c) Top: boxplot showing the distribution of slopes obtained from a plot of the 1 − S 2 value as a function of the absorbed X-ray dose calculated for each residue in each protein. The boxes show the quartiles of the distributions, while the whiskers capture the entire distributions. Bottom: the data for all residues from the top plot now represented as a cumulative fraction. Dark to light gray: thaumatin, lysozyme, proteinase K. (d) Δ(1 − S 2) values between the least and most damaged data sets plotted on the structure of each protein. The diameter of the worm representation and the color both correlate with the magnitude of Δ(1 − S 2). (e) X-ray damage-free (extrapolated zero-dose) 1 − S 2 values plotted on the structure of each protein as in (d).
Figure 3
Figure 3
Ringer analysis to quantitatively evaluate the effects of X-ray damage on side-chain rotameric distributions. The panels depict examples from the proteinase K data sets obtained in this work. Data from the least (red, left) and most (blue, right) X-ray-damaged sequential data sets collected at (a) RT (277 K) or (d) cryo temperature. Visually, it appears that there is partial X-ray-induced breakage of the disulfide bond in (d) but not in (a). The arrow points to the appearance of a new population for Cys178 that manifests as a broadened distribution. The electron density (1σ, gray mesh) and model (sticks) of the Cys178–Cys249 disulfide bond are shown. (b, e) Normalized Ringer profiles. Plots of electron density (σ) as a function of dihedral angle χ1 for Cys178 (electron density from the least and most damaged data sets is in red and blue, respectively). Each point in a Ringer profile represents the electron density for a specified dihedral angle (see Section 2). The arrow indicates a difference between the least and most damaged data sets corresponding to the appearance of a new state for Cys178 in the damaged cryo data set (d). (c, f) Correlation plots between electron-density values (σ) from (b) and (e), respectively, of the least (x axis) and most (y axis) damaged data sets. An increasing number of off-diagonal points indicates a decreasing similarity between Ringer plots. The Pearson correlation coefficient (P CC) represents the agreement between the least and most damaged Ringer profiles, with P CC = 1 for a perfect correlation (dashed line). (g) Cumulative fraction of P CC for the dihedral angle χ1 of each residue in thaumatin (top), proteinase K (middle) and lysozyme (bottom). Similar results were obtained using mean-square error analysis instead of Pearson correlation coefficients (Supplementary Fig. S6). (h) The most significant outliers with P CC ≤ 0.95 for thaumatin (top), proteinase K (middle) and lysozyme (bottom). Supplementary Fig. S7 shows the Ringer profiles and correlation plots for all residues with P CC ≤ 0.95 (ten out of 485 residues).
Figure 4
Figure 4
Evaluating the effects of X-ray damage on conformational heterogeneity at RT (277 K) in data sets with increasingly damaged data merged together. (a) Analysis of cumulative X-ray-damaged data sets that have accumulated an increasing amount of damage to emulate typical RT data collection from single crystals. Average 1 − S 2 as a function of the relative intensity (I/I 1) of the most damaged diffraction data merged together. I/I 1 is the ratio of the total intensity of a diffraction data set from the beginning of data collection (I 1) and the intensity of a diffraction data set obtained from the same crystal orientation in later stages of data collection (I) (see Section 2). Open symbols are used when (I/I 1) is less than 0.6. (b) Bar plot of the average values for the zero-dose 1 − S 2 from sequential X-ray-damaged data sets and for 1 − S 2 from the cumulative X-ray-damaged (merged) thaumatin (blue), proteinase K (red) and lysozyme (green) data sets. (c) Comparison of zero-dose 1 − S 2 (far left) and 1 − S 2 from the least to most cumulative X-ray-damaged merged data sets (left to right) with 1 − S 2 values plotted on the structure of each protein. Note that the scales differ to best visualize each protein. The diameter of the worm representation is correlated with the magnitude of the 1 − S 2 values. The zero-dose 1 − S 2 and the 1 − S 2 from the least damaged data sets are qualitatively and quantitatively similar (see also Supplementary Fig. S11).
Figure 5
Figure 5
X-ray damage to cryo-cooled crystals can alter protein side-chain rotameric distributions. (a) Plot of the normalized total intensity versus absorbed dose for sequential X-ray-damaged data sets collected at 100 K from the same orientation of a single proteinase K crystal (Supplementary Table S11). The resolutions of the least and most damaged cryo data sets are indicated and the increasingly X-ray-damaged data sets are labeled with numbers from 1 (least X-ray damaged) to 7 (most X-ray damaged). (b) Cumulative fraction and (c) boxplots of Pearson correlation coefficients between the Ringer profiles for all residues in the least and increasingly damaged sequential cryo data sets. In (b) the lower row shows P CC values plotted on the proteinase K structure. The diameter of the worm representation is inversely correlated with the magnitude of P CC. (Supplementary Figs. S13–S18 show the Ringer plots for all residues with P CC ≤ 0.95.) The numbers above the cumulative plots indicate the data sets compared; for example ‘1v2’ indicates a comparison of data set 1 versus data set 2. (df) A subset of residues with a P CC of ≤0.95. (d) Left and middle columns: the least (data set 1) and most (data set 7) damaged cryo data sets; residues are shown as sticks. Electron density is shown as a gray mesh and is contoured at 1σ for all residues except His69, for which the contour is at 0.4σ. Right: raw Ringer profiles for the residues in (d) from the sequential X-ray-damaged data sets; the colors correspond to those in (a). (e) The same residues as in (d) but from the least (data set 1) and most (data set 4) damaged RT data sets. Electron density is shown as a gray mesh as in (d). (f) Normalized Ringer profiles for the residues in (d) and (e): the least and most damaged 100 K data sets are shown in red and blue, respectively, with the least damaged RT data set shown in green. Arrows show the appearance or disappearance of peaks. The RT Ringer profiles were obtained from electron-density maps with resolution matched to the resolution of the 100 K data sets (i.e. 1.16 Å).
Figure 5
Figure 5
X-ray damage to cryo-cooled crystals can alter protein side-chain rotameric distributions. (a) Plot of the normalized total intensity versus absorbed dose for sequential X-ray-damaged data sets collected at 100 K from the same orientation of a single proteinase K crystal (Supplementary Table S11). The resolutions of the least and most damaged cryo data sets are indicated and the increasingly X-ray-damaged data sets are labeled with numbers from 1 (least X-ray damaged) to 7 (most X-ray damaged). (b) Cumulative fraction and (c) boxplots of Pearson correlation coefficients between the Ringer profiles for all residues in the least and increasingly damaged sequential cryo data sets. In (b) the lower row shows P CC values plotted on the proteinase K structure. The diameter of the worm representation is inversely correlated with the magnitude of P CC. (Supplementary Figs. S13–S18 show the Ringer plots for all residues with P CC ≤ 0.95.) The numbers above the cumulative plots indicate the data sets compared; for example ‘1v2’ indicates a comparison of data set 1 versus data set 2. (df) A subset of residues with a P CC of ≤0.95. (d) Left and middle columns: the least (data set 1) and most (data set 7) damaged cryo data sets; residues are shown as sticks. Electron density is shown as a gray mesh and is contoured at 1σ for all residues except His69, for which the contour is at 0.4σ. Right: raw Ringer profiles for the residues in (d) from the sequential X-ray-damaged data sets; the colors correspond to those in (a). (e) The same residues as in (d) but from the least (data set 1) and most (data set 4) damaged RT data sets. Electron density is shown as a gray mesh as in (d). (f) Normalized Ringer profiles for the residues in (d) and (e): the least and most damaged 100 K data sets are shown in red and blue, respectively, with the least damaged RT data set shown in green. Arrows show the appearance or disappearance of peaks. The RT Ringer profiles were obtained from electron-density maps with resolution matched to the resolution of the 100 K data sets (i.e. 1.16 Å).
Figure 6
Figure 6
X-ray damage impacts the determination of hydrogen-bond lengths more at cryo temperature than at RT (277 K). (a) Correlation plots of hydrogen-bond lengths obtained from the least and most sequential X-ray-damaged data sets at cryo temperature. Correlation points are colored according to the relative B factor of the hydrogen-bonding groups such that higher values (darker blue) and lower values (white) correspond to atoms with low and high B factors relative to the average, respectively (see Section 2). (b) Correlation coefficients (R 2) obtained from correlation plots of hydrogen-bond lengths from the least damaged (‘1’) and increasingly damaged proteinase K 100 K structures (‘2–7’) (see Supplementary Fig. S23 for individual correlation plots). Differences between proteinase K structures are unlikely to result from differences in refinement strategy as all structures were refined using the same refinement parameters and increasingly X-ray-damaged models were refined in a consistent manner (see Section 2). (c) Correlation plots of hydrogen-bond lengths obtained from the least and most sequential X-ray-damaged data sets at room temperature. Colors used are as in (a). The analysis excluded all residues with more than one conformation present in the model (see Section 2). Similar results were obtained with all residues included (Supplementary Fig. S24).

Similar articles

Cited by

References

    1. Adam, V., Carpentier, P., Violot, S., Lelimousin, M., Darnault, C., Nienhaus, G. U. & Bourgeois, D. (2009). J. Am. Chem. Soc. 131, 18063–18065. - PubMed
    1. Afonine, P. V., Grosse-Kunstleve, R. W., Echols, N., Headd, J. J., Moriarty, N. W., Mustyakimov, M., Terwilliger, T. C., Urzhumtsev, A., Zwart, P. H. & Adams, P. D. (2012). Acta Cryst. D68, 352–367. - PMC - PubMed
    1. Alford, R. F., Leaver-Fay, A., Jeliazkov, J. R., O’Meara, M. J., DiMaio, F. P., Park, H., Shapovalov, M. V., Renfrew, P. D., Mulligan, V. K., Kappel, K., Labonte, J. W., Pacella, M. S., Bonneau, R., Bradley, P., Dunbrack, R. L., Das, R., Baker, D., Kuhlman, B., Kortemme, T. & Gray, J. J. (2017). J. Chem. Theory Comput. 13, 3031–3048. - PMC - PubMed
    1. Atakisi, H., Moreau, D. W. & Thorne, R. E. (2018). Acta Cryst. D74, 264–278. - PMC - PubMed
    1. Austin, R. H., Beeson, K. W., Eisenstein, L., Frauenfelder, H. & Gunsalus, I. C. (1975). Biochemistry, 14, 5355–5373. - PubMed