Probing ligand binding of endothiapepsin by `temperature-resolved' macromolecular crystallography
- PMID: 35916221
- PMCID: PMC9344481
- DOI: 10.1107/S205979832200612X
Probing ligand binding of endothiapepsin by `temperature-resolved' macromolecular crystallography
Abstract
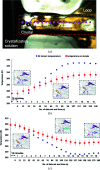
Continuous developments in cryogenic X-ray crystallography have provided most of our knowledge of 3D protein structures, which has recently been further augmented by revolutionary advances in cryoEM. However, a single structural conformation identified at cryogenic temperatures may introduce a fictitious structure as a result of cryogenic cooling artefacts, limiting the overview of inherent protein physiological dynamics, which play a critical role in the biological functions of proteins. Here, a room-temperature X-ray crystallographic method using temperature as a trigger to record movie-like structural snapshots has been developed. The method has been used to show how TL00150, a 175.15 Da fragment, undergoes binding-mode changes in endothiapepsin. A surprising fragment-binding discrepancy was observed between the cryo-cooled and physiological temperature structures, and multiple binding poses and their interplay with DMSO were captured. The observations here open up new promising prospects for structure determination and interpretation at physiological temperatures with implications for structure-based drug discovery.
Keywords: conformational heterogeneity; endothiapepsin; fragment binding; protein plasticity; room temperature macromolecular crystallography.
open access.
Figures


Similar articles
-
Cryo2RT: a high-throughput method for room-temperature macromolecular crystallography from cryo-cooled crystals.Acta Crystallogr D Struct Biol. 2024 Aug 1;80(Pt 8):620-628. doi: 10.1107/S2059798324006697. Epub 2024 Jul 25. Acta Crystallogr D Struct Biol. 2024. PMID: 39052318 Free PMC article.
-
Structures of endothiapepsin-fragment complexes from crystallographic fragment screening using a novel, diverse and affordable 96-compound fragment library.Acta Crystallogr F Struct Biol Commun. 2016 May;72(Pt 5):346-55. doi: 10.1107/S2053230X16004623. Epub 2016 Apr 22. Acta Crystallogr F Struct Biol Commun. 2016. PMID: 27139825 Free PMC article.
-
Macromolecular room temperature crystallography.Q Rev Biophys. 2021 Jan 8;54:e1. doi: 10.1017/S0033583520000128. Q Rev Biophys. 2021. PMID: 33413726 Review.
-
Room-temperature crystallography reveals altered binding of small-molecule fragments to PTP1B.Elife. 2023 Mar 7;12:e84632. doi: 10.7554/eLife.84632. Elife. 2023. PMID: 36881464 Free PMC article.
-
Evolving Experimental Techniques for Structure-Based Drug Design.J Phys Chem B. 2022 Sep 8;126(35):6599-6607. doi: 10.1021/acs.jpcb.2c04344. Epub 2022 Aug 27. J Phys Chem B. 2022. PMID: 36029222 Free PMC article. Review.
Cited by
-
Cryo2RT: a high-throughput method for room-temperature macromolecular crystallography from cryo-cooled crystals.Acta Crystallogr D Struct Biol. 2024 Aug 1;80(Pt 8):620-628. doi: 10.1107/S2059798324006697. Epub 2024 Jul 25. Acta Crystallogr D Struct Biol. 2024. PMID: 39052318 Free PMC article.
-
Micro-structured polymer fixed targets for serial crystallography at synchrotrons and XFELs.IUCrJ. 2023 Nov 1;10(Pt 6):678-693. doi: 10.1107/S2052252523007595. IUCrJ. 2023. PMID: 37727961 Free PMC article.
-
Advancing macromolecular structure determination with microsecond X-ray pulses at a 4th generation synchrotron.Commun Chem. 2025 Jan 7;8(1):6. doi: 10.1038/s42004-024-01404-y. Commun Chem. 2025. PMID: 39775172 Free PMC article.
-
Fragment-based screening targeting an open form of the SARS-CoV-2 main protease binding pocket.Acta Crystallogr D Struct Biol. 2024 Feb 1;80(Pt 2):123-136. doi: 10.1107/S2059798324000329. Epub 2024 Jan 30. Acta Crystallogr D Struct Biol. 2024. PMID: 38289714 Free PMC article.
-
Introduction to the virtual thematic issue on room-temperature biological crystallography.IUCrJ. 2023 May 1;10(Pt 3):248-250. doi: 10.1107/S2052252523002968. IUCrJ. 2023. PMID: 37000491 Free PMC article.
References
-
- Baek, M., DiMaio, F., Anishchenko, I., Dauparas, J., Ovchinnikov, S., Lee, G., Wang, J., Cong, Q., Kinch, L., Schaeffer, R., Millán, C., Park, H., Adams, C., Glassman, C., DeGiovanni, A., Pereira, J., Rodrigues, A., van Dijk, A. A., Ebrecht, A., Opperman, D. J., Sagmeister, T., Buhlheller, C., Pavkov-Keller, T., Rathinaswamy, M. K., Dalwadi, U., Yip, C. K., Burke, J. E., Garcia, K. C., Grishin, N. V., Adams, P. D., Read, R. J. & Baker, D. (2021). Science, 373, 871–876. - PMC - PubMed
-
- Bedi, R. K., Huang, D., Wiedmer, L., Li, Y., Dolbois, A., Wojdyla, J. A., Sharpe, M. E., Caflisch, A. & Sledz, P. (2020). ACS Chem. Biol. 15, 618–625. - PubMed
MeSH terms
Substances
Grants and funding
LinkOut - more resources
Full Text Sources

