Knowledge-based prediction of DNA hydration using hydrated dinucleotides as building blocks
- PMID: 35916227
- PMCID: PMC9344474
- DOI: 10.1107/S2059798322006234
Knowledge-based prediction of DNA hydration using hydrated dinucleotides as building blocks
Abstract
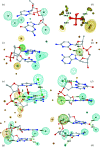
Water plays an important role in stabilizing the structure of DNA and mediating its interactions. Here, the hydration of DNA was analyzed in terms of dinucleotide fragments from an ensemble of 2727 nonredundant DNA chains containing 41 853 dinucleotides and 316 265 associated first-shell water molecules. The dinucleotides were classified into categories based on their 16 sequences and the previously determined structural classes known as nucleotide conformers (NtCs). The construction of hydrated dinucleotide building blocks allowed dinucleotide hydration to be calculated as the probability of water density distributions. Peaks in the water densities, known as hydration sites (HSs), uncovered the interplay between base and sugar-phosphate hydration in the context of sequence and structure. To demonstrate the predictive power of hydrated DNA building blocks, they were then used to predict hydration in an independent set of crystal and NMR structures. In ten tested crystal structures, the positions of predicted HSs and experimental waters were in good agreement (more than 40% were within 0.5 Å) and correctly reproduced the known features of DNA hydration, for example the `spine of hydration' in B-DNA. Therefore, it is proposed that hydrated building blocks can be used to predict DNA hydration in structures solved by NMR and cryo-EM, thus providing a guide to the interpretation of experimental data and computer models. The data for the hydrated building blocks and the predictions are available for browsing and visualization at the website https://watlas.datmos.org/watna/.
Keywords: DNA hydration; WatNA; dinucleotide fragments; knowledge-based prediction; water.
open access.
Figures


Similar articles
-
A systematic method for studying the spatial distribution of water molecules around nucleic acid bases.Biophys J. 1993 Dec;65(6):2291-303. doi: 10.1016/S0006-3495(93)81306-7. Biophys J. 1993. PMID: 8312469 Free PMC article.
-
A unified dinucleotide alphabet describing both RNA and DNA structures.Nucleic Acids Res. 2020 Jun 19;48(11):6367-6381. doi: 10.1093/nar/gkaa383. Nucleic Acids Res. 2020. PMID: 32406923 Free PMC article.
-
Hydration patterns and intermolecular interactions in A-DNA crystal structures. Implications for DNA recognition.J Mol Biol. 1995 May 5;248(3):662-78. doi: 10.1006/jmbi.1995.0250. J Mol Biol. 1995. PMID: 7752232
-
Crystal structures of A-DNA duplexes.Biopolymers. 1997;44(1):45-63. doi: 10.1002/(SICI)1097-0282(1997)44:1<45::AID-BIP4>3.0.CO;2-#. Biopolymers. 1997. PMID: 9097733 Review.
-
Modeling DNA structures.Prog Nucleic Acid Res Mol Biol. 1992;43:87-108. doi: 10.1016/s0079-6603(08)61045-4. Prog Nucleic Acid Res Mol Biol. 1992. PMID: 1410449 Review.
Cited by
-
The role of water in mediating DNA structures with epigenetic modifications, higher-order conformations and drug-DNA interactions.RSC Chem Biol. 2025 Mar 14;6(5):699-720. doi: 10.1039/d4cb00308j. eCollection 2025 May 8. RSC Chem Biol. 2025. PMID: 40171245 Free PMC article. Review.
-
DNA simulation benchmarks revealed with the accumulation of high-resolution structures.Biophys Rev. 2024 Jun 18;16(3):275-284. doi: 10.1007/s12551-024-01198-2. eCollection 2024 Jun. Biophys Rev. 2024. PMID: 39099846 Free PMC article. Review.
-
Principles of ion binding to RNA inferred from the analysis of a 1.55 Å resolution bacterial ribosome structure - Part I: Mg2.Nucleic Acids Res. 2025 Jan 7;53(1):gkae1148. doi: 10.1093/nar/gkae1148. Nucleic Acids Res. 2025. PMID: 39791453 Free PMC article.
-
Insights into DNA solvation found in protein-DNA structures.Biophys J. 2022 Dec 20;121(24):4749-4758. doi: 10.1016/j.bpj.2022.11.019. Epub 2022 Nov 14. Biophys J. 2022. PMID: 36380591 Free PMC article. Review.
-
Conformation-based refinement of 18-mer DNA structures.Acta Crystallogr D Struct Biol. 2023 Jul 1;79(Pt 7):655-665. doi: 10.1107/S2059798323004679. Epub 2023 Jun 20. Acta Crystallogr D Struct Biol. 2023. PMID: 37338420 Free PMC article.
References
-
- Auffinger, P. & Hashem, Y. (2007a). Bioinformatics, 23, 1035–1037. - PubMed
-
- Auffinger, P. & Hashem, Y. (2007b). Curr. Opin. Struct. Biol. 17, 325–333. - PubMed
-
- Ball, P. (2008). Chem. Rev. 108, 74–108. - PubMed
-
- Berman, H. M., Battistuz, T., Bhat, T. N., Bluhm, W. F., Bourne, P. E., Burkhardt, K., Feng, Z., Gilliland, G. L., Iype, L., Jain, S., Fagan, P., Marvin, J., Padilla, D., Ravichandran, V., Schneider, B., Thanki, N., Weissig, H., Westbrook, J. D. & Zardecki, C. (2002). Acta Cryst. D58, 899–907. - PubMed
MeSH terms
Substances
Grants and funding
LinkOut - more resources
Full Text Sources

