

In-Depth Mass Spectrometry-Based Proteomics of Formalin-Fixed, Paraffin-Embedded Tissues with a Spatial Resolution of 50-200 μm
- PMID: 35916235
- PMCID: PMC9767749
- DOI: 10.1021/acs.jproteome.2c00409
In-Depth Mass Spectrometry-Based Proteomics of Formalin-Fixed, Paraffin-Embedded Tissues with a Spatial Resolution of 50-200 μm
Abstract
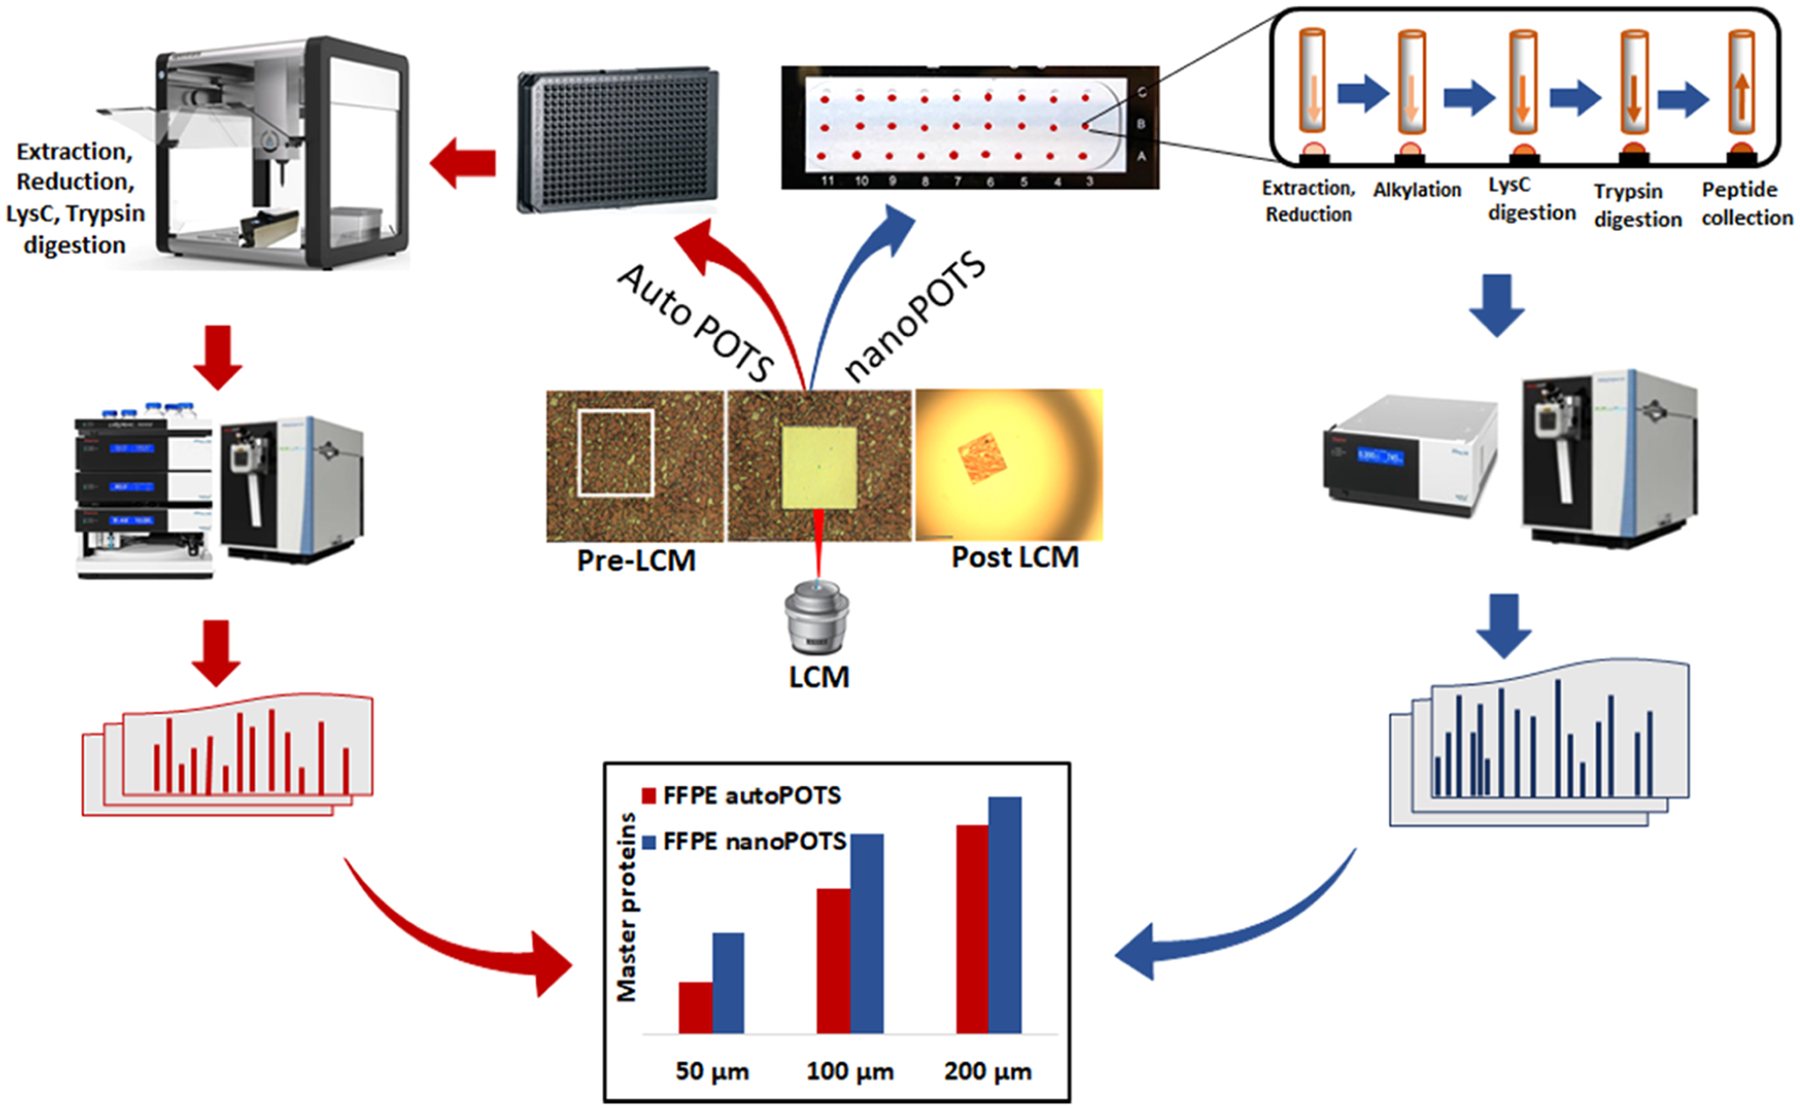
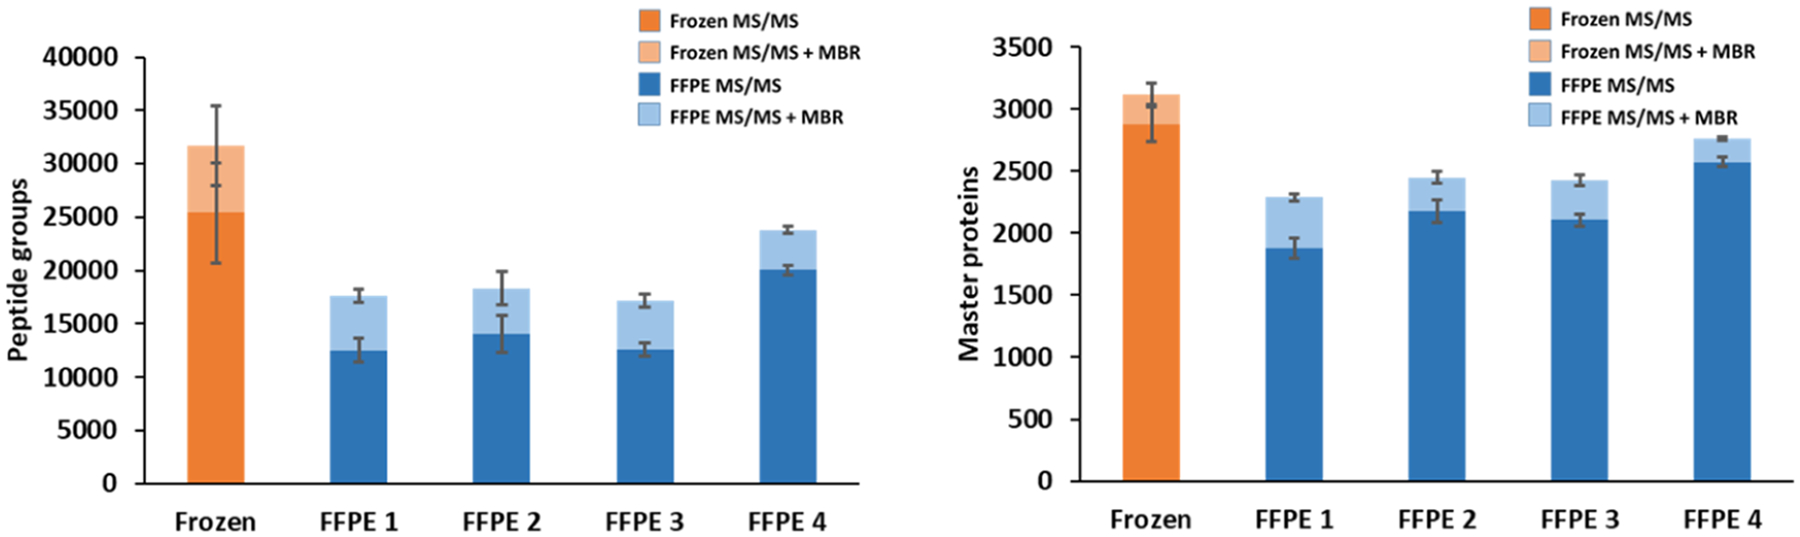
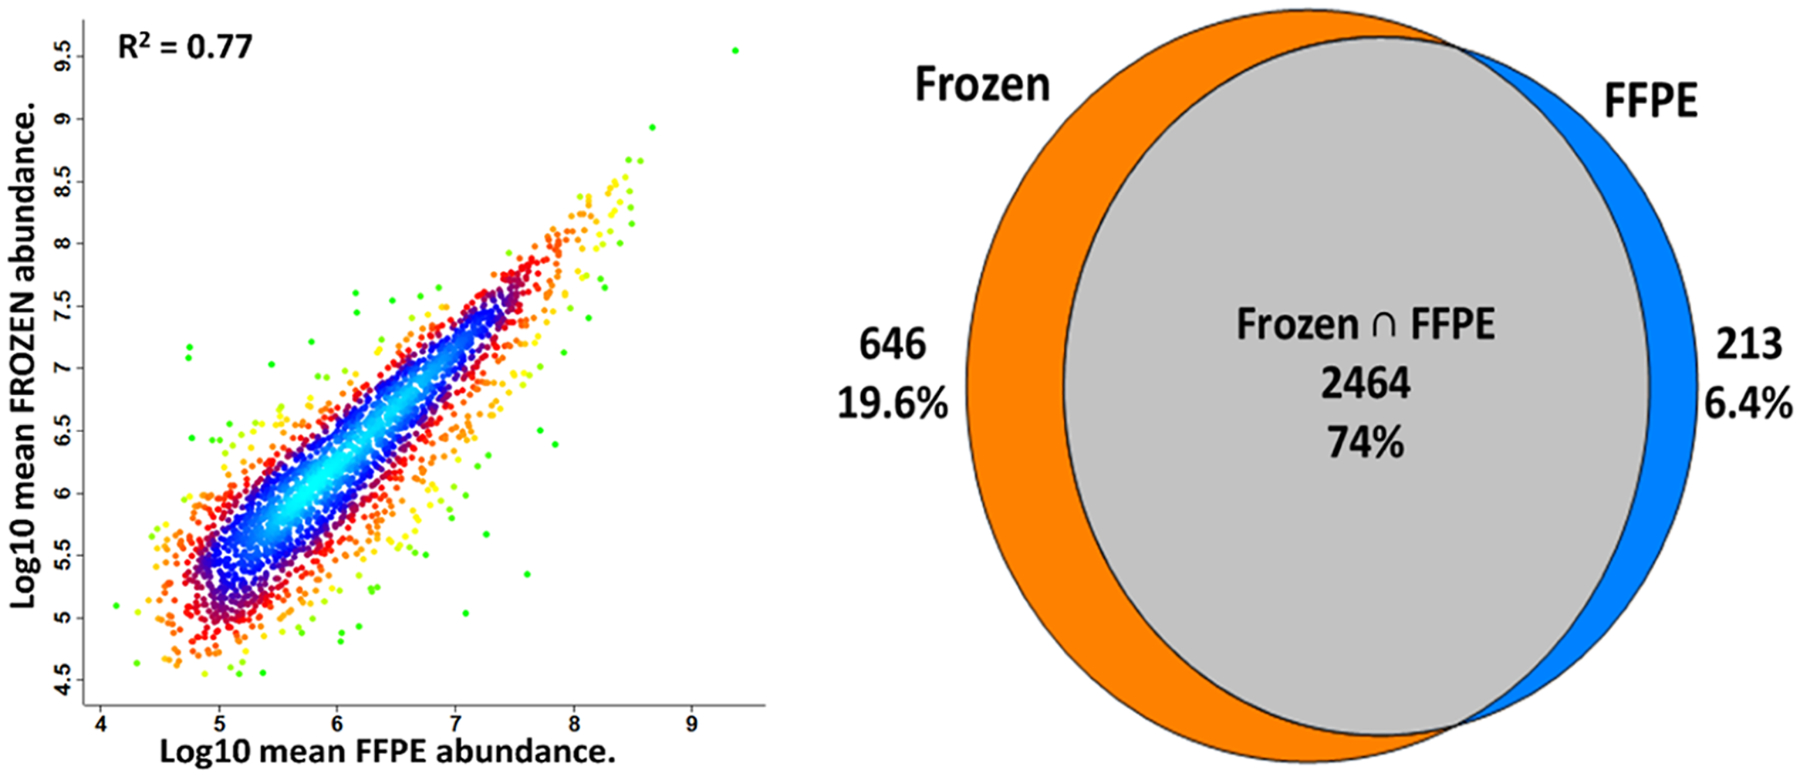
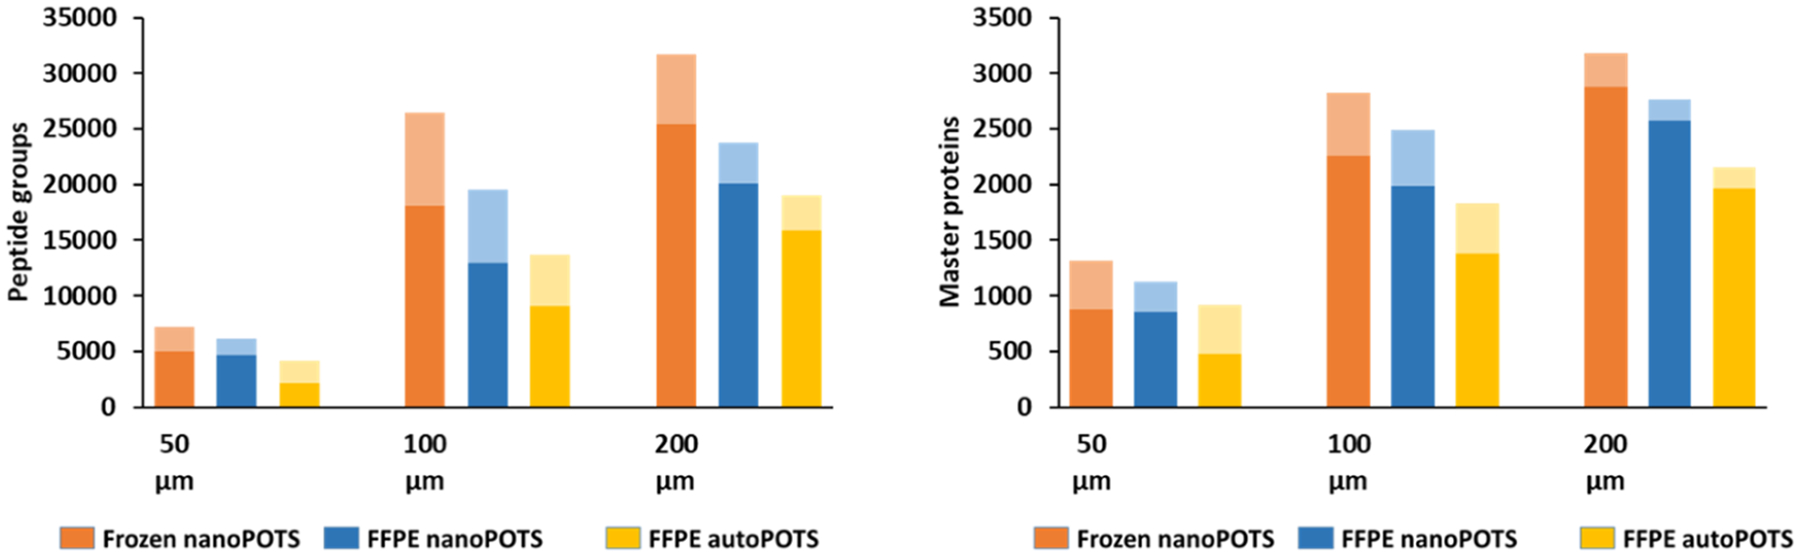
Formalin-fixed, paraffin-embedded (FFPE) tissues are banked in large repositories to cost-effectively preserve valuable specimens for later study. With the rapid growth of spatial proteomics, FFPE tissues can serve as a more accessible alternative to more commonly used frozen tissues. However, extracting proteins from FFPE tissues is challenging due to cross-links formed between proteins and formaldehyde. Here, we have adapted the nanoPOTS sample processing workflow, which was previously applied to single cells and fresh-frozen tissues, to profile protein expression from FFPE tissues. Following the optimization of extraction solvents, times, and temperatures, we identified an average of 1312 and 3184 high-confidence master proteins from 10 μm thick FFPE-preserved mouse liver tissue squares having lateral dimensions of 50 and 200 μm, respectively. The observed proteome coverage for FFPE tissues was on average 88% of that achieved for similar fresh-frozen tissues. We also characterized the performance of our fully automated sample preparation and analysis workflow, termed autoPOTS, for FFPE spatial proteomics. This modified nanodroplet processing in one pot for trace samples (nanoPOTS) and fully automated processing in one pot for trace sample (autoPOTS) workflows provides the greatest coverage reported to date for high-resolution spatial proteomics applied to FFPE tissues. Data are available via ProteomeXchange with identifier PXD029729.
Keywords: FFPE; LCM; autoPOTS; mass spectrometry; nanodroplet; spatial proteomics.
Conflict of interest statement
The authors declare the following competing financial interest(s): RTK has a financial interest in MicrOmics Technologies, which provided nanoelectrospray emitters for this study.
Figures
References
-
- Almendro V; Marusyk A; Polyak K Cellular Heterogeneity and Molecular Evolution in Cancer. Annu. Rev. Pathol.: Mech. Dis 2013, 8, 277–302. - PubMed
-
- Lundberg E; Borner GHH Spatial Proteomics: A Powerful Discovery Tool for Cell Biology. Nat. Rev. Mol. Cell. Biol 2019, 20, 285–302. - PubMed
-
- Uhlen M; Oksvold P; Fagerberg L; Lundberg E; Jonasson K; Forsberg M; Zwahlen M; Kampf C; Wester K; Hober S; Wernerus H; Björling L; Ponten F Towards a Knowledge-Based Human Protein Atlas. Nat. Biotechnol 2010, 28, 1248–1250. - PubMed
-
- Giesen C; Wang HAO; Schapiro D; Zivanovic N; Jacobs A; Hattendorf B; Schüffler PJ; Grolimund D; Buhmann JM; Brandt S; Varga Z; Wild PJ; Günther D; Bodenmiller B Highly Multiplexed Imaging of Tumor Tissues with Subcellular Resolution by Mass Cytometry. Nat. Methods 2014, 11, 417–422. - PubMed
Publication types
MeSH terms
Substances
Grants and funding
LinkOut - more resources
Full Text Sources
