

FIBCD1 is an endocytic GAG receptor associated with a novel neurodevelopmental disorder
- PMID: 35916241
- PMCID: PMC9449597
- DOI: 10.15252/emmm.202215829
FIBCD1 is an endocytic GAG receptor associated with a novel neurodevelopmental disorder
Abstract
Whole-exome sequencing of two patients with idiopathic complex neurodevelopmental disorder (NDD) identified biallelic variants of unknown significance within FIBCD1, encoding an endocytic acetyl group-binding transmembrane receptor with no known function in the central nervous system. We found that FIBCD1 preferentially binds and endocytoses glycosaminoglycan (GAG) chondroitin sulphate-4S (CS-4S) and regulates GAG content of the brain extracellular matrix (ECM). In silico molecular simulation studies and GAG binding analyses of patient variants determined that such variants are loss-of-function by disrupting FIBCD1-CS-4S association. Gene knockdown in flies resulted in morphological disruption of the neuromuscular junction and motor-related behavioural deficits. In humans and mice, FIBCD1 is expressed in discrete brain regions, including the hippocampus. Fibcd1 KO mice exhibited normal hippocampal neuronal morphology but impaired hippocampal-dependent learning. Further, hippocampal synaptic remodelling in acute slices from Fibcd1 KO mice was deficient but restored upon enzymatically modulating the ECM. Together, we identified FIBCD1 as an endocytic receptor for GAGs in the brain ECM and a novel gene associated with an NDD, revealing a critical role in nervous system structure, function and plasticity.
Keywords: FIBCD1; extracellular matrix; genetics; glycosaminoglycans; neurodevelopmental disorder.
© 2022 The Authors. Published under the terms of the CC BY 4.0 license.
Figures
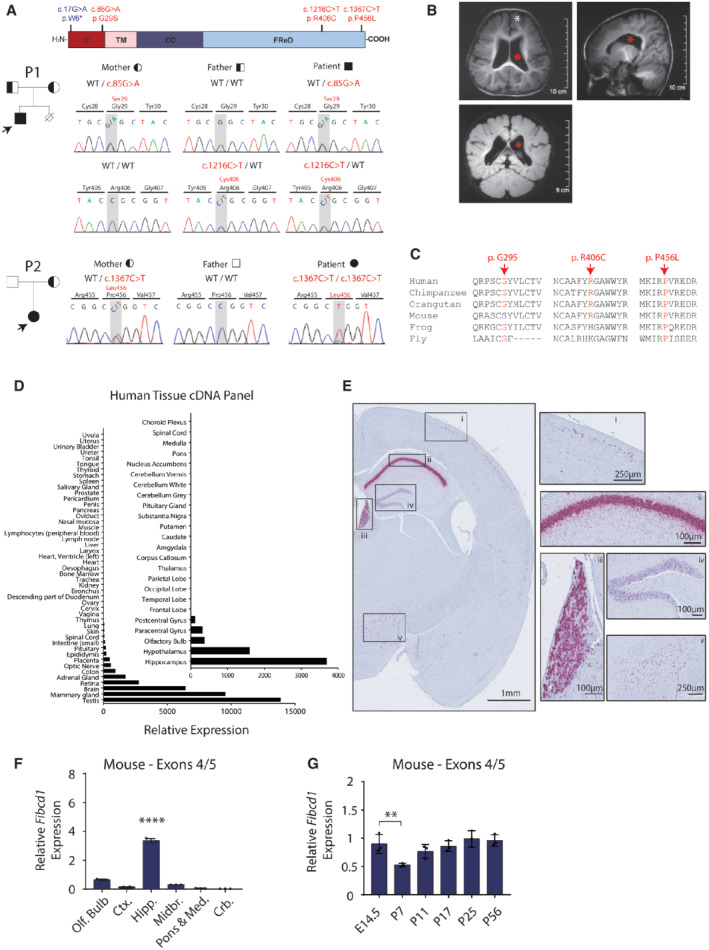
- A
Top, schematic of FIBCD1 protein, with labelled intracellular domain (IC, red), transmembrane domain (TM, pink), coiled coil (CC, dark blue) and FReD (light blue). Location of patient variants denoted in red; blue variant denotes the control used in later experiments. Left, family pedigrees of P1 (top) and P2 (bottom) showing affected proband (filled, arrow) and carriers (half‐filled). Right, representative traces of Sanger sequencing to confirm segregation within the family. P1 variants are inherited in autosomal recessive manner; P2 exhibits inheritance by uniparental disomy.
- B
P2 MRI images (axial, sagittal and coronal plane) showing ventriculomegaly (red asterisk), slightly thickened cortex and bilateral enlarged gyri (white asterisk).
- C
Amino acid sequence conservation sites of patient variants Gly29Ser, Arg406Cys and Pro456Leu in different species, as labelled.
- D
FIBCD1 expression in various human visceral tissues and brain regions (inset). Expression is plotted relative to the tissue with lowest detectable expression (trachea; inset, choroid plexus). n represents technical replicates (n = 2).
- E
In situ hybridisation with probe pairs specific to Fibcd1 mRNA (purple) in mouse whole‐brain coronal section, left hemisphere shown. Insets of high Fibcd1‐expressing regions are (i) cortex, (ii) pyramidal cell layer of hippocampus, (iii) medial habenula, (iv) granule cell layer of the dentate gyrus and (v) hypothalamus. Scale bar sizes are as indicated, (n = 3).
- F
Relative mRNA expression levels of mouse Fibcd1 (primers binding to exons 4 and 5) normalised to Gapdh, in the indicated adult brain regions, analysed by RT–qPCR (n = 3). Olf.Bulb, olfactory bulb; Ctx., cortex; Hipp., hippocampus; Midbr., midbrain; Pons & Med, pons and medulla; Crb., cerebellum.
- G
Relative mRNA expression levels of mouse Fibcd1 (primers binding to exons 4 and 5) normalised to Gapdh in the hippocampus of the indicated developmental time points, analysed by RT–qPCR (n = 3).
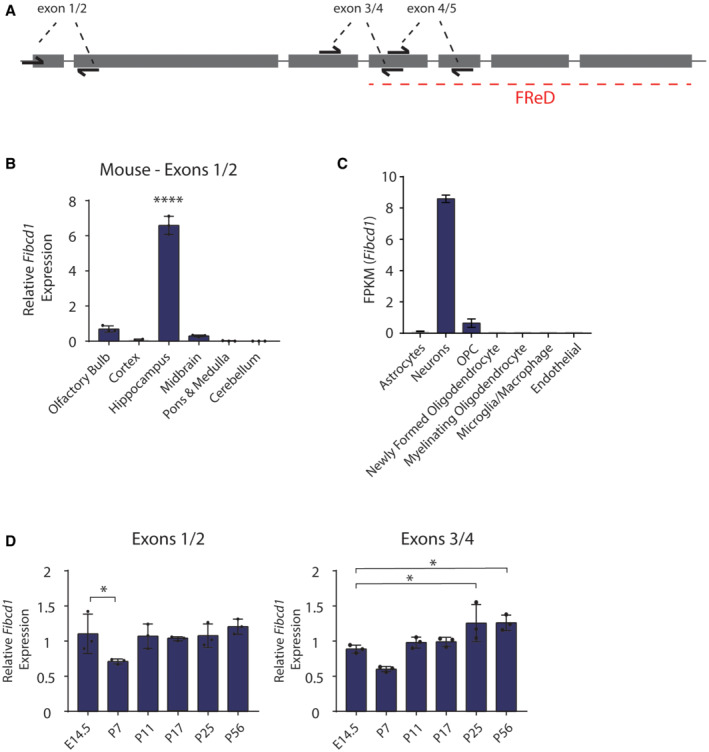
- A
Schematic of mouse Fibcd1 exons (grey rectangles), introns (grey lines) and location of primer pair binding (“exons 1/2, 3/4 and 4/5”) used for RT–qPCR. Exon sizes are to scale; introns and primers are not. The exons coding for FIBCD1 FReD is indicated by a red dashed line.
- B
Relative mRNA expression levels of mouse Fibcd1 (primers binding to exon 1 and 2) normalised to Gapdh in the indicated brain regions, analysed by RT–qPCR (n = 3).
- C
Fibcd1 expression in bulk populations of sorted mouse brain cell population, from
brainrnaseq.org . OPC, oligodendrocyte precursor cell. - D
Relative mRNA expression levels of mouse Fibcd1 (primers binding to exons 1 and 2 and exons 3 and 4) normalised to Gapdh in the hippocampus of the indicated time points, analysed by RT–qPCR (n = 3).
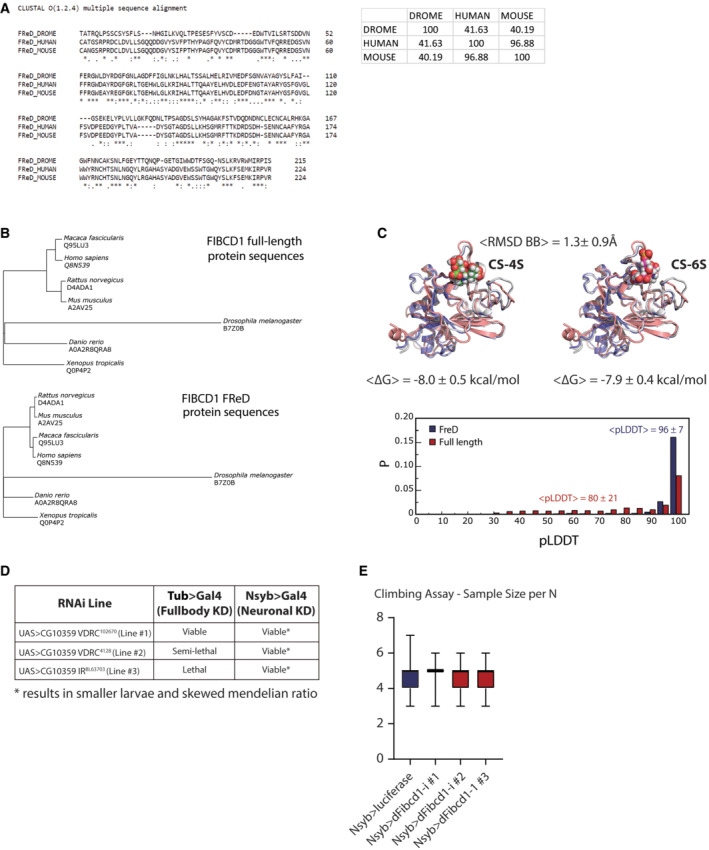
- A
Alignment of fly (DROME), human and mouse FReD protein sequences. Inset shows percent identity matrix (% homology) between fly, human and mouse FReD protein sequences.
- B
Phylogenetic trees based on multiple‐sequence alignments of either full‐length FIBCD1 (upper) or FReD amino acid sequences (lower) for the six species with available AlphaFold structures and D. melanogaster (AlphaFold structure predicted de novo).
- C
Upper, 3D structures of FReD as predicted by AlphaFold for human (H. sapiens, blue), mouse (M. musculus, grey) and fly (D. melanogaster, pink) with CS‐4S (left) and CS‐6S (right) docked to the human variant. The average pairwise backbone RMSD and standard deviation over all possible pairs chosen from among the seven species studied are indicated above the structures. The average predicted binding free energies and standard deviations between FReD and CS‐4S (left) or CS‐6S (right) over all seven species studied are given below the structures. Lower, distributions of AlphaFold predicted local distance difference test (pLDDT) scores for predictions of either full‐length FIBCD1 or FReD alone pooled over all seven species studied. The high confidence of the FReD structure predictions is reflected in the extreme value of the average pLDDT score (96 ± 7).
- D
Summary of 3 D. melanogaster RNAi lines crossed to full body GAL4 driver (tubulin) or neuron‐specific (Nsyb) and the effects on viability.
- E
Number of flies analysed for the climbing assay in Fig 2D. Box plots depict data mean and upper and lower quartile; whiskers are the minimum and maximum number
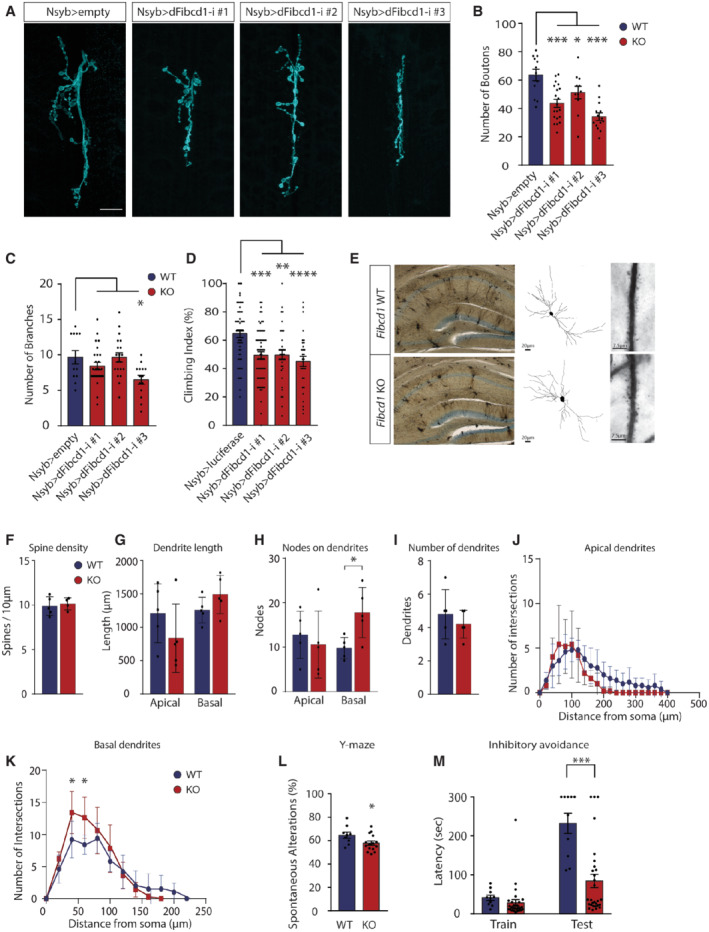
- A
Immunofluorescent images of control and neuronal (Nsyb) CG10359 (dFibcd1) RNAi‐mediated knockdown D. melanogaster, 3rd instar larvae NMJ (NMJ6/7) stained with anti‐horseradish peroxidase antibodies. Empty control and RNAi‐mediated knockdown of CG10359 (dFibcd1‐i) lines #1, 2 and 3 shown. Scale bar = 20 μm. Representative images of three independent experiments.
- B, C
Quantification of (A), control and CG10359 knockdown lines NMJ neuron bouton number (B) and NMJ neuron axon branch points (C). n(empty) = 12; n(line #1) = 20; n(line #2) = 11; n(line #3) = 14.
- D
Negative geotaxis assay of adult Drosophila control and RNAi lines #1, #2 and #3 compared to control lines expressing RNAi targeting luciferase. Climbing index represents the percentage of flies that crossed the 5 cm vial mark within 5 s after gentle tapping to the bottom of the vial. N is the number of tested vials: n(luciferase) = 53; n(line #1) = 63; n(line #2) = 36; n(line #3) = 31.For flies per vial, see Fig EV2D.
- E
Representative coronal section images of Golgi–Cox staining of Fibcd1 WT and KO hippocampi (left), Neurolucida tracing of hippocampal CA1 pyramidal neurons (middle) and apical dendrites with spines (right). Scale bars as indicated.
- F–I
Quantifications of (F) dendritic spine density, (G) total length of apical and basal dendrites, (H) dendritic nodes in apical and basal dendrites, and (I) number of dendrites (n = 5).
- J, K
Sholl analysis of apical and basal dendrites (n = 5).
- L
Percentage of mouse spontaneous alterations in the Y‐maze (n(Fibcd1 WT) = 9; n(Fibcd1 KO) = 15).
- M
Latency to enter the dark (foot shock) chamber during the inhibitory avoidance task at training and testing (24 h post‐training) days (n(Fibcd1 WT) = 8; n(Fibcd1 KO) = 15).
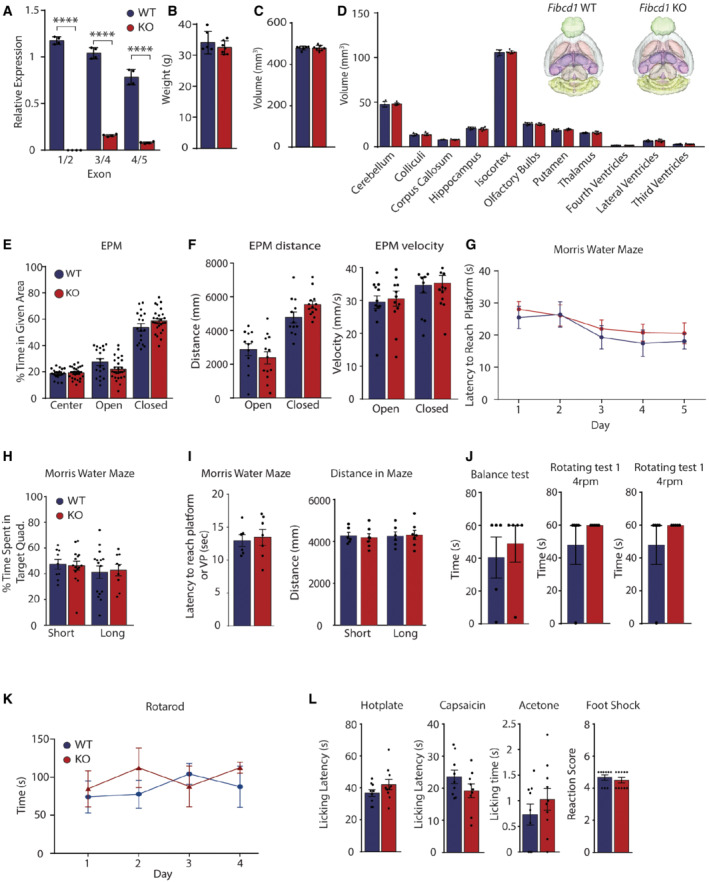
- A
RT–qPCR of Fibcd1 WT and KO adult mouse hippocampi (n = 4) using primer pairs binding to indicated exons (see Fig EV1A).
- B–D
Body weight (B) total brain volume (C) and brain volumes of denoted regions (D) of the indicated genotypes as assessed by MRI volumetric analysis. n(Fibcd1 WT) = 6; n(Fibcd1 KO) = 7. Insets are 3D representative MRI renditions of control (left) and Fibcd1 KO (right) adult male brains with analysed brain regions pseudo‐coloured.
- E
Percentage of time mice spent in the centre, open and closed arms of the elevated plus maze (EPM). n(Fibcd1 WT) = 18; n(Fibcd1 KO) = 26.
- F
The distance (left) and velocity (right) travelled by the mice in the open and closed arm of the EPM. n(Fibcd1 WT) = 18; n(Fibcd1 KO) = 26.
- G
Average latency of eight trials for each cohort to reach the target platform during the five training days in the Morris water maze (MWM). n(Fibcd1 WT) = 9; n(Fibcd1KO) = 15.
- H
Percentage of time spent in the target quadrant during the short‐ and long‐term probe trial in the MWM. n(Fibcd1 WT) = 9; n(Fibcd1 KO) = 15.
- I
Left, latency to reach the visible platform (VP) in the MWM; and right, distance travelled during the short‐ and long‐term probe trials in the MWM. n(Fibcd1 WT) = 6; n(Fibcd1 KO) = 7).
- J
Left, latency of the animal to fall off the beam in the non‐rotating Rotarod performance test; right, latency to fall of the 4 rpm rotating beam of two independent trials (n = 5).
- K
Average latency of four consecutive trials to fall off the 4–40 rpm rotating beam in a Rotarod performance test (n = 5).
- L
Acute pain responses to hotplate, intraplantar capsaicin injections or acetone drop quantified as time to first response or time spent licking or biting the injected paw, respectively, and reaction score to electrical foot shock. n(Fibcd1 WT) = 9; n(Fibcd1 KO) = 10.
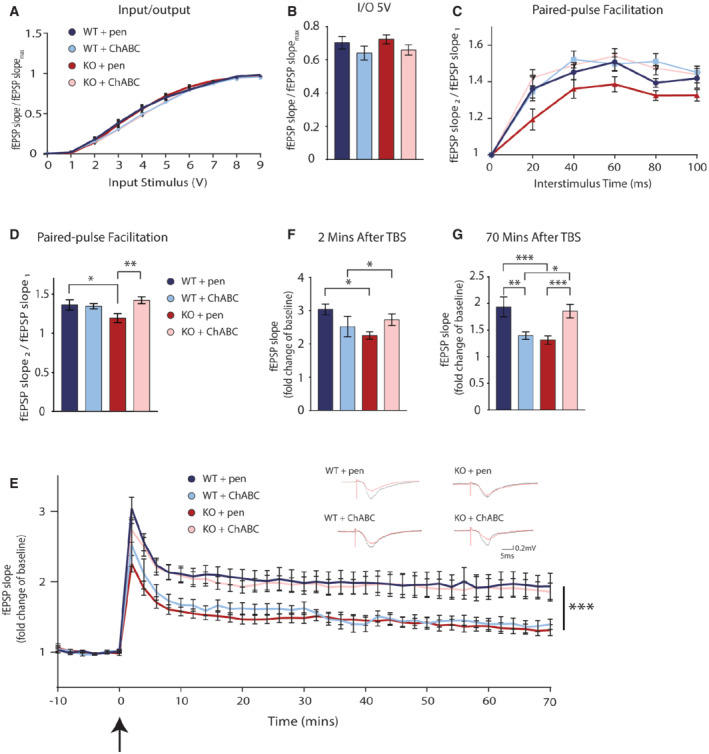
- A, B
Input/output assessment of synaptic transmission in CA3‐CA1 Schaffer collateral pathway of adult mouse hippocampal slices. Fibcd1 WT (blue) and KO (red) hippocampal slices, pre‐treated with penicillinase (pen) or chondroitinase ABC (ChABC). n(WT + pen) = 22; n(KO + pen) = 27; n(WT + ChABC) = 21; n(KO + ChABC) = 30.
- C, D
Paired‐pulse facilitation in CA3‐CA1 Schaffer collateral pathway of acute hippocampal slices from Fibcd1 WT and KO mice. Pre‐treatment with pen or ChABC as labelled. n(WT + pen) = 17; n(KO + pen) = 20; n(WT + ChABC) = 19; n(KO + ChABC) = 25.
- E
Long‐term potentiation in CA3‐CA1 Schaffer collateral pathways of acute hippocampal slices. Theta‐burst stimulation (TBS) is at time 0 indicated by the arrow. n(WT + pen) = 9; n(KO + pen) = 15; n(WT + ChABC) = 6; n(KO + ChABC) = 12. Insets are representative traces.
- F, G
LTP fold change of baseline at 2 (F) and 70 (G) minutes post‐theta‐burst stimulation (TBS) in adult mouse hippocampal slices. n(WT + pen) = 9; n(KO + pen) = 15; n(WT + ChABC) = 6; n(KO + ChABC) = 12.
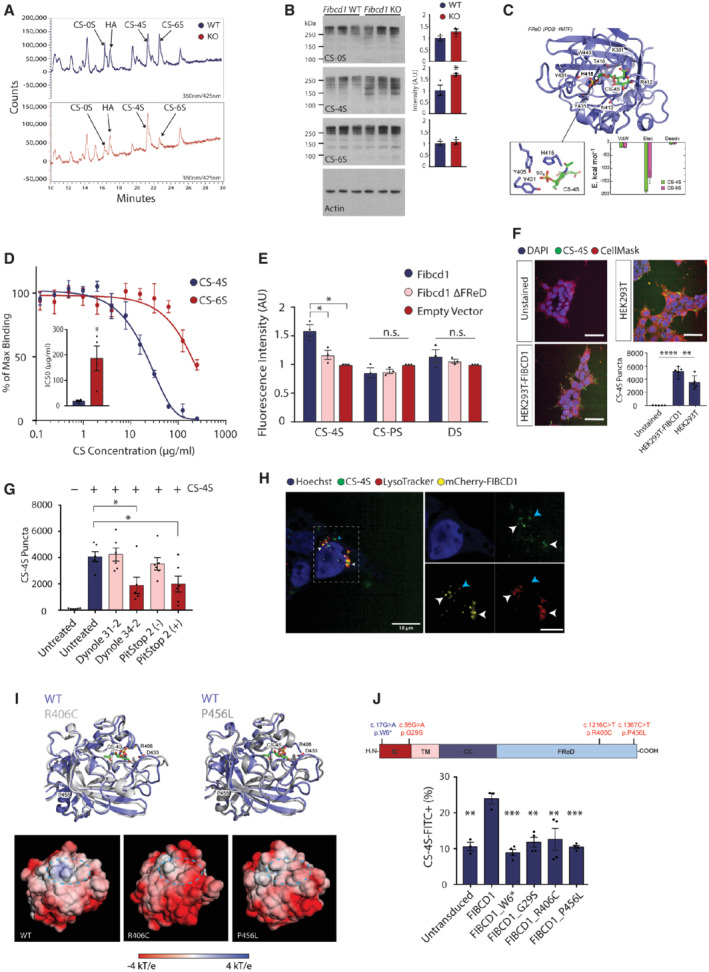
- A
HPLC traces representative of three independent experiments of variously sulphated GAGs (as labelled) in adult Fibcd1 WT (top, blue) and KO (bottom, red) CA1 pyramidal cell layer hippocampi. Unsulphated CS, CS‐0S; hyaluronic acid, HA; 4‐O‐sulphated CS, CS‐4S; 6‐O‐sulphated CS, CS‐6S.
- B
Immunoblot analysis (left) and quantification of signal intensity (right) of Fibcd1 WT (blue) vs. Fibcd1 KO littermates (red) adult hippocampi with antibodies against CS‐0S, CS‐4S, CS‐6S and actin as a loading control. Each lane represents an independent animal (n = 3). Protein marker sizes are indicated.
- C
Top binding pose for in silico docking of CS‐4S to FIBCD1 FReD (PDB 4M7F). Inset (left) is the orientation of CS‐4S within the FReD binding pocket and (right) binding free energy of CS‐4S vs. CS‐6S. Van der Waals (vdW), electrostatic (Elec) and desolvation (Desolv) components of binding free energy change.
- D
Competitive ELISA with increasing concentrations of CS‐4S (blue circles) or ‐6S (red circles) incubated with recombinant FIBCD1 FReD and acetylated BSA. Inset is IC50 concentrations for CS‐4S and CS‐6S (n = 4).
- E
Flow cytometric analysis of N2a cells expressing full‐length mFIBCD1, mFIBCD1ΔFReD or empty vector control incubated with FITC‐tagged chondroitin‐4‐sulphate (CS‐4S), polysulphated chondroitin sulphate (CS‐PS) or dermatan sulphate (DS) (n = 3).
- F
Confocal images depicting internalisation of FITC‐tagged CS‐4S by FIBCD1‐overexpressing HEK293T lines compared with untransduced cells and unstained cells. Left, representative images; right, quantification. Data are plotted as total puncta per condition (n = 5). Cells are further stained with CellMask Orange (cellular membrane) and Hoechst (nuclei). Scale bar = 50 μm.
- G
Internalisation of FITC‐tagged CS‐4S by HEK293T‐FIBCD1 cells treated with inhibitors of endocytosis, Dynole 34–2 and PitStop 2 (+) vs. their respective negative control compounds with no inhibitory properties, Dynole 31–2 and PitStop 2 (−) (n = 6).
- H
Representative (of two independent experiments) images of HEK293T cells overexpressing mCherry‐FIBCD1 fusion protein (yellow) stained with Hoechst (nuclei, blue), lysosomal vesicles (LysoTracker, red) and FITC‐CS‐4S (green). White arrows indicate co‐localisation of CS‐4S, lysosomal vesicles and FIBCD1; blue arrow indicates co‐localisation of FIBCD1 and CS‐4S but not lysosomal vesicles. Scale bar = 15 μm. Inset, digital zoom of HEK293T images showing co‐localisation. Scale bar = 7.5 μm.
- I
Top, superposition ribbon diagrams of the WT FReD domain (dark blue) with R406C (left) and P456L (right) mutants (in grey). The loops surrounding the ligand binding site (389–399 and 423–448) exhibit the largest structural rearrangement in both mutants. Bottom, comparison of the electrostatic potential mapped onto the solvent‐accessible surface between WT and the two variant FReDs.
- J
Top, schematic depiction of FIBCD1 protein and location of patient variants (red) and W6* control (blue). Bottom, flow cytometric analysis of untransduced HEK293T cells (n = 3), or expressing constructs with full‐length wild‐type human FIBCD1 (n = 3), FIBCD1 with the W6* early stop variant as control (FIBCD1_W6*; n = 4), or the three patient variants (as labelled, n = 4) incubated with FITC‐tagged CS‐4S represented as percentage of CS‐4S‐FITC relative to unstained control.
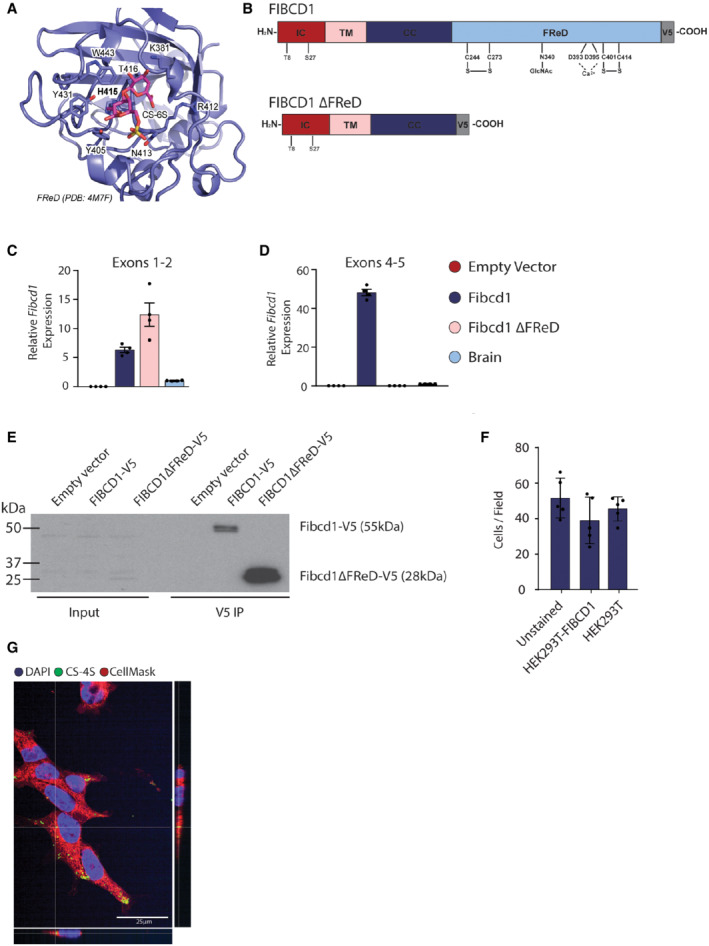
- A
Top binding pose for in silico docking of CS‐6S to FIBCD1 FReD (PDB 4M7F).
- B
Schematic representation of FIBCD1 domains, IC, intracellular domain (red); TM, transmembrane domain (pink); CC, coiled‐coil domain (dark blue); FReD (light blue); and location of V5‐tag (grey) in full‐length mFIBCD1 cDNA and truncated mFIBCD1 lacking the FReD (FIBCD1 ΔFReD).
- C, D
Relative mRNA expression levels of Fibcd1 in the N2a cells overexpressing full‐length (Fibcd1) or truncated FIBCD1 (Fibcd1 ΔFReD) and adult mouse WT brain for comparison, analysed by RT–qPCR (n = 4) using primers binding to exons 1 and 2 before the FReD domain (C) or to exons 4 and 5 spanning the sequence encoding part of the FReD (D). Note the complete absence of endogenous Fibcd1 expression in the “empty vector” (red bar) control and the complete absence of expression when using primers complementary to exon 4/5 (D), which span the FReD (see Fig EV1A) in the Fibcd1 ΔFReD construct (C, pink bar), validating the generated cell lines. Gapdh was used as housekeeping control, and values obtained from a control brain sample were set to 1.
- E
Validation of transgenic N2a cell line at the protein level by immunoprecipitation with anti‐V5 antibody as bait. Input (left) and V5‐immunoprecipitated (right) lysates from N2a cells expressing V5‐tagged full‐length mFIBCD1 (mFIBCD1‐V5, predicted size of 55 kDa), V5‐tagged mFIBCD1 lacking the FReD (V5‐FIBCD1 ΔFReD, predicted size of 28 kDa) or the empty vector as negative control. Protein marker sizes are indicated.
- F
Number of HEK293T cells per field during the CS‐4S internalisation experiments, linked to Fig 4F (n = 5).
- G
Representative immunofluorescent images of HEK293T‐FIBCD1 cells stained with FITC‐CS‐4S (green), CellMask (red) and Hoechst (blue); bottom and right panels are orthogonal views. Scale bar = 25 μm.
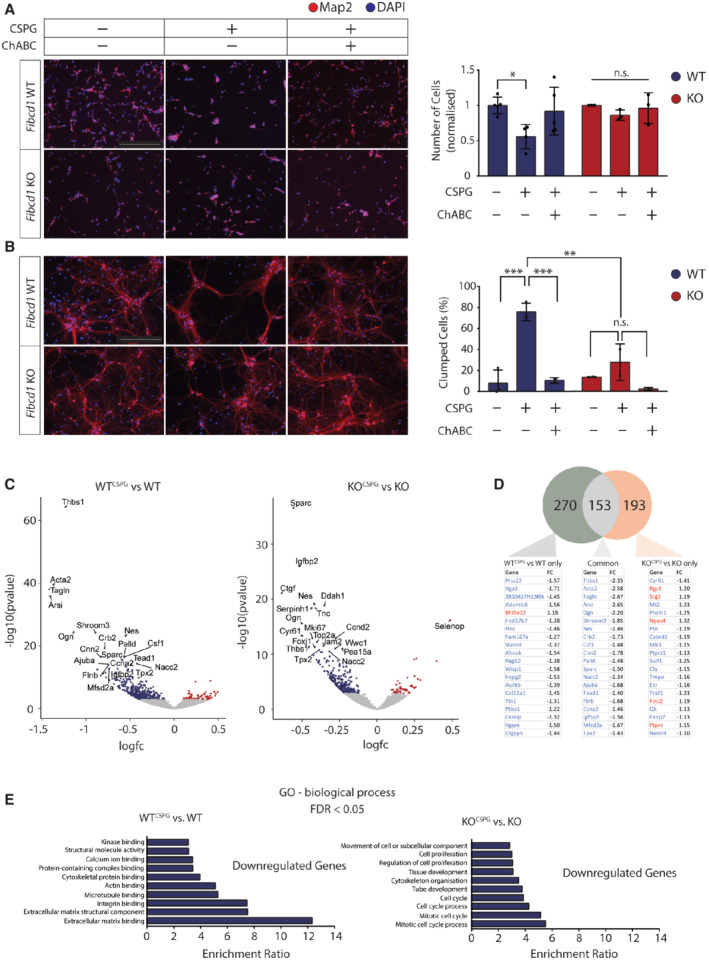
- A
Left, representative image of immunofluorescent staining (MAP2, red; DAPI, blue) of primary hippocampal cultures at 2 days in vitro (DIV), plated on +/− CSPG coating with and without prior digestion with ChABC, as indicated. Right, quantification of DIV2 images, showing the number of protruding cells per field normalised to untreated condition. n(Fibcd1 WT) = 4; n(Fibcd1 KO) = 3. Scale bar = 250 μm.
- B
Left, representative images of DIV14 neurons, same conditions as in (A). Right, quantification of DIV14 images, representing the percentage of cells per field that are clumped. n(Fibcd1 WT) = 3; n(Fibcd1 KO) = 2. Scale bar = 250 μm.
- C
Volcano plots of differential gene expression of transcriptomes at DIV3 hippocampal cultures comparing (left) WTCSPG vs. WT and KOCSPG vs. KO (FDR < 0.05; right). Significantly upregulated and downregulated genes are shown in red and blue, respectively. The top 20 DEGs are labelled.
- D
Above, Venn diagram of significant DEGs unique to WTCSPG vs. WT (green, 270 genes), KOCSPG vs. KO (orange, 193 genes) and common between the two (grey, 153 genes). Below, lists of the 20 most significant DEGs and their fold change for each comparison, showing downregulated DEGs in blue and upregulated in red. n(Fibcd1 WT) = 5; n(Fibcd1 KO) = 4. n represents a prep of cells.
- E
GO term enrichment analysis for significantly downregulated genes (FDR < 0.05) in (left) WTCSPG vs. WT and (right) KOCSPG vs. KO.
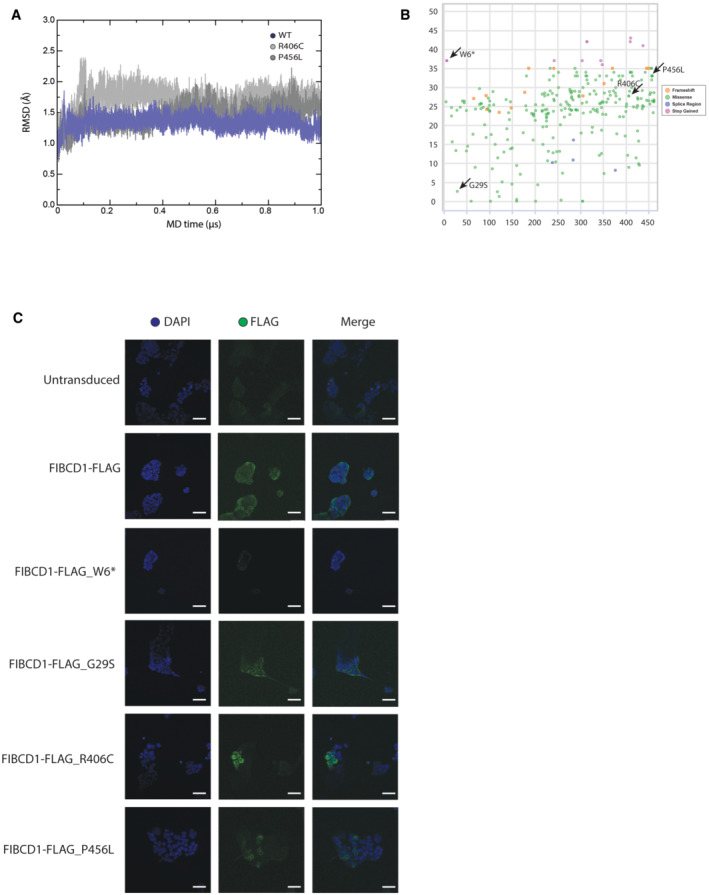
- A
Time course of the backbone root‐mean‐square deviation (RMSD) from the starting configuration for WT (blue), R406C (pink) and P456L (red) MD simulations.
- B
Missense, frameshift, splice region and stop gain variants extrapolated from the gnomAD database present in the population, colour code is indicated in the figure. Each dot represents one distinct variant, amino acid position and CADD score indicated on x‐ and y‐axis. Denoted with arrows are the variants discussed in the present study.
- C
Validation of FLAG‐FIBCD1 expression in stably expressing HEK293T cells by immunofluorescence. Note the absence of signal in untransduced cells and cells expressing truncated (W6*) FIBCD1. Shown are DAPI (blue), anti‐FLAG (green) and merge. Scale bar = 50 μm. Representative of two independent experiments.
References
-
- Abraham MJ, Murtola T, Schulz R, Páll S, Smith JC, Hess B, Lindahl E (2015) GROMACS: high performance molecular simulations through multi‐level parallelism from laptops to supercomputers. SoftwareX 1–2: 19–25
-
- Begay RL, Graw SL, Sinagra G, Asimaki A, Rowland TJ, Slavov DB, Gowan K, Jones KL, Brun F, Merlo M et al (2018) Filamin C truncation mutations are associated with arrhythmogenic dilated cardiomyopathy and changes in the cell–cell adhesion structures. JACC Clin Electrophysiol 4: 504–514 - PMC - PubMed
-
- Bhattacharya S, Amarsaikhan N, Maupin AJ, Schlosser A, Fuchtbauer EM, Holmskov U, Moeller JB, Templeton SP (2021) FIBCD1 deficiency decreases disease severity in a murine model of invasive pulmonary aspergillosis. Immunohorizons 5: 983–993 - PubMed
-
- Bukalo O, Schachner M, Dityatev A (2001) Modification of extracellular matrix by enzymatic removal of chondroitin sulfate and by lack of tenascin‐R differentially affects several forms of synaptic plasticity in the hippocampus. Neuroscience 104: 359–369 - PubMed
Publication types
MeSH terms
Substances
Associated data
- Actions
- Actions
Grants and funding
LinkOut - more resources
Full Text Sources
Molecular Biology Databases
Research Materials
