

Reduced-field of view three-dimensional MR acoustic radiation force imaging with a low-rank reconstruction for targeting transcranial focused ultrasound
- PMID: 35916311
- PMCID: PMC9529839
- DOI: 10.1002/mrm.29403
Reduced-field of view three-dimensional MR acoustic radiation force imaging with a low-rank reconstruction for targeting transcranial focused ultrasound
Abstract
Purpose: To rapidly image and localize the focus in MR-guided focused ultrasound (FUS) while maintaining a low ultrasound duty cycle to minimize tissue effects.
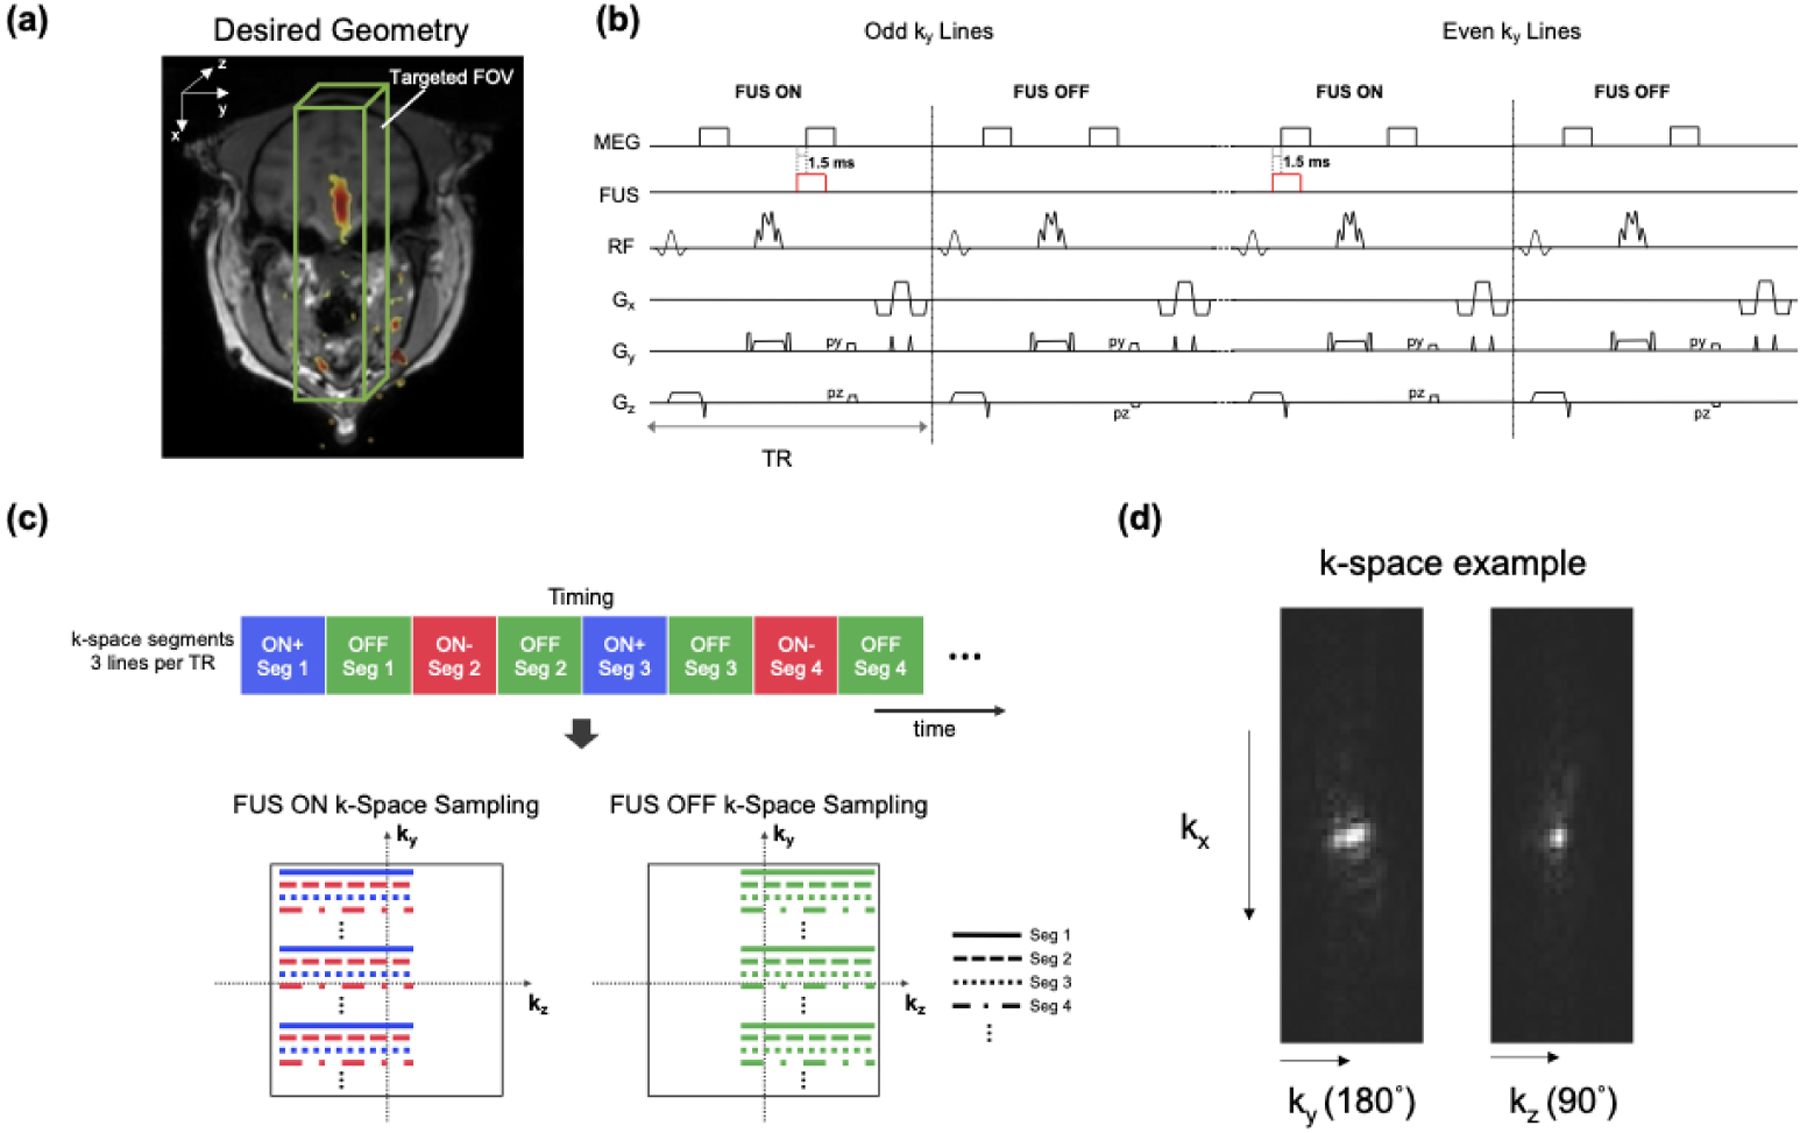
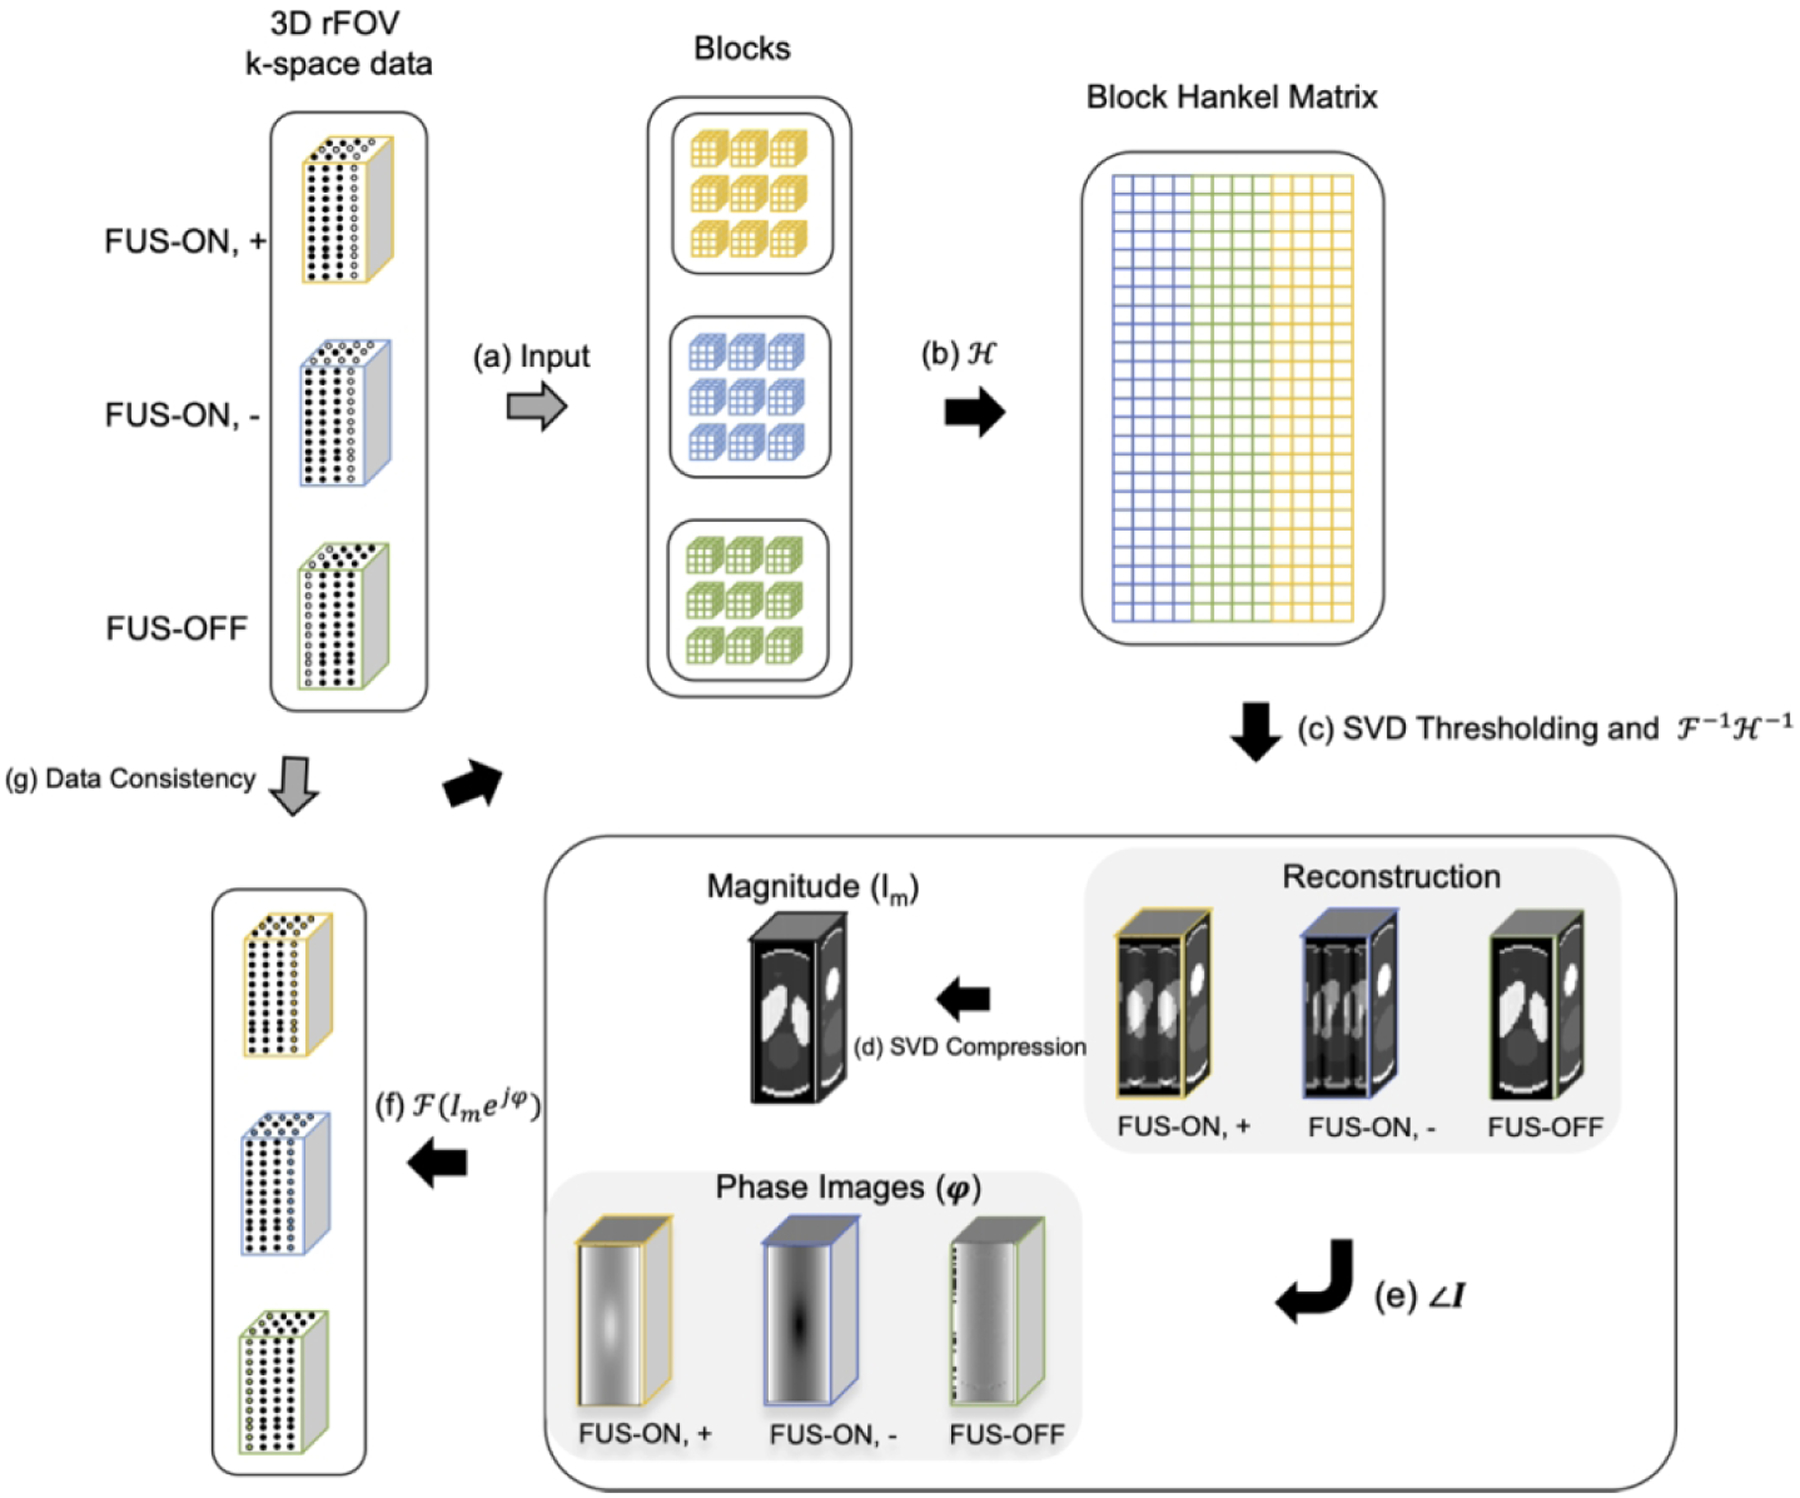
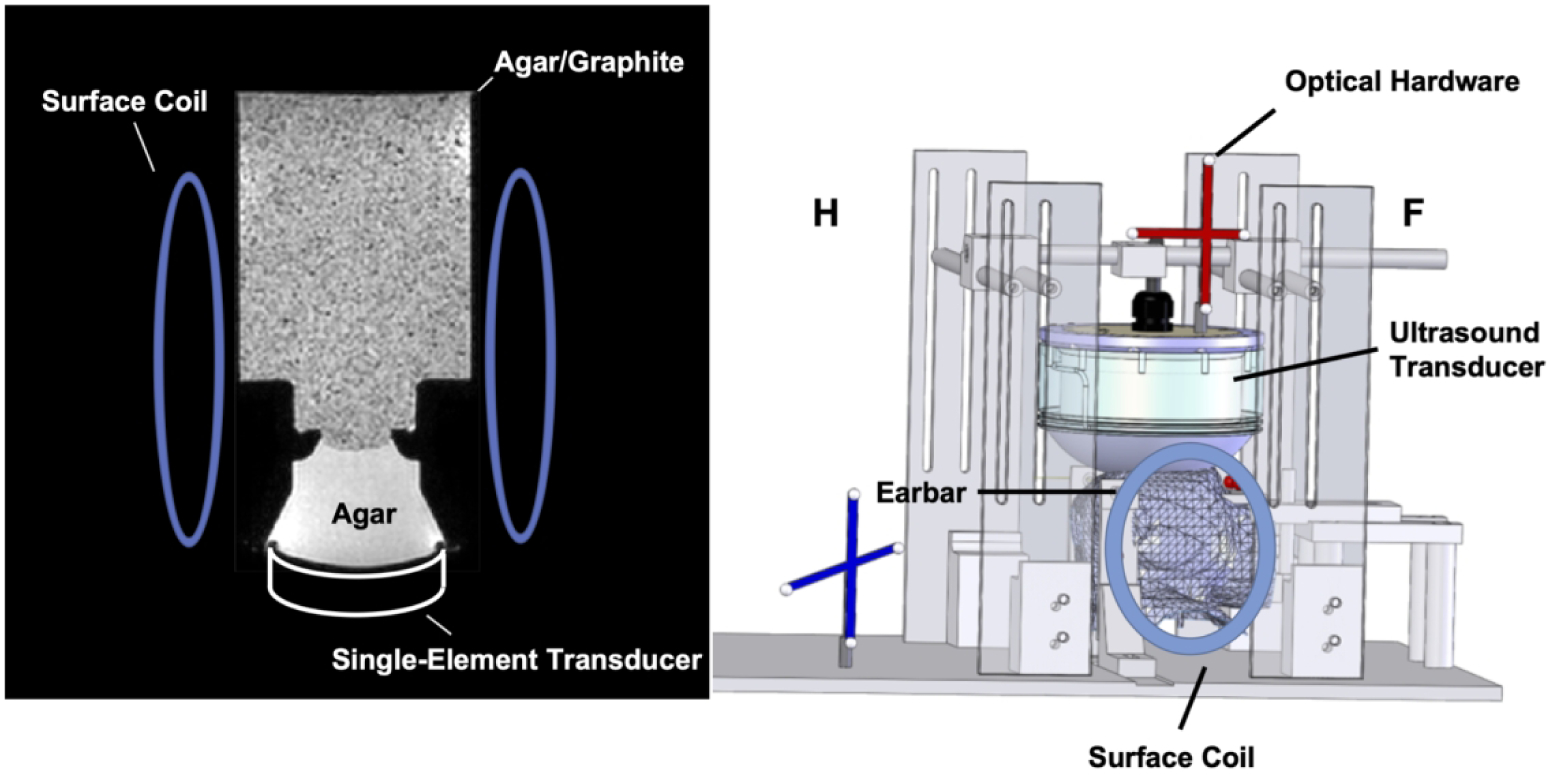
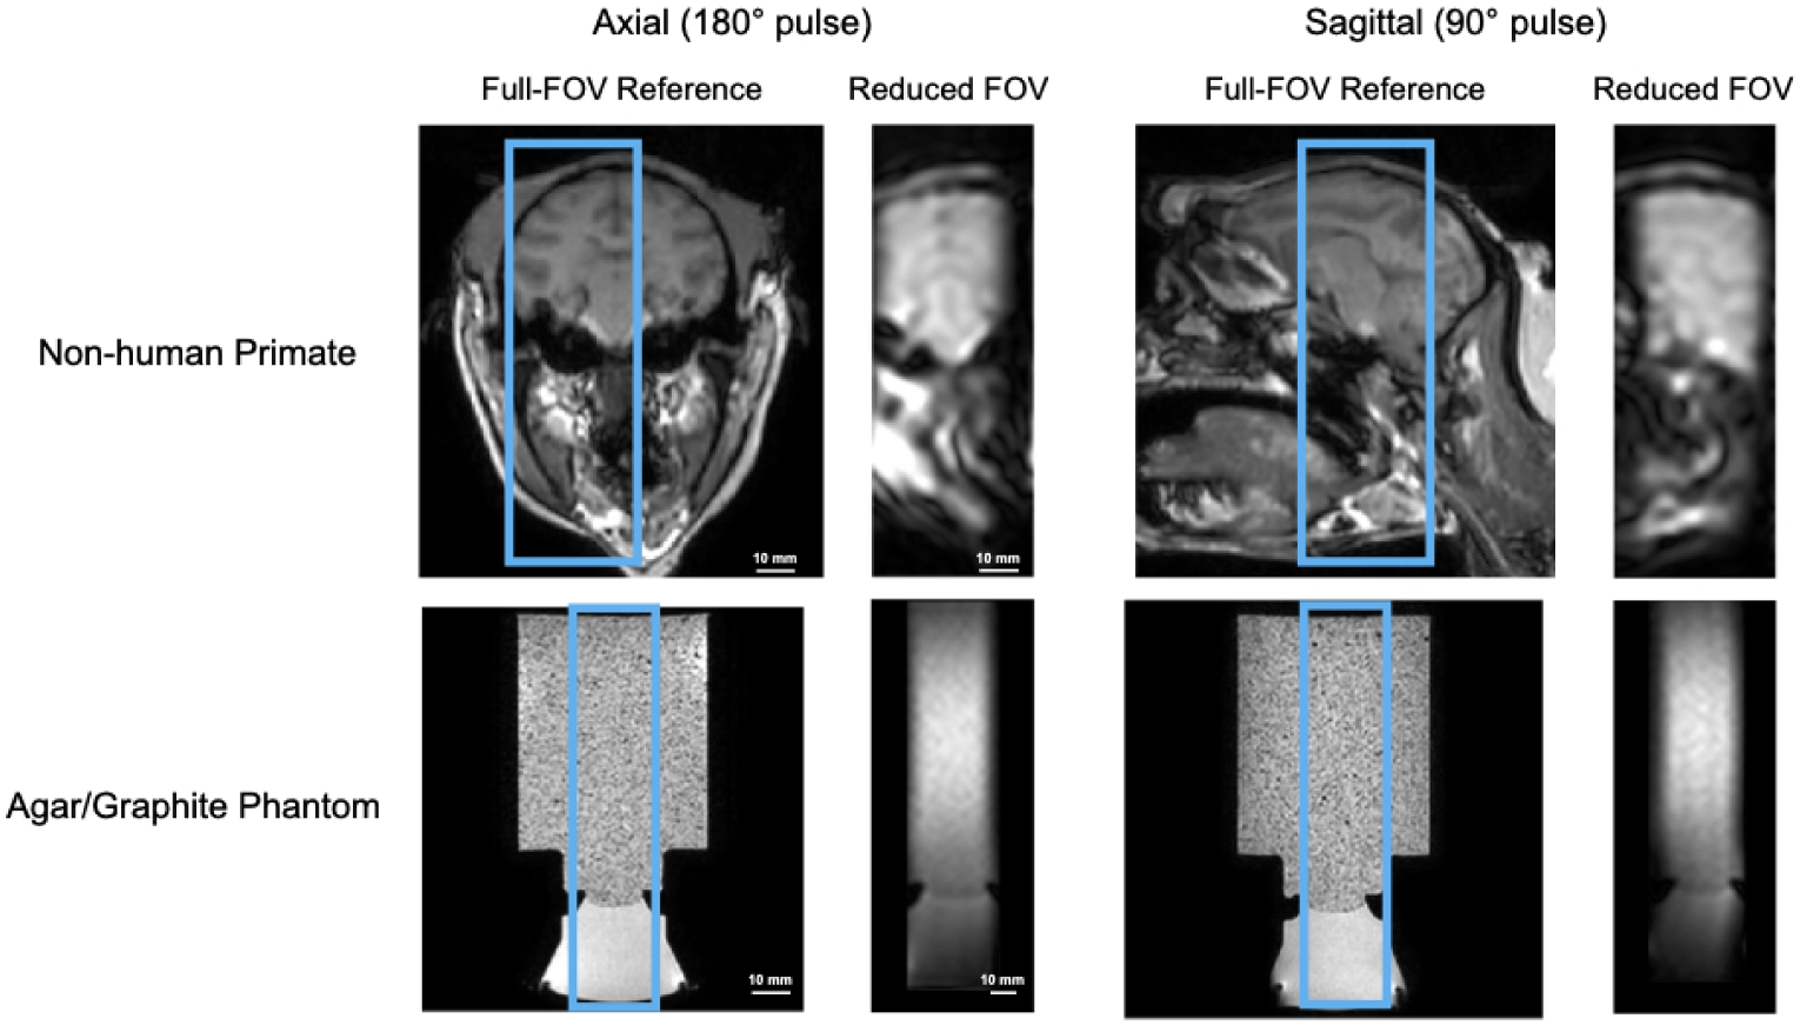
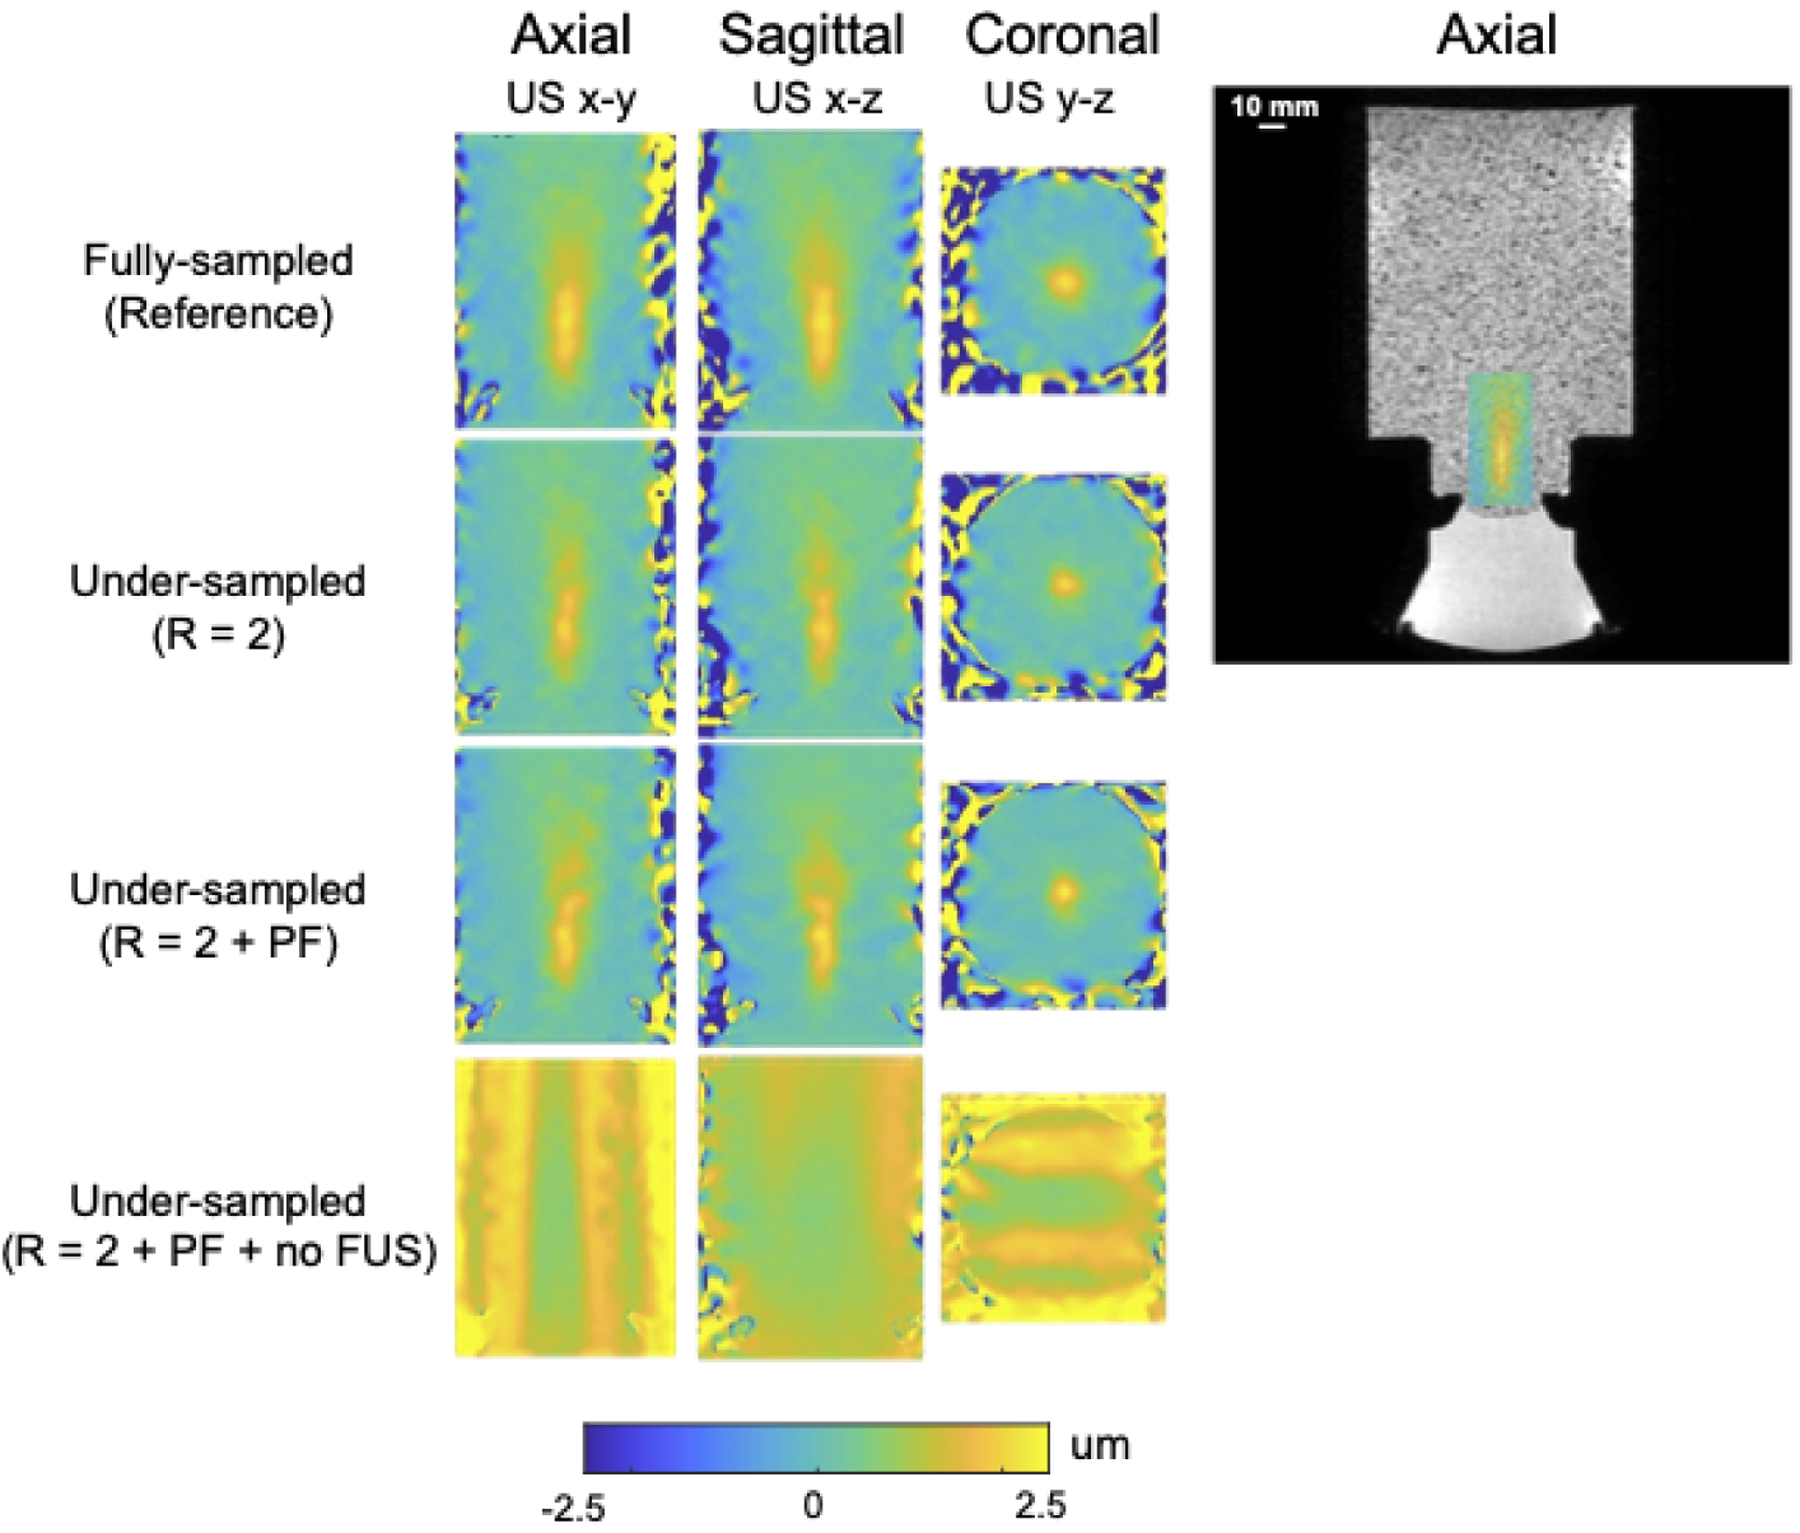
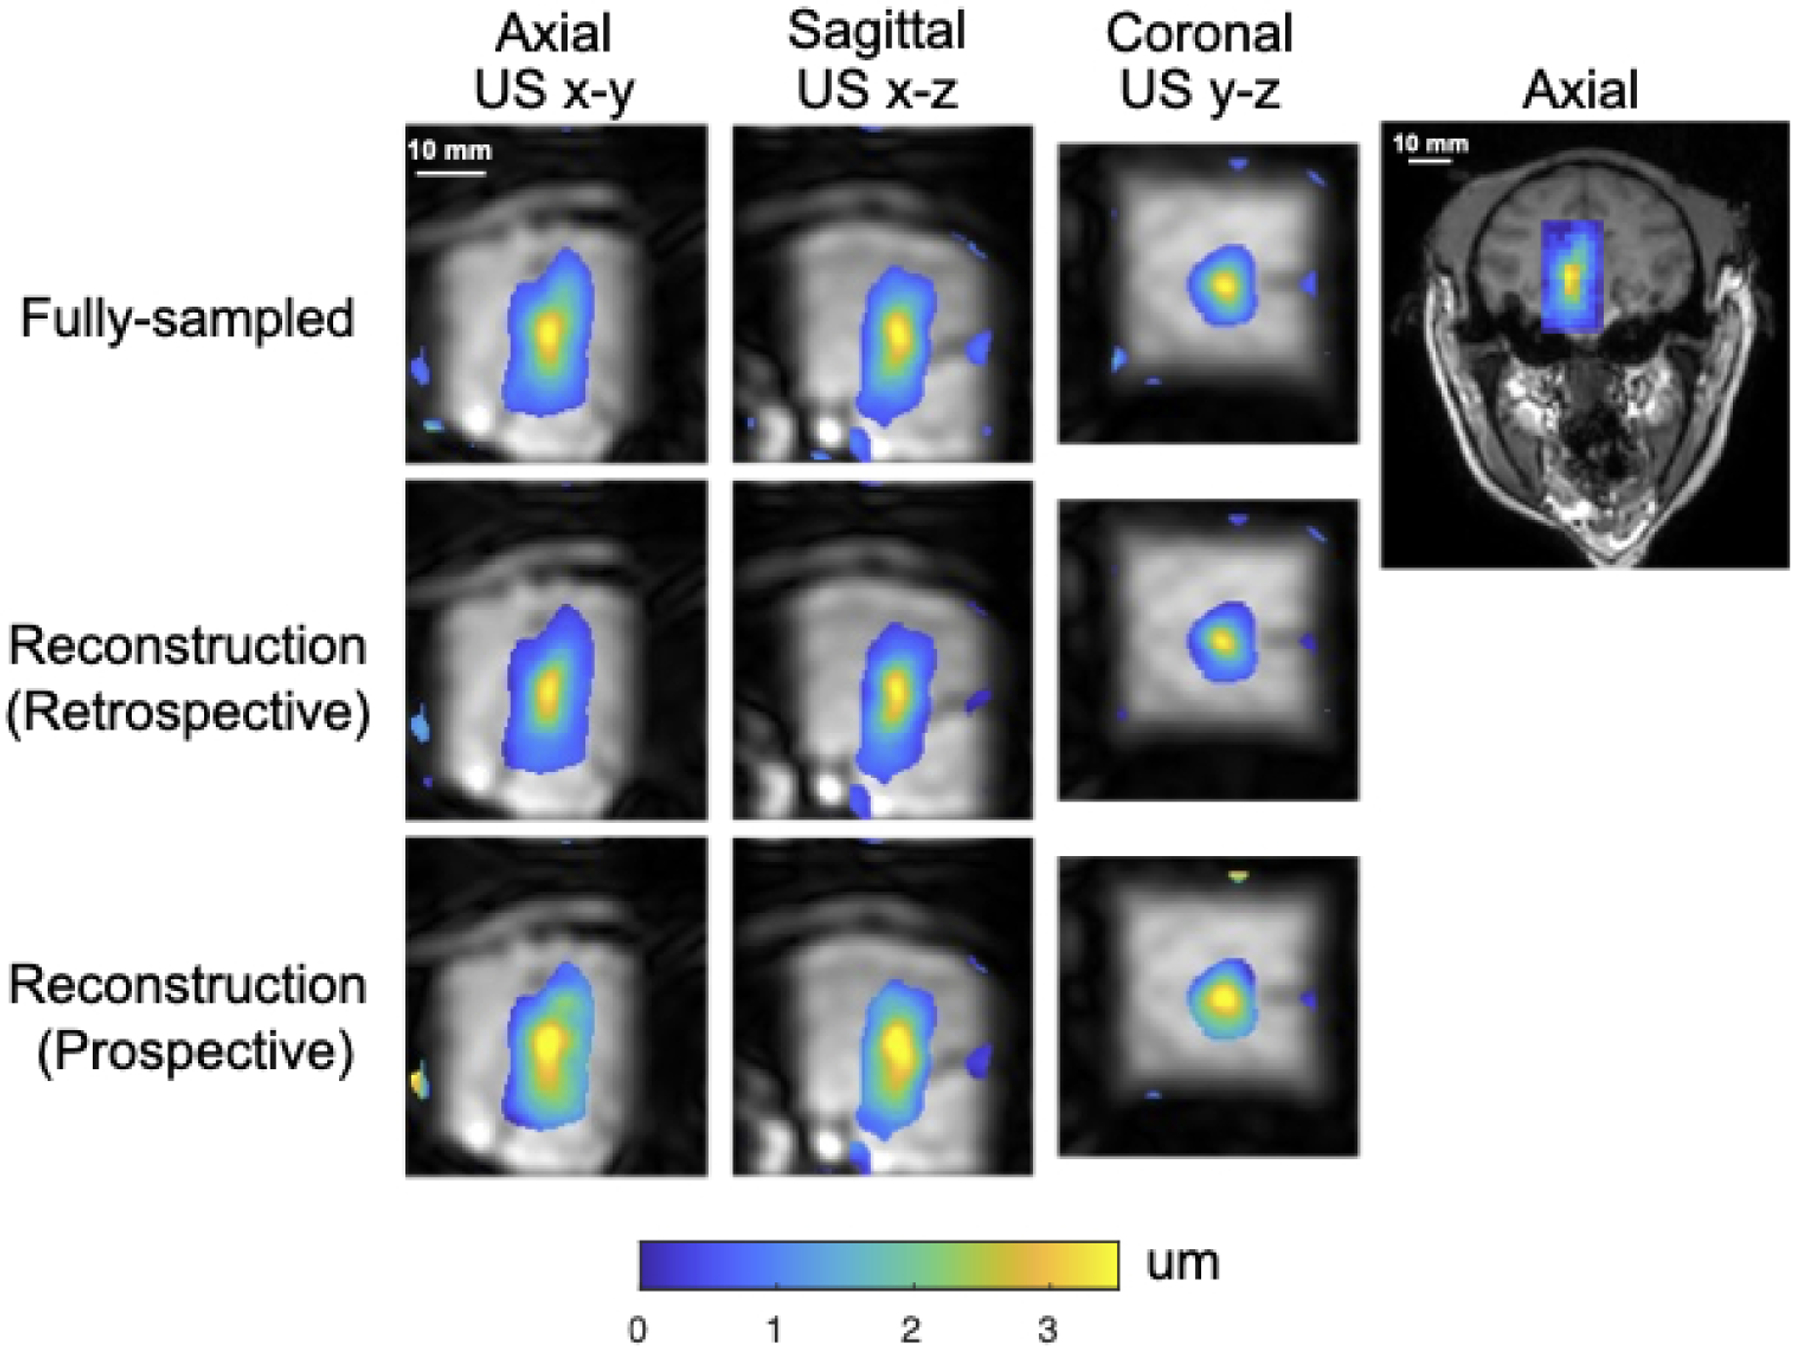
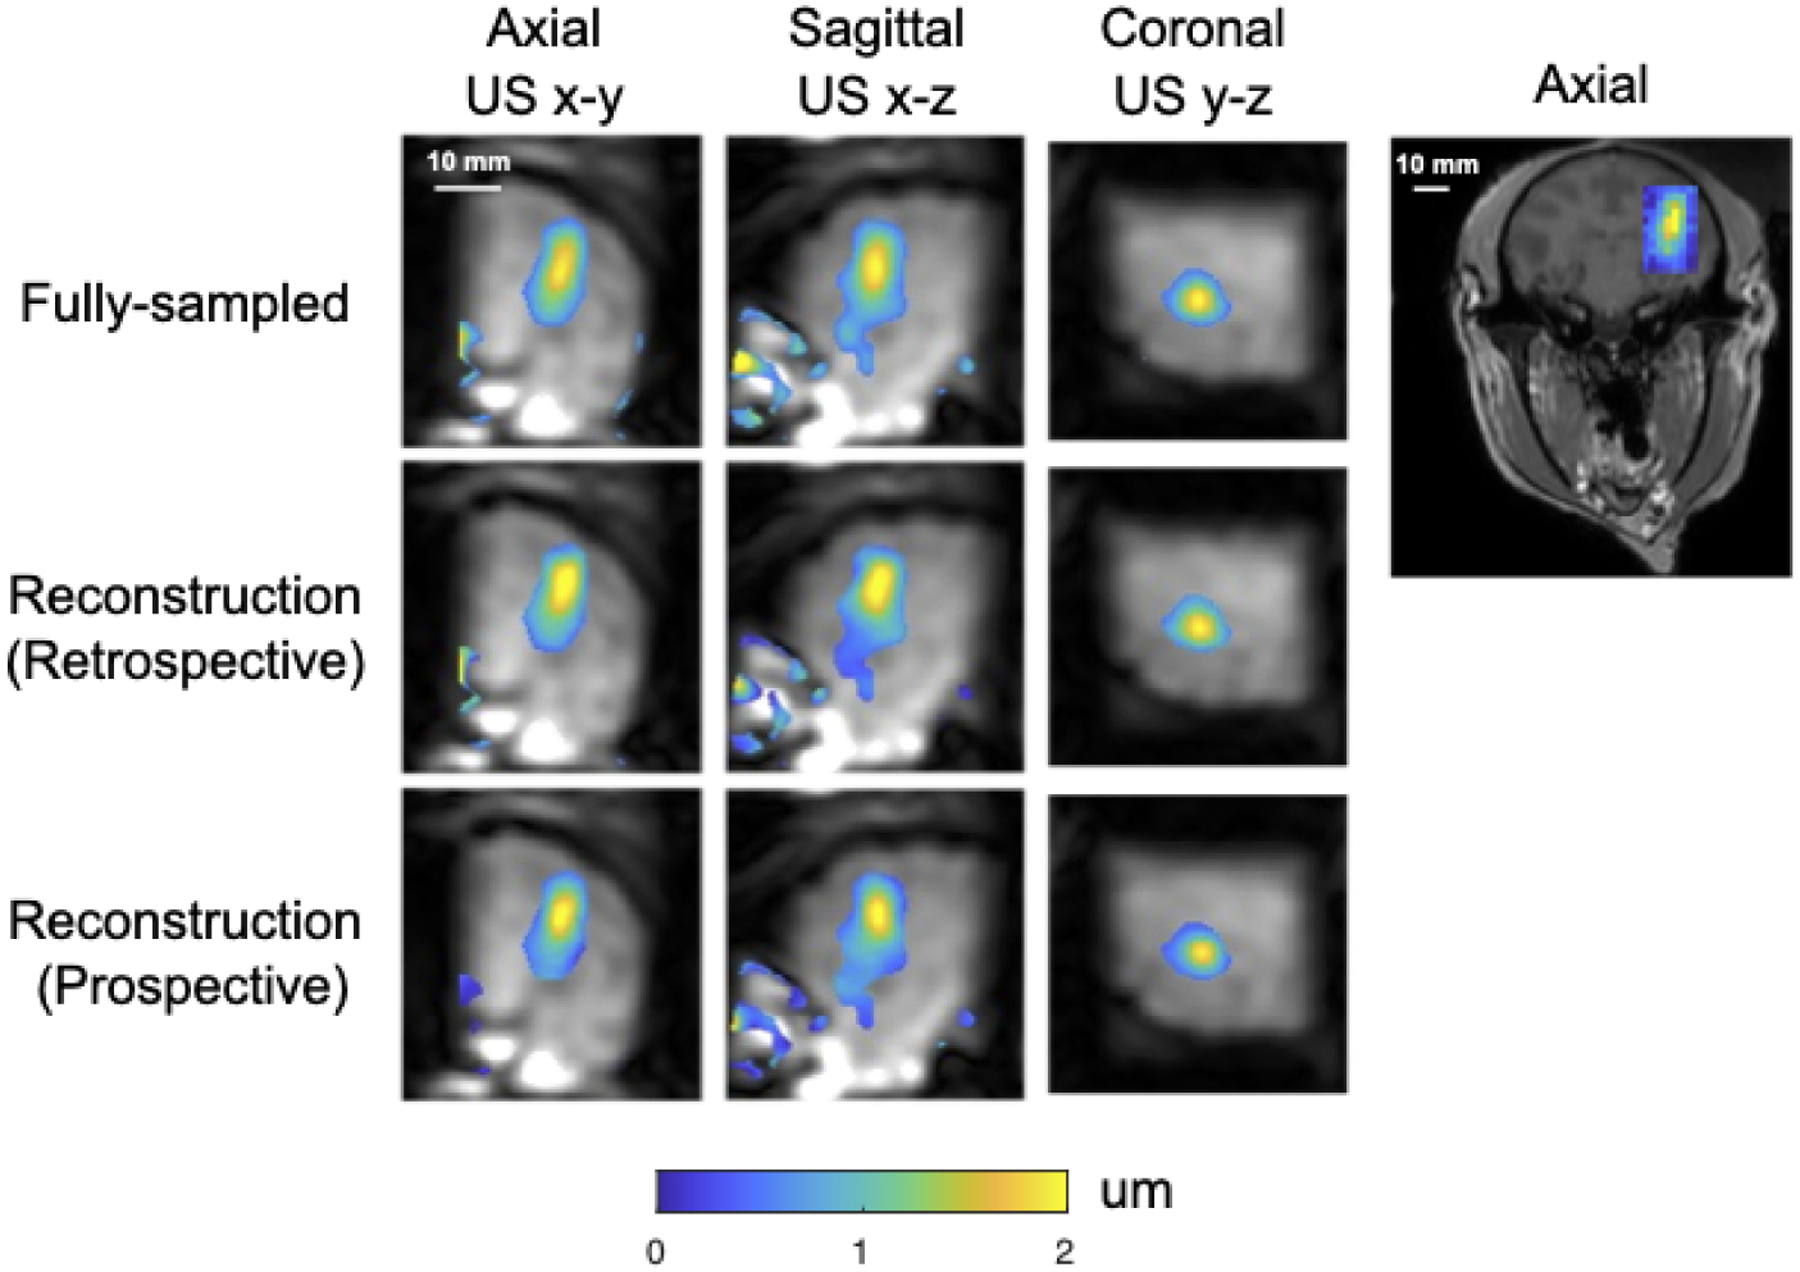
Methods: MR-acoustic radiation force imaging (ARFI) is key to targeting FUS procedures such as neuromodulation, and works by encoding ultrasound-induced displacements into the phase of MR images. However, it can require long scan times to cover a volume of tissue, especially when minimizing the FUS dose during targeting is paramount. To simultaneously minimize scan time and the FUS duty cycle, a 2-min three-dimensional (3D) reduced-FOV spin echo ARFI scan with two-dimensional undersampling was implemented at 3T with a FUS duty cycle of 0.85%. The 3D k-space sampling scheme incorporated uniform undersampling in one phase-encoded axis and partial Fourier (PF) sampling in the other. The scan interleaved FUS-on and FUS-off data collection to improve displacement map quality via a joint low-rank image reconstruction. Experiments in agarose and graphite phantoms and living macaque brains for neuromodulation and blood-brain barrier opening studied the effects of the sampling and reconstruction strategy on the acquisition, and evaluated its repeatability and accuracy.
Results: In the phantom, the distances between displacement centroids of 10 prospective reconstructions and a fully sampled reference were below 1 mm. In in vivo brain, the distances between centroids ranged from 1.3 to 2.1 mm. Results in phantom and in vivo brain both showed that the proposed method can recover the FUS focus compared to slower fully sampled scans.
Conclusion: The proposed 3D MR-ARFI reduced-FOV method enables rapid imaging of the FUS focus while maintaining a low FUS duty cycle.
Keywords: 3D; MR-ARFI; MRI; focused-ultrasound; low-rank; reduced-FOV.
© 2022 International Society for Magnetic Resonance in Medicine.
Figures
Similar articles
-
Ultrasound focusing using magnetic resonance acoustic radiation force imaging: application to ultrasound transcranial therapy.Med Phys. 2010 Jun;37(6):2934-42. doi: 10.1118/1.3395553. Med Phys. 2010. PMID: 20632605
-
Multiple-point magnetic resonance acoustic radiation force imaging.Magn Reson Med. 2019 Feb;81(2):1104-1117. doi: 10.1002/mrm.27477. Epub 2018 Sep 26. Magn Reson Med. 2019. PMID: 30257059 Free PMC article.
-
Considerations for ultrasound exposure during transcranial MR acoustic radiation force imaging.Sci Rep. 2019 Nov 7;9(1):16235. doi: 10.1038/s41598-019-52443-8. Sci Rep. 2019. PMID: 31700021 Free PMC article.
-
MR imaging-controlled focused ultrasound ablation: a noninvasive image-guided surgery.Magn Reson Imaging Clin N Am. 2005 Aug;13(3):545-60. doi: 10.1016/j.mric.2005.04.008. Magn Reson Imaging Clin N Am. 2005. PMID: 16084419 Review.
-
Safety of Clinical Ultrasound Neuromodulation.Brain Sci. 2022 Sep 22;12(10):1277. doi: 10.3390/brainsci12101277. Brain Sci. 2022. PMID: 36291211 Free PMC article. Review.
Cited by
-
Design and Validation of a Patient-Specific Stereotactic Frame for Transcranial Ultrasound Therapy.IEEE Trans Ultrason Ferroelectr Freq Control. 2024 Aug;71(8):1030-1041. doi: 10.1109/TUFFC.2024.3420242. Epub 2024 Aug 19. IEEE Trans Ultrason Ferroelectr Freq Control. 2024. PMID: 39024077 Free PMC article.
-
Magnetic Resonance Acoustic Radiation Force Imaging (MR-ARFI).J Magn Reson Imaging. 2025 Jul;62(1):20-39. doi: 10.1002/jmri.29712. Epub 2025 Jan 22. J Magn Reson Imaging. 2025. PMID: 39842847 Free PMC article. Review.
References
-
- Lozinski T, Filipowska J, Pyka M, Baczkowska M, Ciebiera M. Magnetic resonance-guided high-intensity ultrasound (MR-HIFU) in the treatment of symptomatic uterine fibroidsFive-year experience. Ginekologia polska 2022; 93:185–194. - PubMed
-
- Catane R, Beck A, Inbar Y, Rabin T, Shabshin N, Hengst S, Pfeffer R, Hanannel A, Dogadkin O, Liberman B et al. MR-guided focused ultrasound surgery (MRgFUS) for the palliation of pain in patients with bone metastasespreliminary clinical experience. Annals of Oncology 2007; 18:163–167. - PubMed
-
- Elias WJ, Huss D, Voss T, Loomba J, Khaled M, Zadicario E, Frysinger RC, Sperling SA, Wylie S, Monteith SJ et al. A pilot study of focused ultrasound thalamotomy for essential tremor. New England Journal of Medicine 2013; 369:640–648. - PubMed
-
- Stavarache MA, Chazen JL, Kaplitt MG. Innovative Applications of MR-Guided Focused Ultrasound for Neurological Disorders. World Neurosurgery 2021; 145:581–589. - PubMed
Publication types
MeSH terms
Substances
Grants and funding
LinkOut - more resources
Full Text Sources
