. 2022 Dec;70(12):2330-2347.
doi: 10.1002/glia.24254. Epub 2022 Aug 2.

Extracellular S100B inhibits A-type voltage-gated potassium currents and increases L-type voltage-gated calcium channel activity in dopaminergic neurons

Affiliations

Extracellular S100B inhibits A-type voltage-gated potassium currents and increases L-type voltage-gated calcium channel activity in dopaminergic neurons

Eric A Bancroft et al. Glia. 2022 Dec.

Abstract

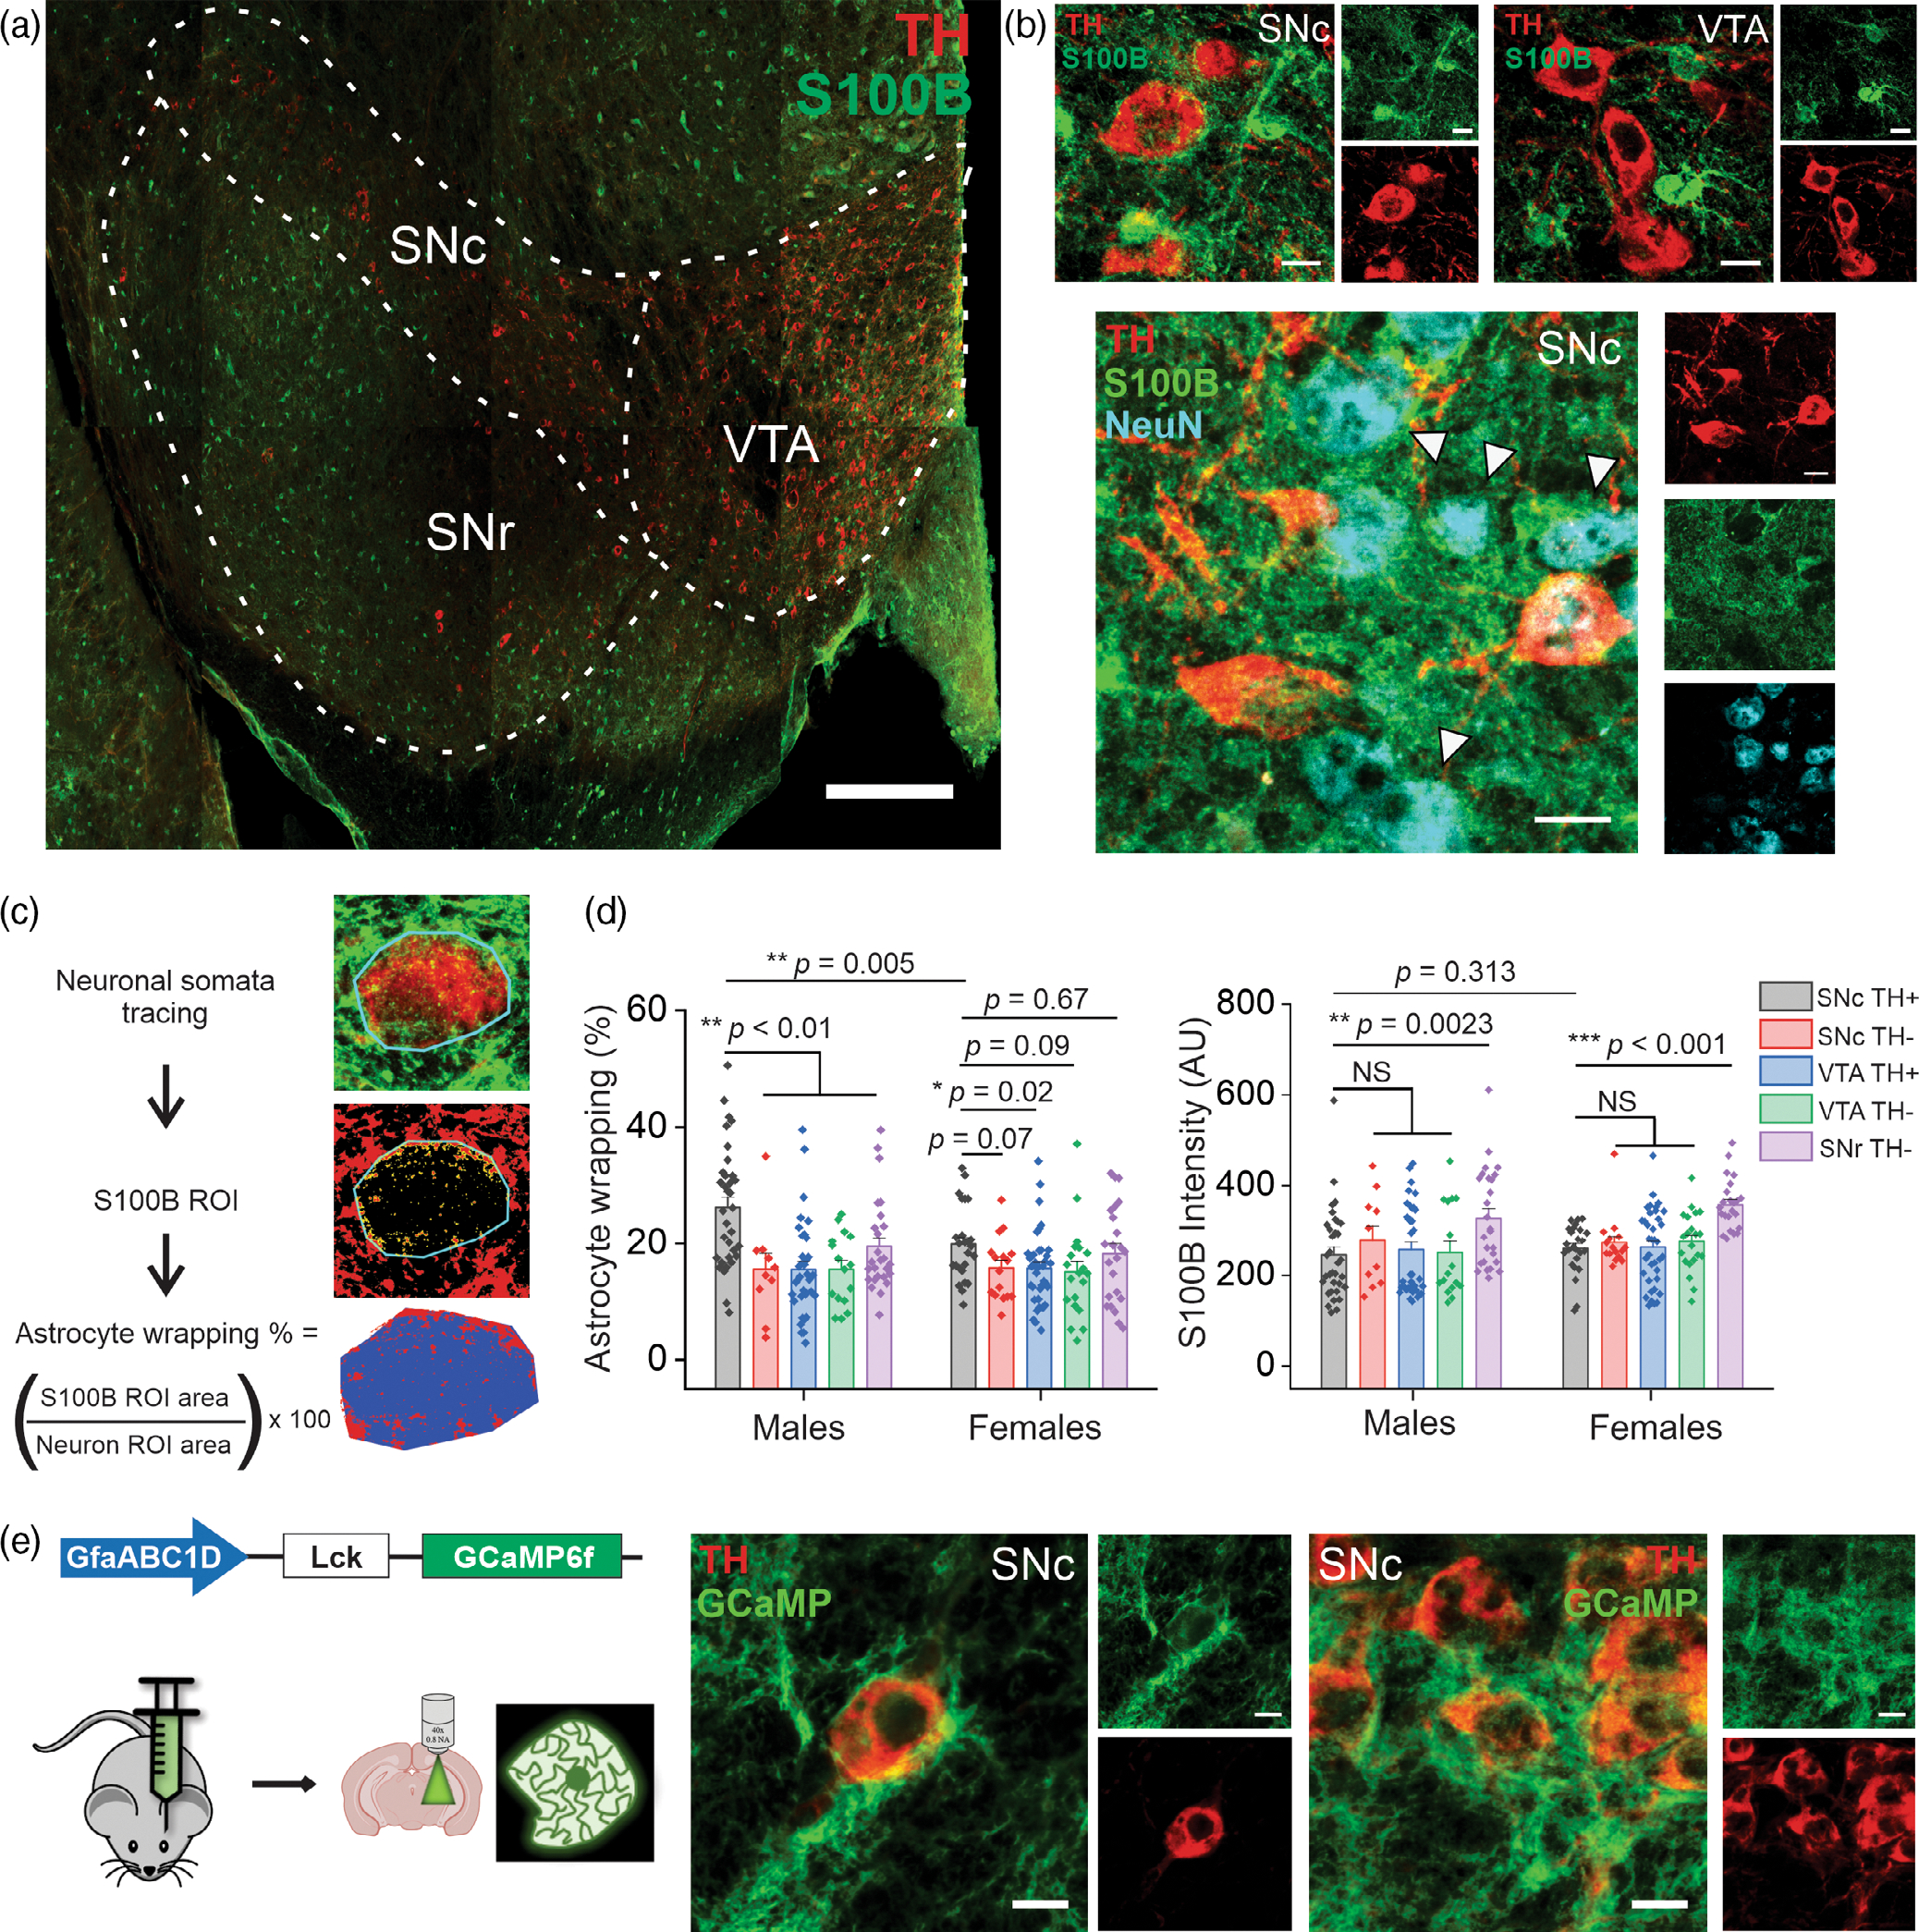
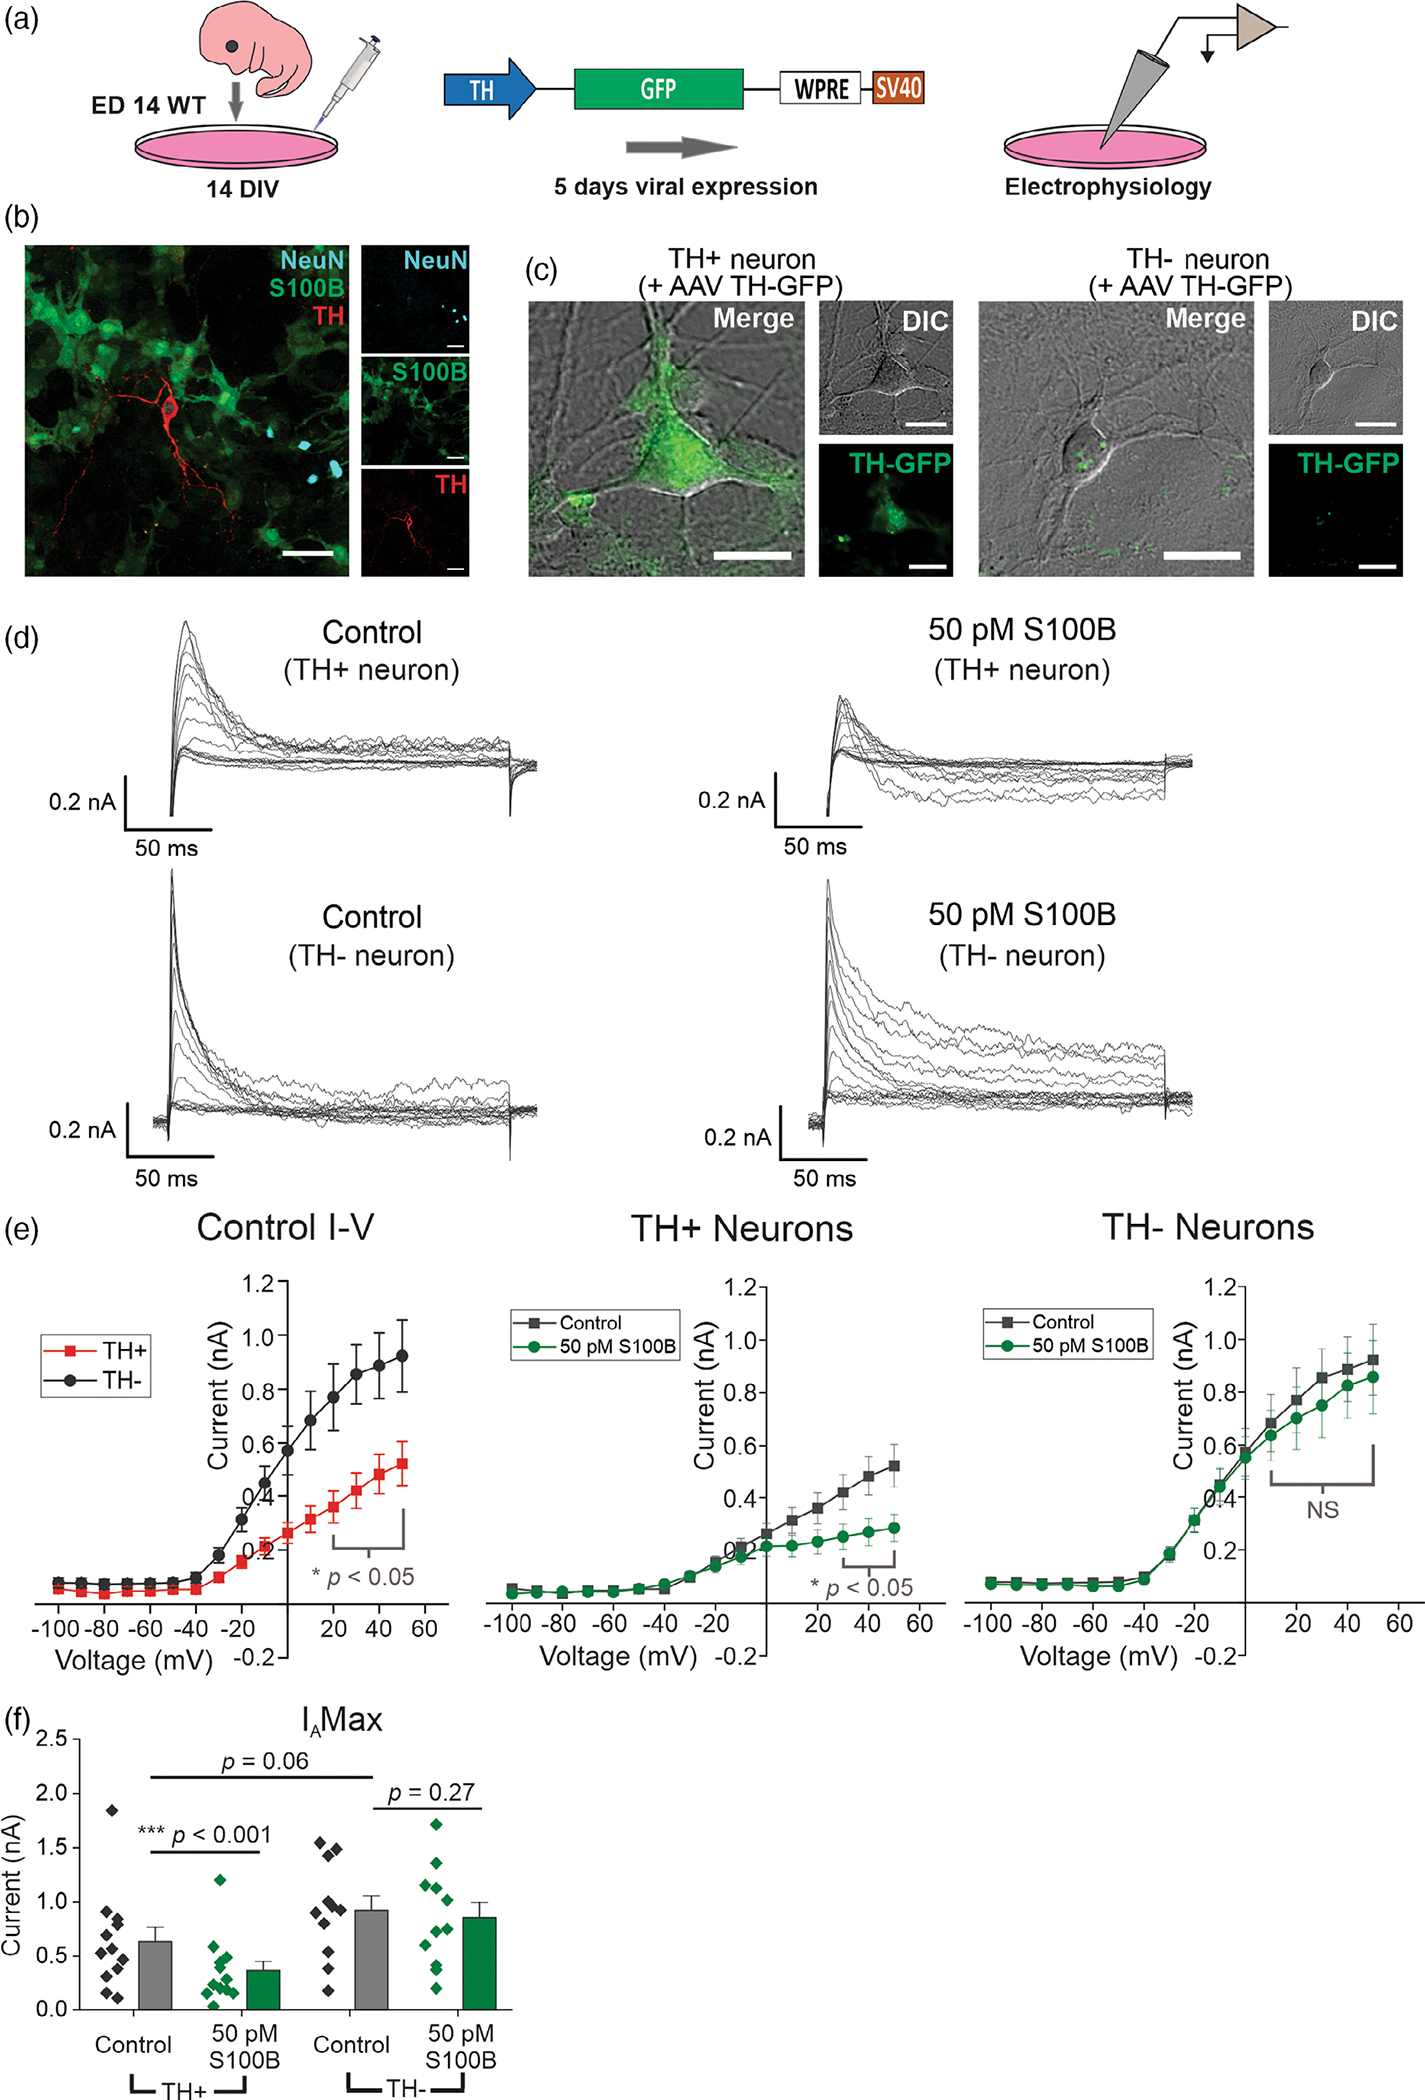
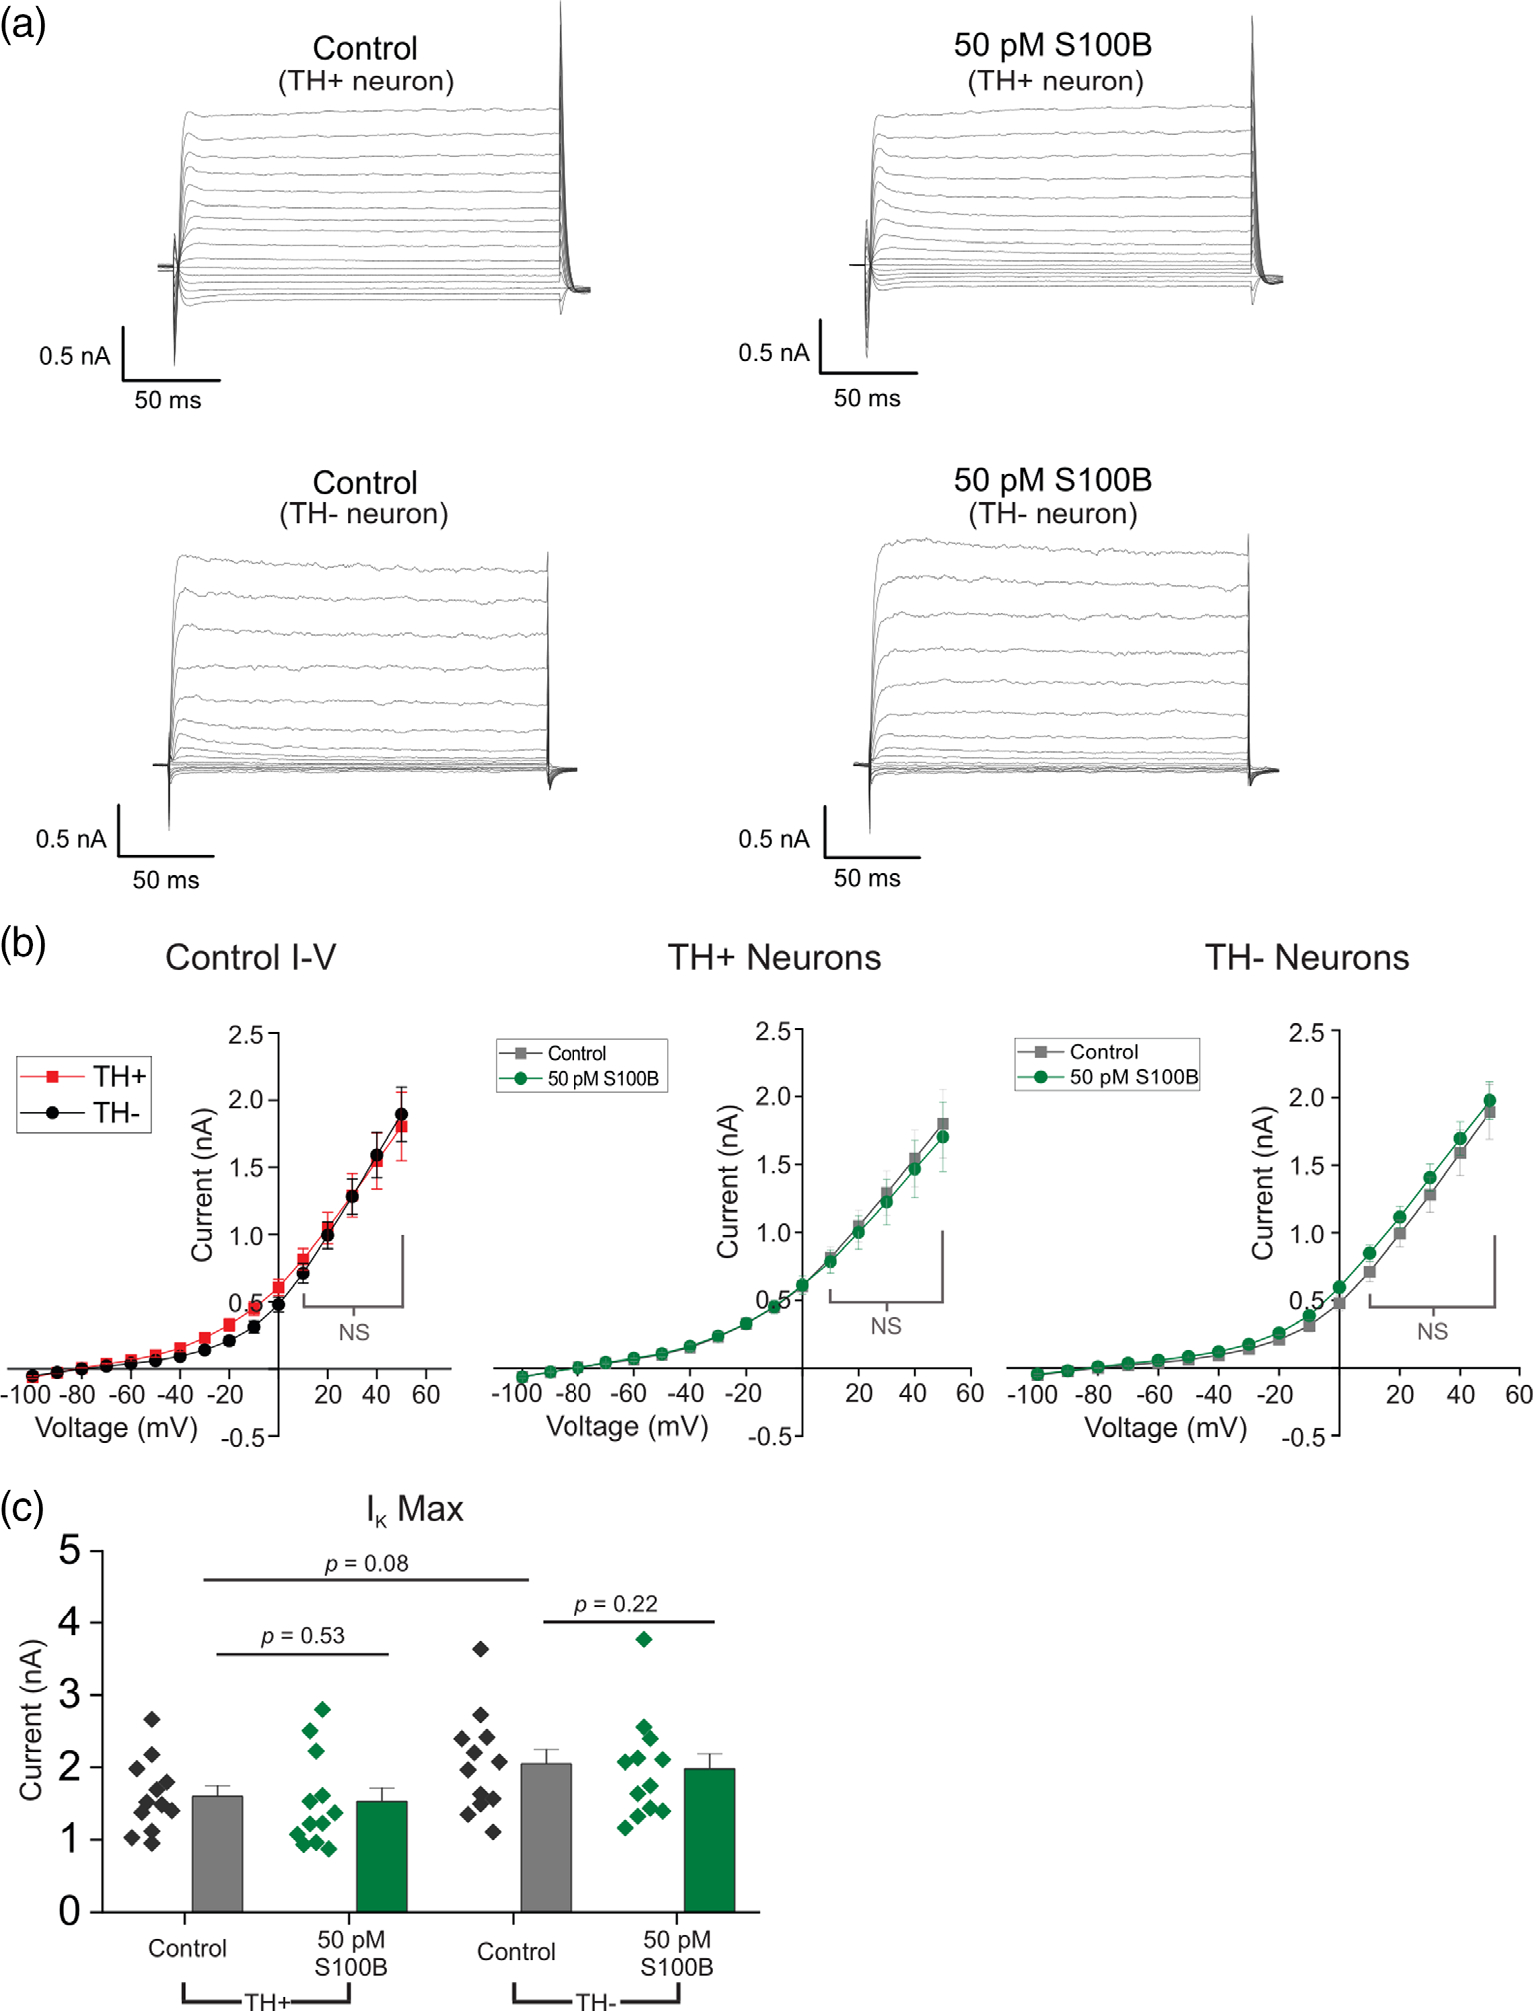
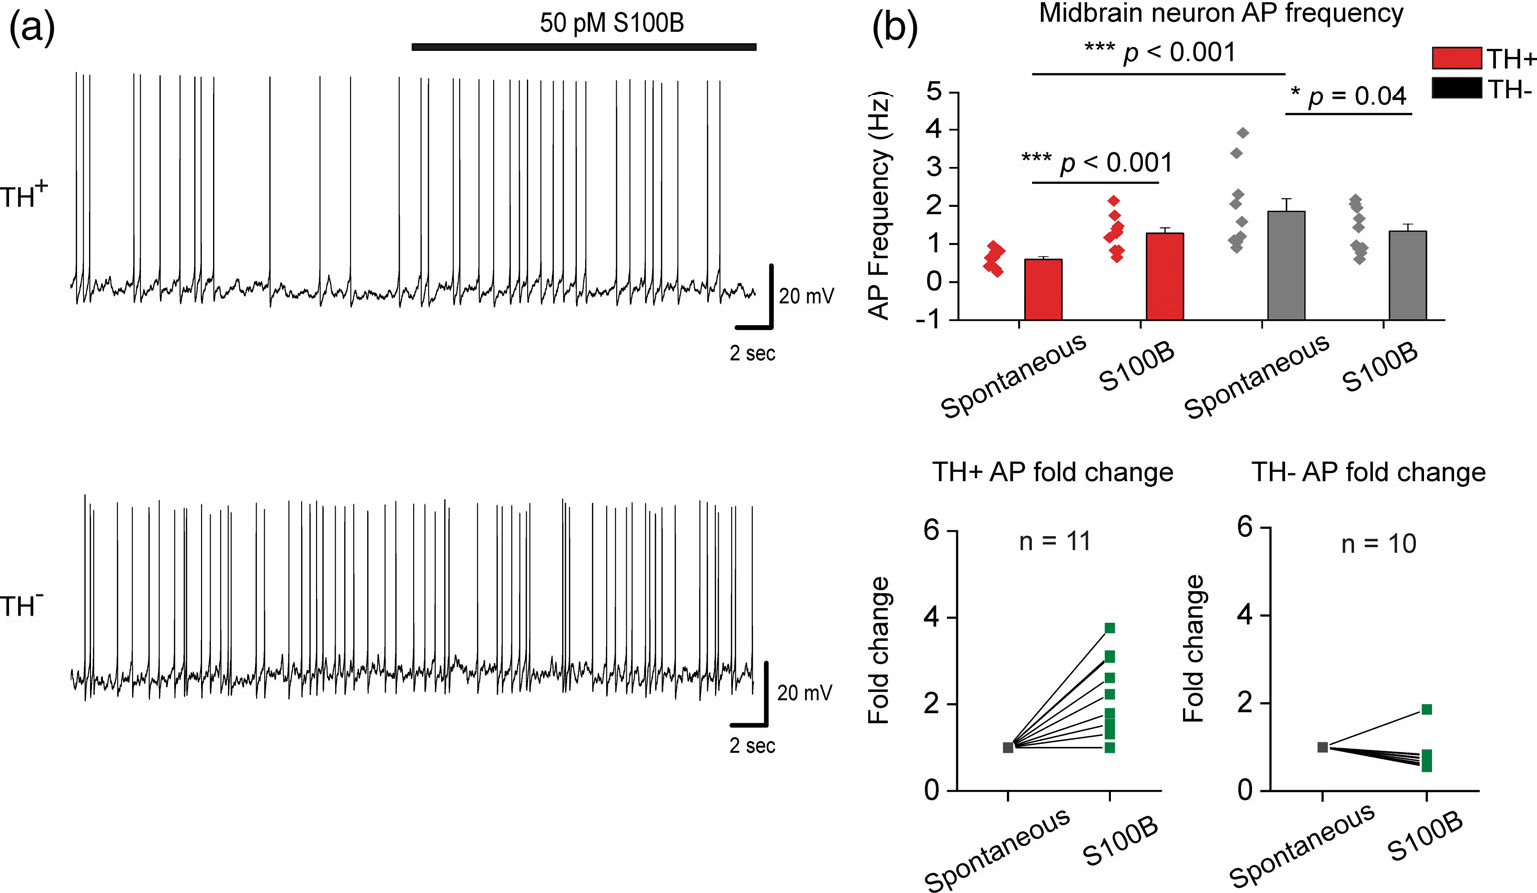
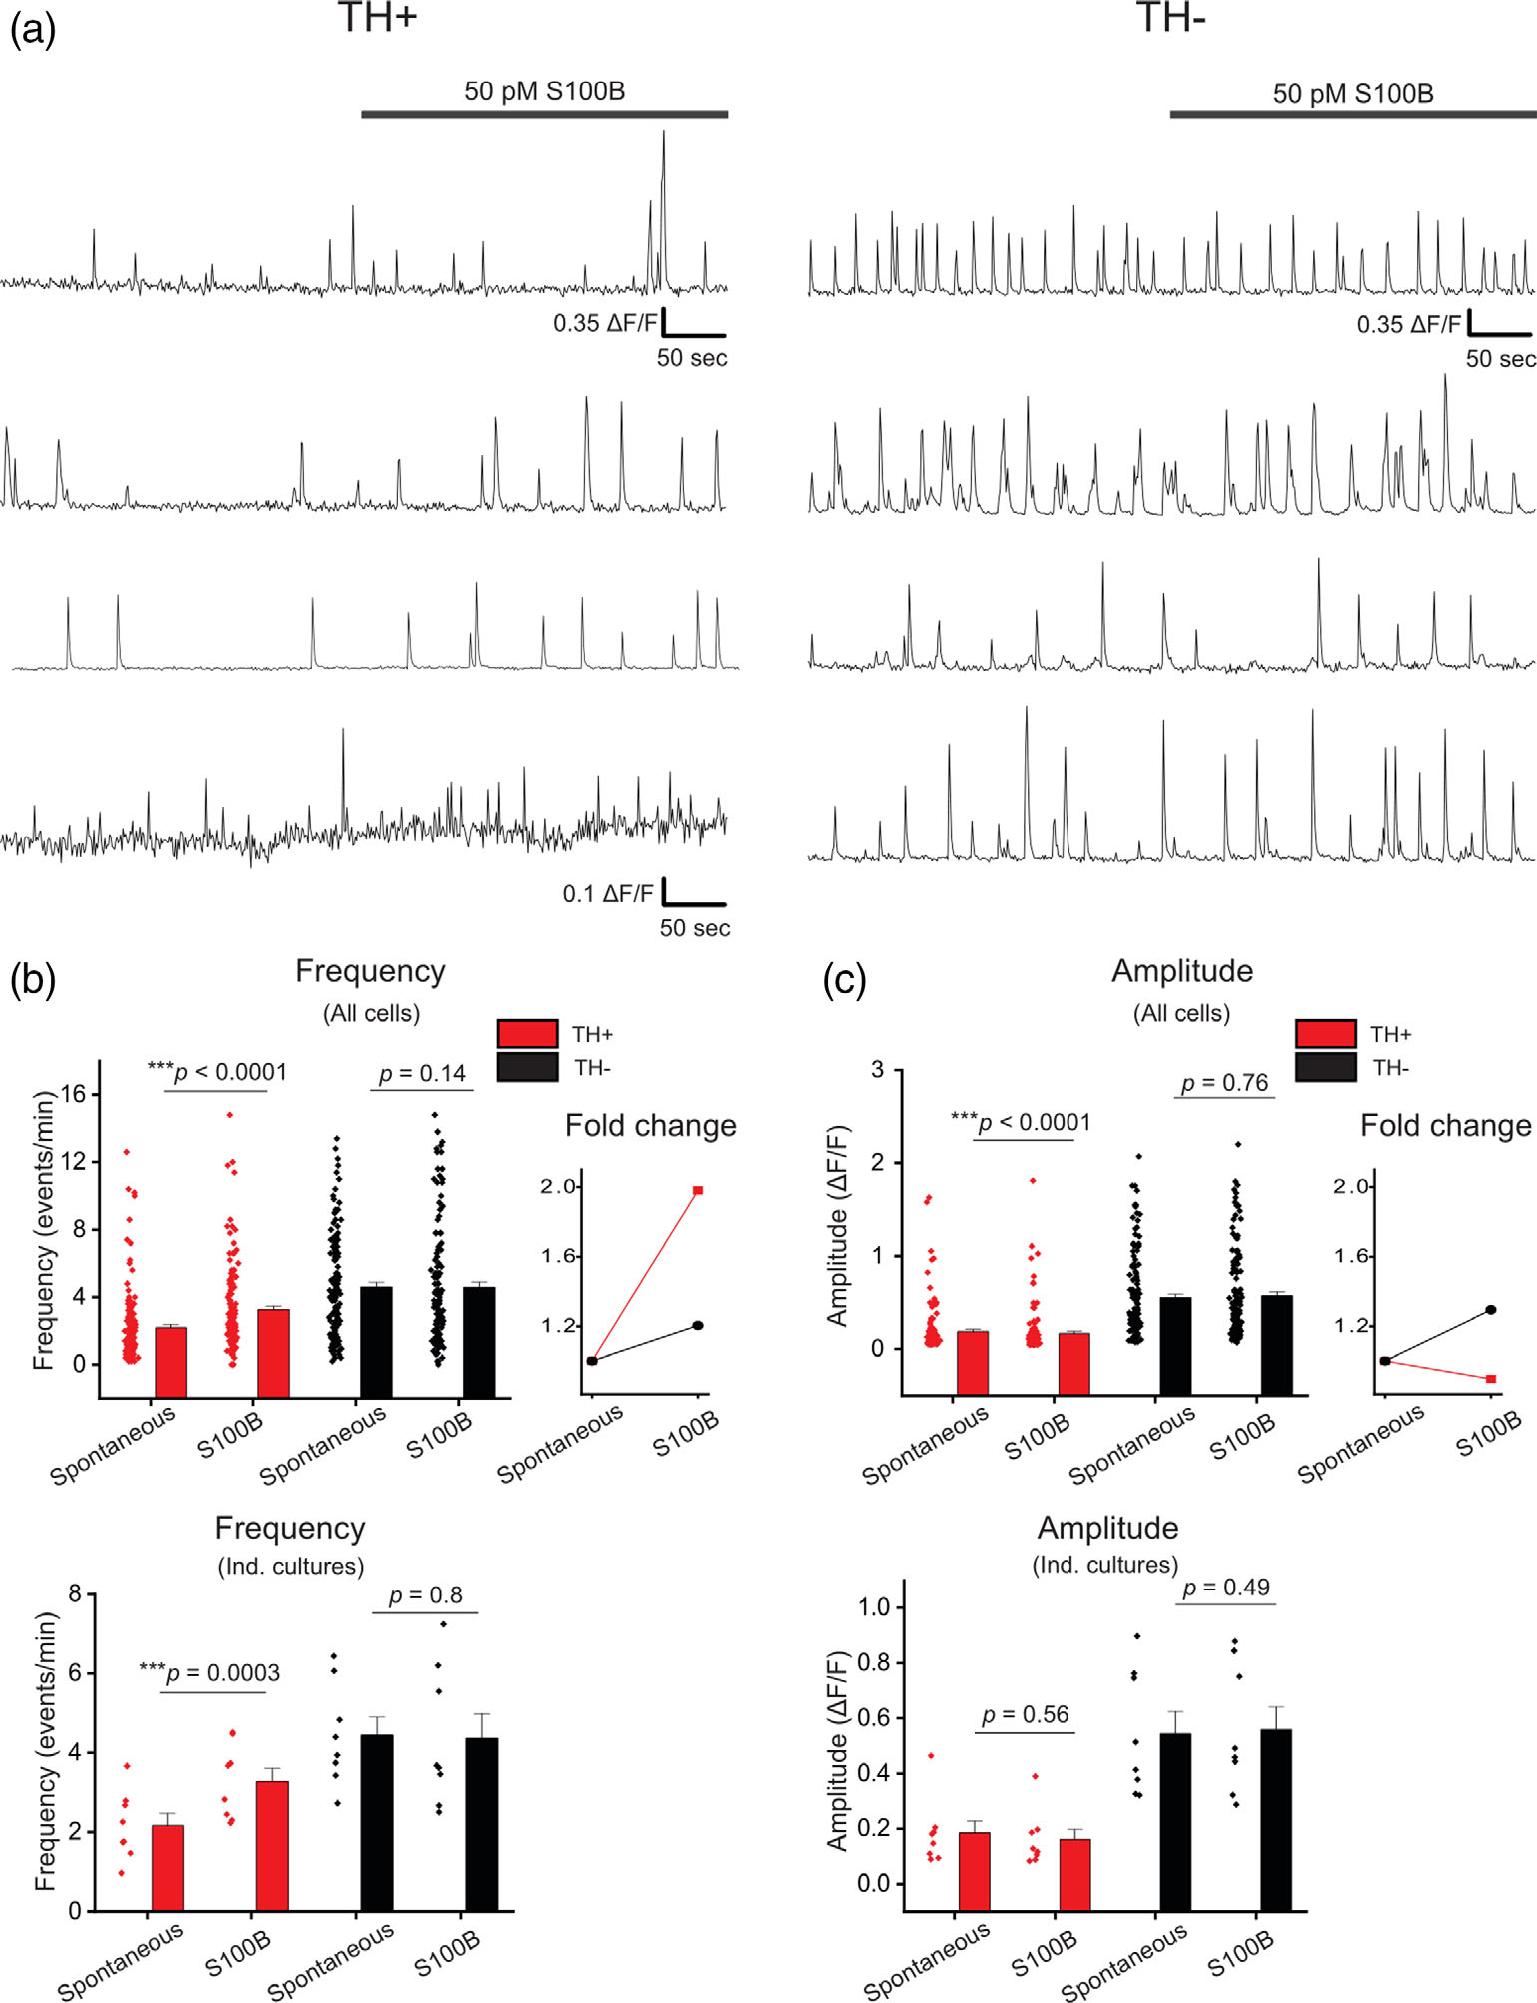
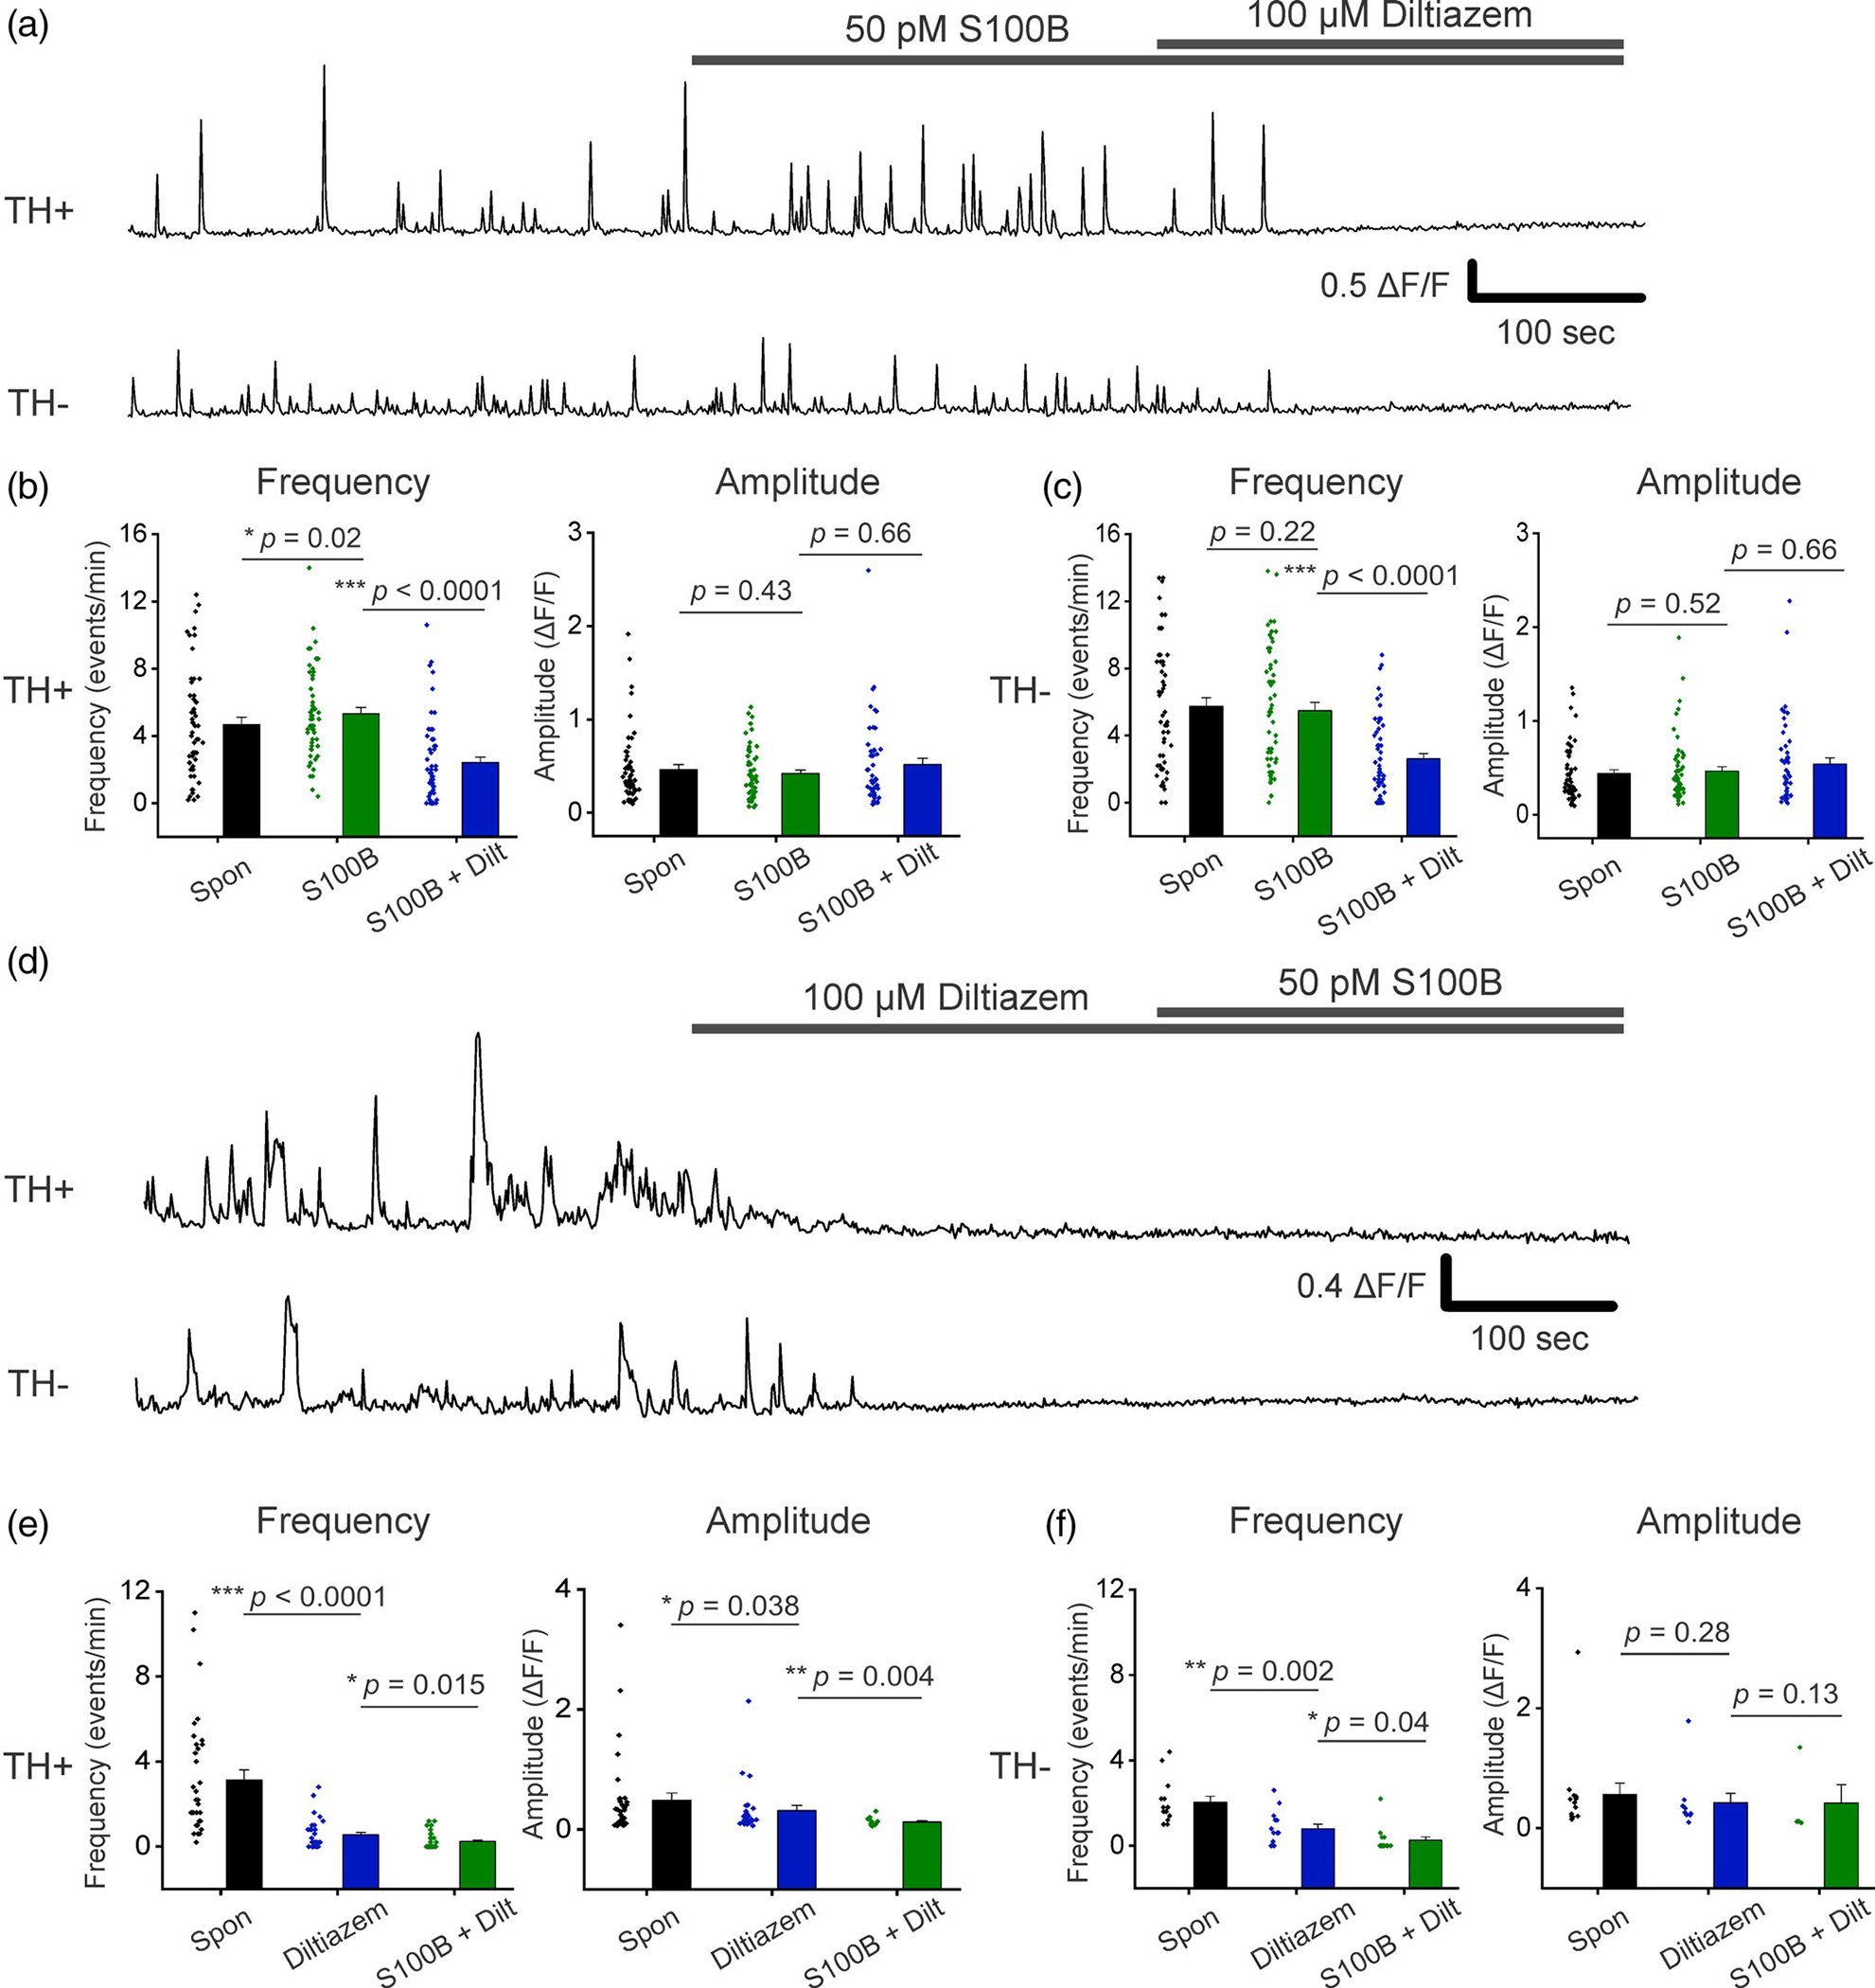
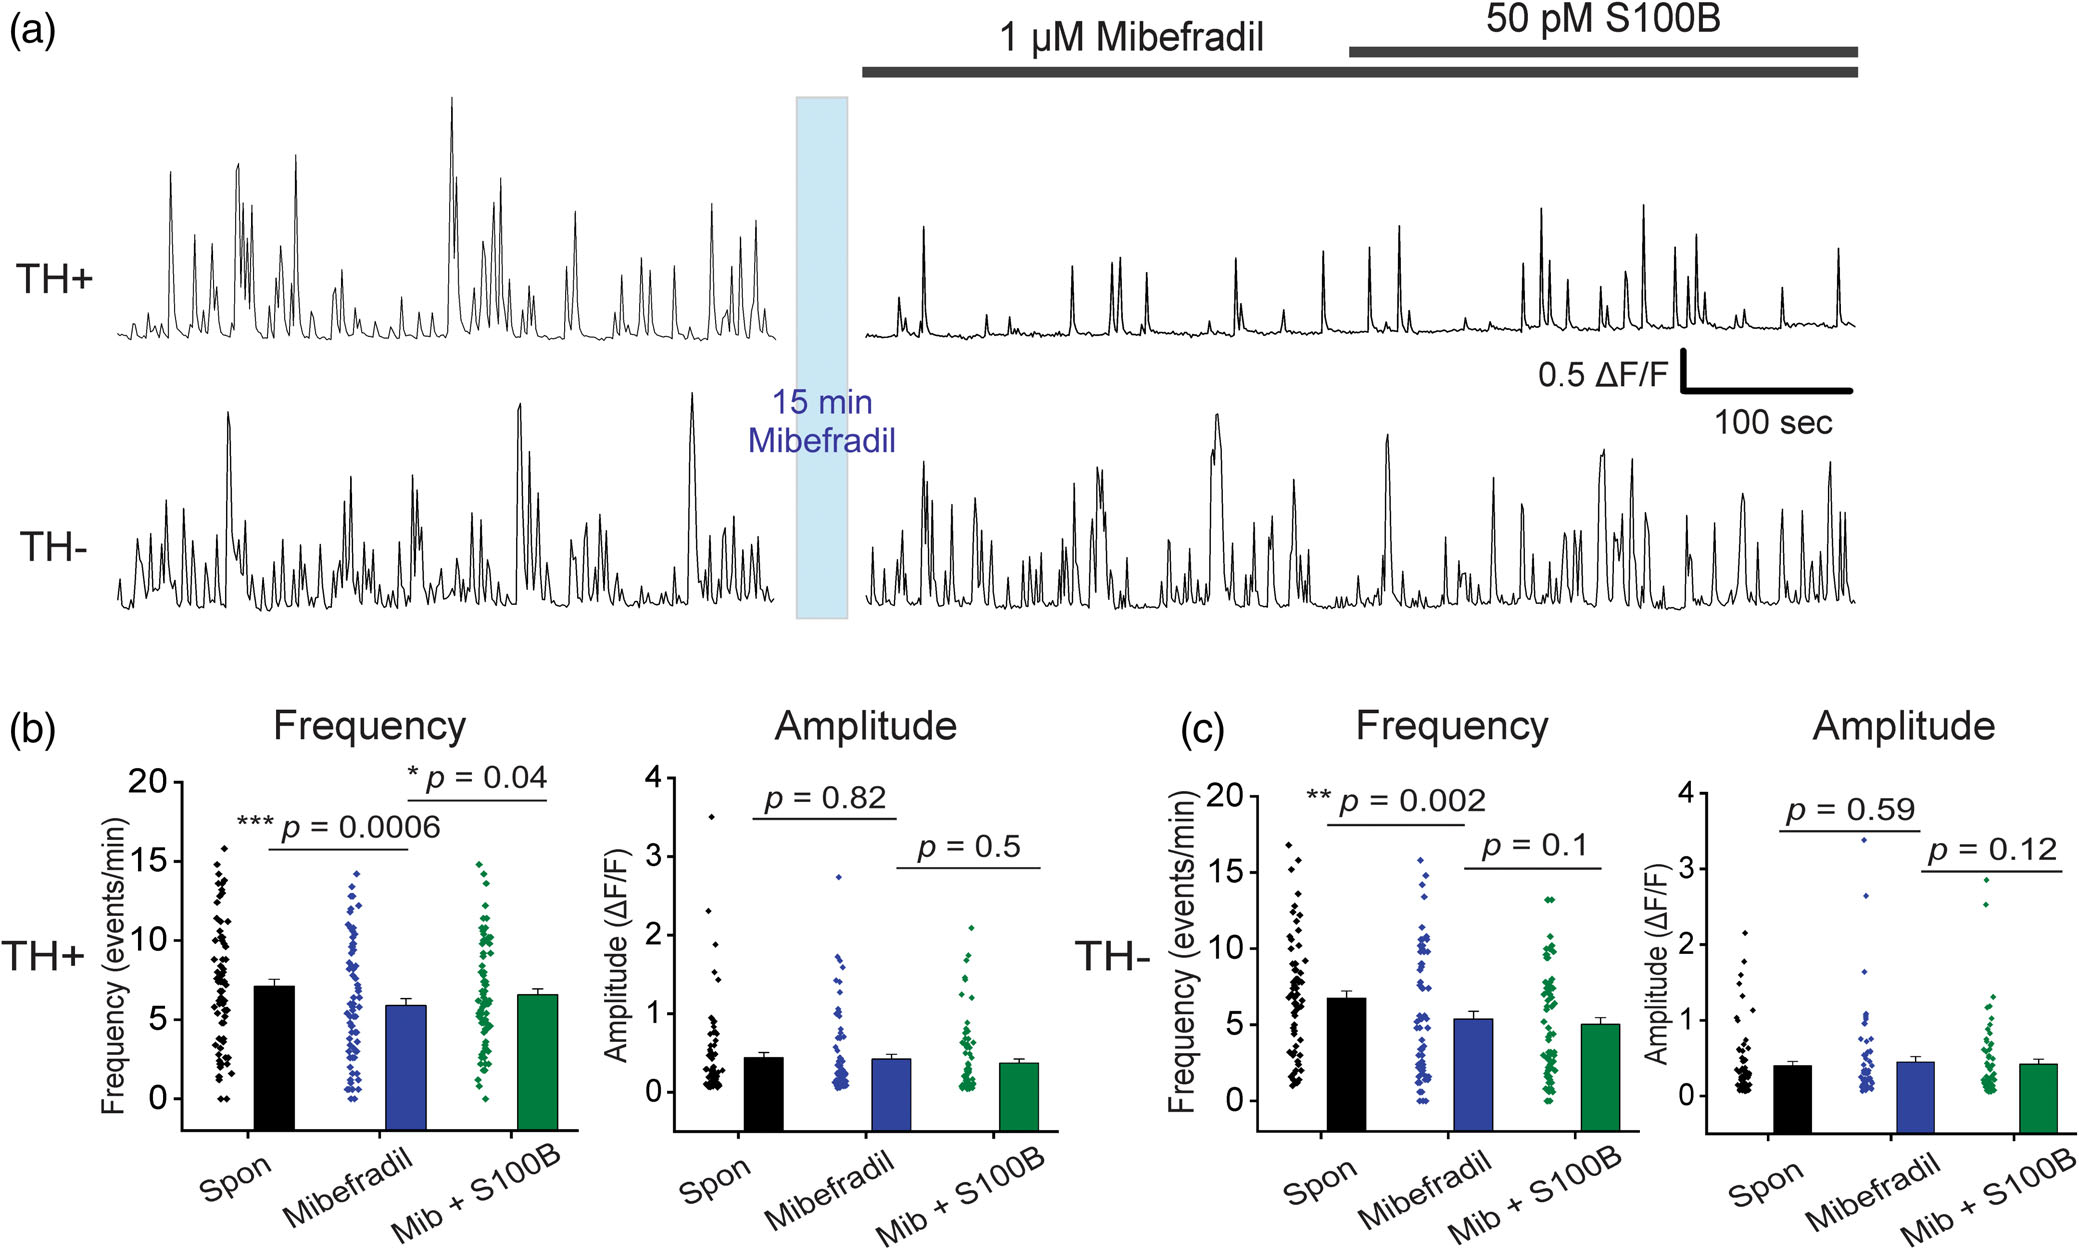
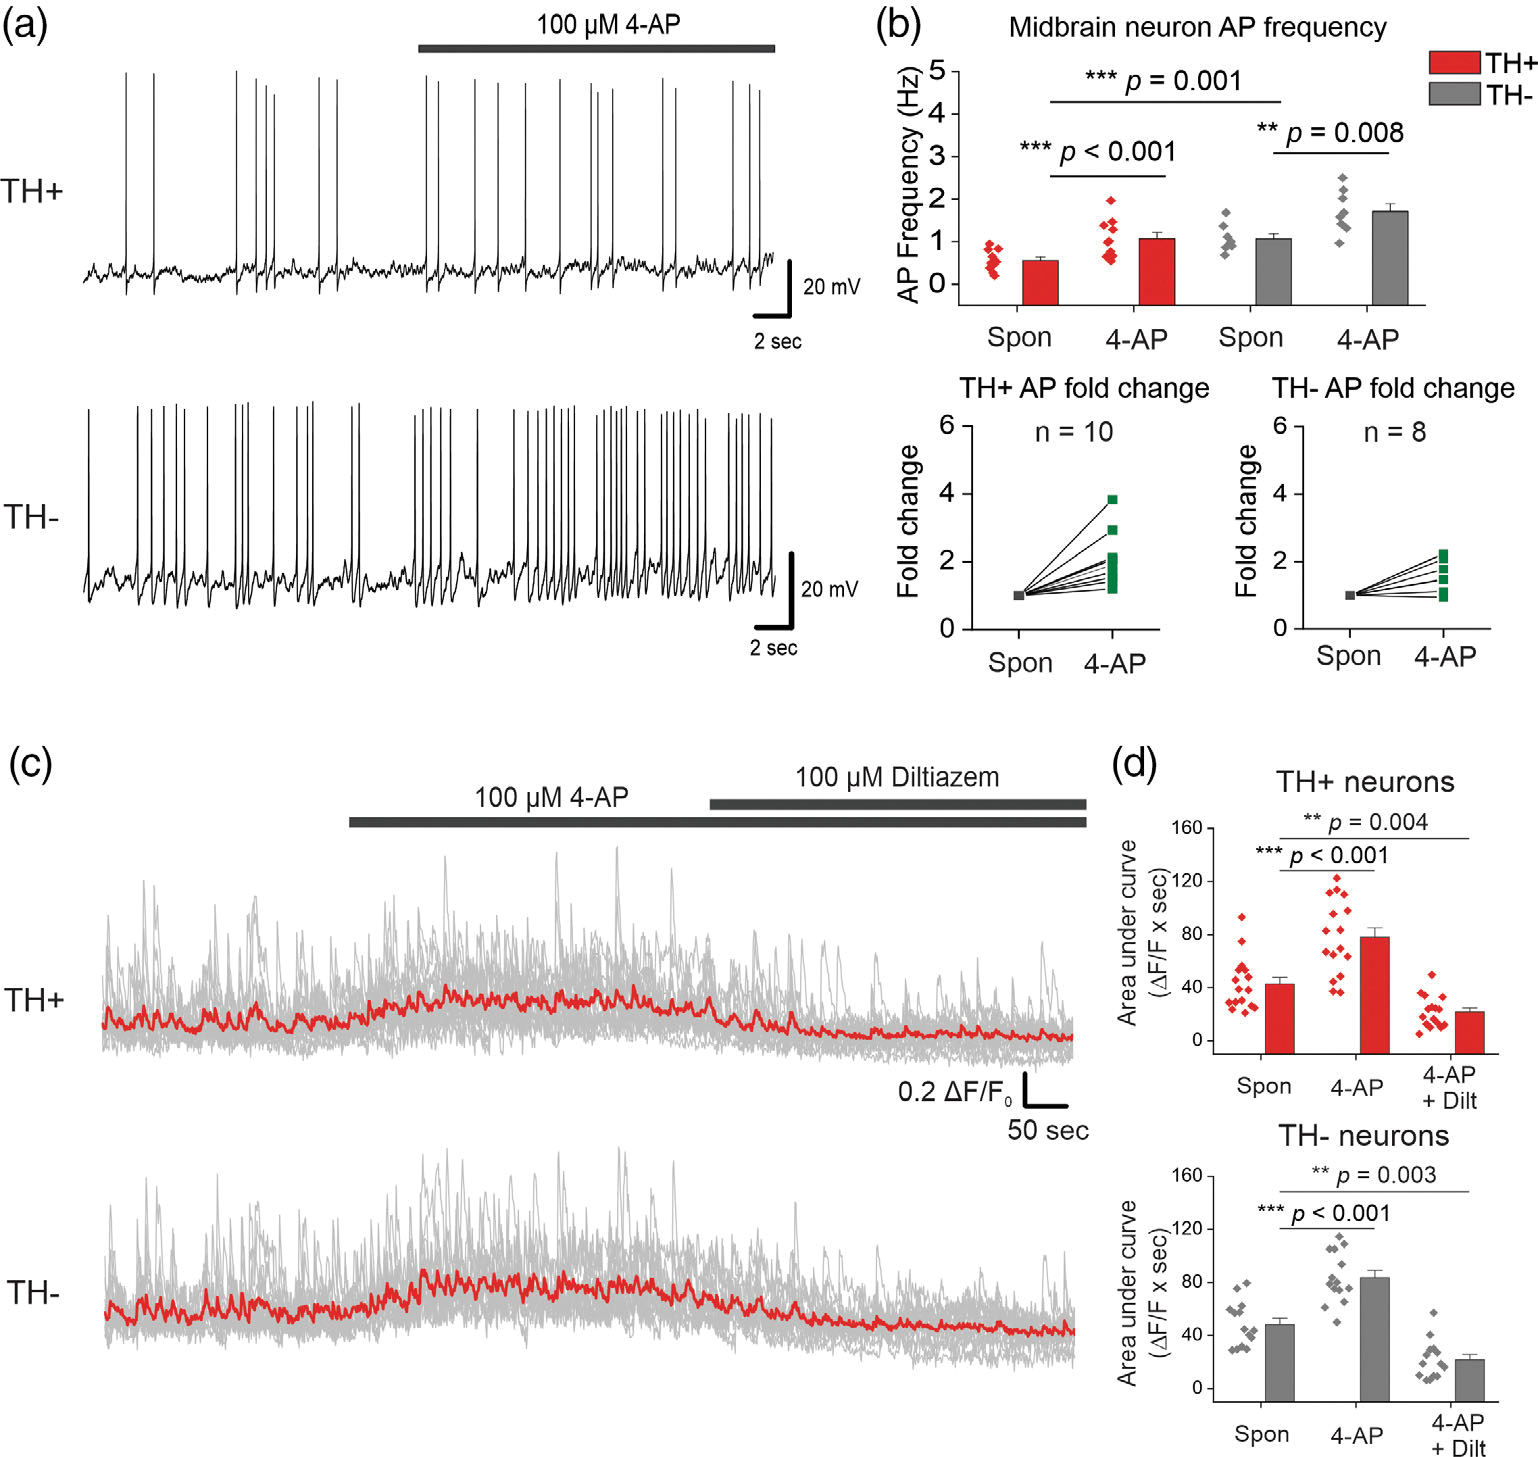
Parkinson's disease (PD) is associated with an increase in secreted S100B within the midbrain and cerebrospinal fluid. In addition, S100B overexpression in mice accelerates the loss of substantia nigra pars compacta dopaminergic (DA) neurons, suggesting a role for this protein in PD pathogenesis. We found that in the mouse SNc, S100B labeled astrocytic processes completely envelop the somata of tyrosine hydroxylase (TH) expressing DA neurons only in male mice. These data suggest that an increase in S100B secretion by astrocytes within the midbrain could play a role in DA dysfunction during early PD. We therefore asked if acute exposure to extracellular S100B alters the activity of identified TH expressing DA neurons in primary mouse midbrain cultures. Acute exposure to 50 pM S100B specifically inhibited A-type voltage-gated potassium currents in TH+ , but not TH- neurons. This was accompanied by ~2-fold increases in the frequency of both intrinsic firing, as well as L-type voltage-gated calcium channel (VGCC)-mediated calcium fluxes only in TH+ neurons. Further, exposure to 100 μM 4-aminopyridine (4-AP), an A-type voltage-gated potassium channel inhibitor, mimicked the S100B mediated increase in intrinsic firing and L-type VGCC-mediated calcium fluxes in TH+ neurons. Taken together, our finding that extracellular S100B alters the activity of native DA neurons via an inhibition of A-type voltage-gated potassium channels has important implications for understanding the pathophysiology of early PD.

Keywords: Parkinson's disease; S100B; astrocytes; calcium channels; neurodegeneration; potassium channels.


Conflict of interest statement

CONFLICT OF INTEREST

Authors declare no competing financial interests.

Figures

FIGURE 1
FIGURE 1
Wrapping of S100B-containing astrocytic processes around SNc DA neurons is significantly increased only in male mice. (a) A representative confocal mosaic of a mouse midbrain section immunostained for S100B (green) and TH (red), scale bar = 300 μm. Subregions of the midbrain are indicated with dotted lines (SNc, substantia nigra pars compacta; SNr, substantia nigra pars reticulata; VTA, ventral tegmental area). (b) Representative high magnification confocal images of S100B and TH expression in the SNc (top left) and VTA (top right), NeuN expression in the SNc is shown in the lower panel with white arrows denoting TH− neurons, scale bar = 10 μm. (c) Schematic of astrocyte wrapping analysis, described in detail in the methods section. (d) Graphs showing astrocyte wrapping of neuronal somata (left panel) and S100B expression intensity (right panel) across specific midbrain subregions in male and female mice. n = 8 midbrain sections from three male and three female mice. All errors are SEM; p-values are based on two sample t tests except for SNc TH+, VTA TH+, and SNc TH+, SNr TH comparisons which are Mann–Whitney tests. (e) Schematic for genetically expressing membrane bound GCaMP6f in astrocytes using AAV 2/5 GfaABC1D-Lck-GCaMP6f, including representative confocal images of astrocyte processes enveloping TH+ neurons in the SNc
FIGURE 2
FIGURE 2
Acute exposure to S100B specifically inhibits A-type voltage-gated potassium currents (IA) in TH+ neurons. (a) Schematic for measuring spontaneous action potentials and ionic currents in primary mouse midbrain neuron cultures using AAV 2/5 TH-GFP virus. (b) Representative image of a formalin-fixed primary mouse midbrain culture stained for NeuN, S100B, and TH; scale bar = 50 μm. (c) Representative images of TH-GFP expression in TH+ and TH neurons. (d) Representative traces of subtracted IA from TH+ and TH neurons with (right) and without (left) 50 pM S100B. (e) Left panel, I–V curves of TH+ and TH neurons in regular aCSF. Right panels, average I–V curves from TH+ and TH neurons with and without S100B. (f) Comparison of max IA from the most depolarizing stimulation step in TH+ and TH neurons. n = 12 for TH+ neurons and 11 for TH neurons from three independent weeks of culture. All errors are SEM; p-values for I-V curves are based on mixed-design ANOVA with post hoc Bonferroni correction; p-values for max IA Wilcoxon signed rank tests are used for TH+ control, TH+ S100B, paired sample t tests for TH control, TH S100B, and Mann–Whitney tests for TH+ control, TH control
FIGURE 3
FIGURE 3
Acute S100B exposure does not inhibit non-inactivating voltage-gated potassium currents (IK) in midbrain neurons. (a) Representative traces of IK from TH+ and TH neurons with (right) and without (left) 50 pM S100B. (b) Left panel, I–V curves of TH+ and TH neurons in regular aCSF. Right panels, average I–V curves from TH+ and TH neurons with and without S100B. (c) Comparison of max IK from the most depolarizing stimulation step in TH+ and TH neurons. n = 11 for TH+ neurons and 12 for TH neurons from three independent weeks of culture. All errors are SEM; p-values for I–V curves are based on mixed-design ANOVA with post hoc Bonferroni correction; p-values for max IK are based on paired sample t tests for TH+ control, TH+ S100B and TH control, TH S100B, and two sample t tests for TH+ control, TH control
FIGURE 4
FIGURE 4
Acute S100B exposure increases intrinsic AP frequency in TH+ neurons. (a) Representative traces of AP recordings from TH+ and TH neurons with acute application of 50 pM S100B. (b) Average AP frequency of TH+ and TH neurons with and without S100B; fold change for each TH+ and TH neuron is shown in the graphs below. n = 11 for TH+ neurons and 10 for TH neurons from three independent weeks of culture. All errors are SEM; p-values for AP frequency are based on paired sample t tests for TH+ spontaneous, TH+ S100B, Wilcoxon signed rank tests for TH spontaneous, TH S100B, and Mann–Whitney tests for TH+ spontaneous, TH control
FIGURE 5
FIGURE 5
Acute exposure of primary midbrain cultures to S100B peptide increases spontaneous Ca2+ flux frequency only in TH+ neurons. (a) Multiple representative traces of spontaneous Ca2+ fluxes in TH+ and TH neurons with acute bath application of 50 pM S100B peptide are shown. (b) A graph with average frequency of Ca2+ flux events from individual TH+ (red) and TH (black) neurons with and without S100B peptide is shown. The line graph on the right shows the average fold change of Ca2+ flux frequency for TH+ and TH cells following S100B application. The graph below shows the average frequency of TH+ and TH neurons binned by week of culture. (c) A graph with average amplitude of Ca2+ events from individual TH+ (red) and TH (black) neurons with and without S100B peptide. The line graph on the right shows the average fold change of Ca2+ flux amplitude for TH+ and TH cells following S100B application. The graph below shows the average amplitude of TH+ and TH neurons binned by individual culture. n = 137 for TH+ neurons and 134 for TH neurons from eight independent cultures. All errors are SEM; p-values for all cells are based on Wilcoxon signed rank tests for TH+ spontaneous, TH+ S100B and TH spontaneous, TH S100B and Mann–Whitney tests for TH+ spontaneous, TH spontaneous; p-values for individual cultures are based on paired sample t tests for TH+ spontaneous, TH+ S100B and TH spontaneous, TH S100B, and two sample t tests for TH+ spontaneous, TH spontaneous
FIGURE 6
FIGURE 6
Extracellular S100B mediated increase in spontaneous Ca2+ fluxes in TH+ DA neurons require active L-type VGCCs. (a) Representative traces of spontaneous Ca2+ fluxes in a TH+ and TH neuron with bath application of S100B, followed by co-application of S100B with diltiazem. (b) Graphs show average Ca2+ flux frequency and amplitude of TH+ neurons without any drug (black) with bath applied S100B (green), and co-applied S100B + diltiazem (blue). (c) Graphs show average Ca2+ flux frequency and amplitude of TH neurons without drug (black) with bath applied S100B (green), and co-applied S100B + diltiazem (blue). n = 55 for TH+ neurons and 57 for TH neurons from four independent weeks of culture. All errors are SEM; p-values for frequency and amplitude are based on Wilcoxon signed rank tests for all cases in panels b and c. (d) Representative traces of spontaneous Ca2+ fluxes in a TH+ and TH neuron with bath application of diltiazem, followed by co-application of diltiazem with S100B. (e) Graphs show average Ca2+ flux frequency and amplitude of TH+ neurons without any drug (black) with bath applied diltiazem (blue), and co-applied diltiazem + S100B (green). (f) Graphs show average Ca2+ flux frequency and amplitude of TH neurons without any drug (black) with bath applied diltiazem (blue), and co-applied diltiazem + S100B (green). n = 34 for TH+ neurons and 18 for TH neurons from four independent weeks of culture. All errors are SEM; p-values for frequency and amplitude are based on Wilcoxon signed rank tests for all cases in panels e and f
FIGURE 7
FIGURE 7
Extracellular S100B mediated increase in spontaneous Ca2+ fluxes in TH+ DA neurons does not require active T-type VGCCs. (a) Representative traces of spontaneous Ca2+ fluxes in a TH+ and TH neuron after 15 min incubation with 1 μM mibefradil, followed by co-application of S100B with mibefradil. (b) Graphs show average Ca2+ flux frequency and amplitude of TH+ neurons without any drug (black) with bath applied mibefradil (blue), and co-applied S100B + mibefradil (green). (c) Graphs show average Ca2+ flux frequency and amplitude of TH neurons without drug (black) with bath applied mibefradil (blue), and co-applied S100B + mibefradil (green). n = 75 for TH+ neurons and 66 for TH neurons from four independent weeks of culture. All errors are SEM; p-values for frequency and amplitude are based on Wilcoxon signed rank tests for all cases in panels b and c
FIGURE 8
FIGURE 8
The A-type VGKC inhibitor, 4-AP mimics S100B-mediated increases in intrinsic APs and L-type VGCC-mediated Ca2+ flux frequencies in midbrain neurons. (a) Representative traces of AP recordings from TH+ and TH neurons with acute application of 100 μM 4-AP. (b) Average AP frequency of TH+ and TH neurons with and without 4-AP; fold change for each TH+ and TH neuron is shown in the graphs below. n = 10 for TH+ neurons and 9 for TH neurons from two independent weeks of culture. All errors are SEM; p-values are based on paired sample t tests for TH+ spontaneous, TH+ 4-AP and TH spontaneous, TH 4-AP or two sample t tests for TH+ spontaneous, TH spontaneous. (c) Representative Ca2+ traces of TH+ and TH neurons with bath application of 4-AP, followed by co-application of 4-AP + diltiazem, the red line represents the average Ca2+ activity from all neurons of that cell type. (d) Graphs of average area under the curve with bath application of 4-AP, followed by co-application of 4-AP + diltiazem. n = 16 for TH+ neurons and 14 for TH neurons from two independent weeks of culture. All errors are SEM; p-values for TH+ neurons are based on Wilcoxon signed-rank tests, and paired sample t tests for TH neurons

Similar articles

Cited by

References

    1. Amendola J, Woodhouse A, Martin-Eauclaire MF, & Goaillard JM (2012). Ca(2)(+)/cAMP-sensitive covariation of I(A) and I(H) voltage dependences tunes rebound firing in dopaminergic neurons. The Journal of Neuroscience, 32(6), 2166–2181. 10.1523/JNEUROSCI.5297-11.2012 - DOI - PMC - PubMed
    1. Baldereschi M, di Carlo A, Rocca WA, Vanni P, Maggi S, Perissinotto E, Grigoletto F, Amaducci L, & Inzitari D (2000). Parkinson’s disease and parkinsonism in a longitudinal study: Two-fold higher incidence in men. ILSA working group. Italian longitudinal study on aging. Neurology, 55(9), 1358–1363. 10.1212/wnl.55.9.1358 - DOI - PubMed
    1. Bancroft EA, & Srinivasan R (2020). Quantifying spontaneous Ca2+ fluxes and their downstream effects in primary mouse midbrain neurons. Journal of Visualized Experiments, 163, e61481. 10.3791/61481 - DOI - PMC - PubMed
    1. Batassini C, Broetto N, Tortorelli LS, Borsoi M, Zanotto C, Galland F, Souza TM, Leite MC, & Gonçalves CA (2015). Striatal injury with 6-OHDA transiently increases cerebrospinal GFAP and S100B. Neural Plasticity, 2015, 387028. 10.1155/2015/387028 - DOI - PMC - PubMed
    1. Begcevic I, Brinc D, Drabovich AP, Batruch I, & Diamandis EP (2016). Identification of brain-enriched proteins in the cerebrospinal fluid proteome by LC-MS/MS profiling and mining of the human protein atlas. Clinical Proteomics, 13, 11. 10.1186/s12014-016-9111-3 - DOI - PMC - PubMed

Publication types

MeSH terms