. 2022 Nov;70(11):2207-2231.
doi: 10.1002/glia.24248. Epub 2022 Aug 2.

Differential role of neuronal glucose and PFKFB3 in memory formation during development

Affiliations

Differential role of neuronal glucose and PFKFB3 in memory formation during development

Emmanuel Cruz et al. Glia. 2022 Nov.

Abstract

The consumption of glucose in the brain peaks during late childhood; yet, whether and how glucose metabolism is differentially regulated in the brain during childhood compared to adulthood remains to be understood. In particular, it remains to be determined how glucose metabolism is involved in behavioral activations such as learning. Here we show that, compared to adult, the juvenile rat hippocampus has significantly higher mRNA levels of several glucose metabolism enzymes belonging to all glucose metabolism pathways, as well as higher levels of the monocarboxylate transporters MCT1 and MCT4 and the glucose transporters endothelial-GLUT1 and GLUT3 proteins. Furthermore, relative to adults, long-term episodic memory formation in juvenile animals requires significantly higher rates of aerobic glycolysis and astrocytic-neuronal lactate coupling in the hippocampus. Only juvenile but not adult long-term memory formation recruits GLUT3, neuronal 6-phosphofructo-2-kinase/fructose-2,6-biphosphatase 3 (PFKFB3) and more efficiently engages glucose in the hippocampus. Hence, compared to adult, the juvenile hippocampus distinctively regulates glucose metabolism pathways, and formation of long-term memory in juveniles involves differential neuronal glucose metabolism mechanisms.

Keywords: GLUT3; PFKFB3; development; glucose; hippocampus; lactate; memory.


Conflict of interest statement

DECLARATION OF INTEREST

The authors declare no competing interests.

Conflict of Interest: The authors have no conflict of interest to declare

Figures

Figure 1.
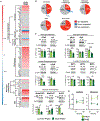
Figure 1.. Lactate and Glucose Metabolism Enzymes and Transporters are Significantly Elevated in the Juvenile Compared to Adult Hippocampus
(A) Heatmaps depicting mRNA Log2 fold-changes of 84 metabolic enzymes in the dorsal hippocampus of juvenile relative to adult rats (divided in subcategories; Glucose metabolism (glycolysis, gluconeogenesis, and glycolysis regulation), Glycogen metabolism, Pentose phosphate pathway (PPP), and TCA cycle). Red: significantly higher, Blue: significantly lower, Grey: no significant difference. Data are expressed as Log2 fold change. N= 4/group. GS: Glycogen synthesis, GD: Glycogen degradation, GR: Glycogen regulation. (B) Pie charts representing the % of the 84 transcripts significantly higher (red) or lower (blue) or unchanged (gray) in the juvenile dorsal hippocampus relative to adult. Divided in subcategories as in A. Significance was set at p < 0.05. See Supplemental Table 1 for individual numeric Log2 fold-changes and p values. (C) Western blots analysis of astrocyte and metabolic markers in juvenile and adult dorsal hippocampi: glial fibrillary acidic protein (GFAP), glutamine synthetase (GS), total and phosphorylated forms of glycogen synthase (GyS and pGyS), lactate dehydrogenases (LDHA and LDHB), lactate monocarboxylate transporters (MCT1, MCT2, and MCT4), glucose transporters (endo-GLUT1, glia-GLUT1, and GLUT3). Data are expressed as mean percentage ± SEM of the adult mean values. *p < 0.05, **p < 0.01, ***p < 0.001, unpaired Student’s t-test. N= 4–6/group. The EndoGLUT1 and GliaGLUT1 bands were detected on the same blots using different exposures; the figure examples show different exposures of the same blots. (D) Basal concentration (in mM) of extracellular lactate and glucose in juvenile and adult dorsal hippocampi. *p < 0.05, **p < 0.01, repeated measures two-way ANOVA followed by Bonferroni’s multiple comparisons test. N= 5–6/group. The numeric values with detailed statistical analyses of experiments shown in 1C and 1D are shown in Supplemental Table 2.
Figure 2.
Figure 2.. Juvenile Learning Differentially Regulates the Hippocampal Levels of Glucose, Lactate and Their Transporters
(A) Hippocampal relative levels of extracellular lactate and glucose measured by in vivo microdialysis in freely moving untrained and trained juvenile rats. Baseline was collected for 20 minutes before training (0 min, arrow) and continued for 70 minutes after training. *p < 0.05, **p < 0.01, ***p < 0.001, repeated measures two-way ANOVA followed by Bonferroni’s multiple comparisons test. N= 5/group. (B) Memory retention expressed in juveniles and adults as mean latency ± SEM (in seconds, sec). Training (Tr) and testing (T1 and T2) schedule above the graph. N= 4–9/group. (C-E) Western blot analysis of glucose transporters (Endothelial GLUT1, Glial GLUT1, and Neuronal GLUT3) in the dorsal hippocampus of rats trained at PN24 and euthanized at 30 minutes, 20 hours, and 6 days after training relative to age-matched controls. Data are expressed as mean percentage ± SEM of the untrained (100%) mean values; *p < 0.05, **p < 0.01, ***p < 0.001, unpaired Student’s t-test. N= 5–7/group. (F) Western blot analysis of glucose transporters (Endo-GLUT1, Glia-GLUT1, and GLUT3) in dorsal hippocampal extracts obtained at 20 hours after training at PN80 relative to age-matched controls. Data are expressed as mean percentage ± SEM of the untrained (100%) mean values. N= 5/group. The numeric values with detailed statistical analyses of the experiments of Figure 2 are shown in Supplemental Table 2. EndoGLUT1 and GliaGLUT1 bands shown in figures 2C–D are from different exposures of the same blot.
Figure 3.
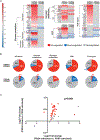
Figure 3.. Juvenile Learning Differentially Regulates All Major Pathways of Glucose Metabolism Enzymes in The Hippocampus
(A) Heatmaps depicting mRNA Log2 fold-changes of 84 metabolic enzymes in the dorsal hippocampus of trained juvenile (TRPN24) relative to untrained juvenile (UTPN24) rats (left panels) and trained adult (TRPN80) relative to untrained adult (UTPN80) rats (right panels); divided in subcategories, Glucose metabolism (glycolysis, gluconeogenesis, and glycolysis regulation), Glycogen metabolism, Pentose phosphate pathway (PPP), and TCA cycle. Red: significantly up-regulated; Gray: unchanged; Blue: significantly down-regulated. Data are expressed as Log2 fold change. N= 4/group GS: Glycogen synthesis, GD: Glycogen degradation, GR: Glycogen regulation. (B) Pie charts representing the % of the 84 transcripts significantly upregulated (red) or downregulated (blue) or unchanged (gray) in trained juvenile (TRPN24) or trained adult (TRPN80) relative to their respective untrained rats. Divided in subcategories as in A. Significance was set at p < 0.05. See Supplemental Table 3 for individual numeric Log2 fold-changes and p values. (C) Correlation between the mRNAs significantly elevated in the hippocampus of juveniles (Figure 1A and 1B) and the mRNAs regulated following learning at the same age.
Figure 4.
Figure 4.. Glucose Over Lactate is Preferentially Engaged in Juvenile Long-term Memory
(A-F) Memory retention is expressed as mean latency ± SEM (in seconds, sec). Training (Tr), testing (T1, T2, T3, and T4), reminder shock (Rmd), and retraining (RTr) schedule above graphs. (A) Hippocampal injection of vehicle or DAB together with 100 nmol, 300 nmol, 600 nmol, 1000 nmol L-lactate or vehicle (PBS) were performed 15 minutes (black arrow) before training at PN24. Memory was tested 1 day (Test 1) and 6 days (Test 2) later. They were again tested at PN32 after a reminder shock (Test 3) and after retraining at PN33 (Test 4). *p < 0.05, **p < 0.01, repeated measures two-way ANOVA followed by Bonferroni post hoc. N= 7–12/group. (B) Hippocampal injection of vehicle or DAB together with 50 nmol, 150 nmol D-glucose, or vehicle (PBS) were performed 15 minutes (black arrow) before training at PN24 and memory was tested 1 day (Test 1) and 6 days (Test 2) later. *p < 0.05, **p < 0.01, ***p < 0.001, repeated measures two-way ANOVA followed by Bonferroni post hoc. N= 8–11/group. (C) Hippocampal injection of vehicle or DAB together with 300 nmol L-lactate, 150 nmol D-glucose, or vehicle (PBS) were performed 15 minutes (black arrow) before training followed by an injection of either 300 nmol L-lactate, 150 nmol D-glucose or vehicle 5 hours after training (grey arrow) at PN24. Memory was tested 1 day (Test 1) and 6 days (Test 2) later. *p < 0.05, **p < 0.01, repeated measures two-way ANOVA followed by Bonferroni post hoc. N= 8–10/group. (D) Hippocampal injections of Scrambled-ODNs (SCR-ODN) or MCT4 antisense ODNs (MCT4-AS) one hour before training (black arrow) followed by an injection of 100 nmol L-lactate or vehicle (PBS) at 15 minutes before training (grey arrow) at PN24. Memory was tested 1 day (Test 1) and 6 days (Test 2) later. They were again tested at PN32 after a reminder shock (Test 3) and after retraining at PN33 (Test 4). *p < 0.05, repeated measures two-way ANOVA followed by Bonferroni post hoc. N= 5–6/group (E) Hippocampal injections of scrambled-ODNs (SCR-ODN) or MCT2 antisense ODNs (MCT2-AS) one hour before training (black arrow) followed by an injection of 300 nmol L-lactate, 150 nmol D-glucose or vehicle (PBS) performed 15 minutes before training (grey arrow) at PN24. Memory was tested 1 day (Test 1) and 6 days (Test 2) later. They were again tested at PN32 after a reminder shock (Test 3) and after retraining at PN33 (Test 4). ***p < 0.001, repeated measures two-way ANOVA followed by Bonferroni post hoc. N= 5–6/group. (F) Hippocampal injections of antisense Scrambled-ODNs (SCR-ODN) or MCT2 antisense ODNs (MCT2-AS) one hour before training (black arrow) followed by an injection of 300 nmol L-lactate, 150 nmol D-glucose or vehicle performed 15 minutes before training (grey arrow) and a third injection of either 300 nmol L-lactate, 150 nmol D-glucose or vehicle given at 5 hours after training (grey arrow) at PN24. Memory was tested 1 day (Test 1) and 6 days (Test 2) later. *p < 0.05, **p < 0.01, repeated measures two-way ANOVA followed by Bonferroni post hoc. N= 5–6/group. (G) Hippocampal injections of antisense Scrambled-ODNs (SCR-ODN) or MCT2 antisense ODNs (MCT2-AS) one hour before training (black arrow) followed by an injection of 150 nmol D-glucose or vehicle performed 15 minutes before training (grey arrow) and a third injection of 150 nmol D-glucose or vehicle given at 5 hours after training (grey arrow) at PN80. Memory was tested 1 day (Test 1) and 6 days (Test 2) later. *p < 0.05, **p < 0.01, repeated measures two-way ANOVA followed by Bonferroni post hoc. N= 6–7/group. The numeric values with detailed statistical analyses of the experiments of Figure 4 are shown in Supplemental Table 2.
Figure 5.
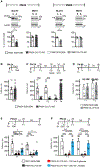
Figure 5.. Differential Requirement of GLUT3 for Long-term Memory Formation In Juveniles
(A) Western blot analysis of GLUT3 and MCT2 in the juvenile and adult dorsal hippocampi injected with GLUT3 antisense ODN (GLUT3-AS) or scrambled-ODN (SCR-ODN) 1 hour before training and collected 20 hours after training. Data are expressed as mean percentage ± SEM of the SCR-ODN (100%) mean values; *p < 0.05, **p < 0.01, unpaired Student’s t-test. N= 4–6/group. (B-F) Memory retention is expressed as mean latency ± SEM (in seconds, sec). Training (Tr), testing (T1, T2, T3, and T4), reminder shock (Rmd), and retraining (RTr) schedule above graphs. (B) Juvenile rats received hippocampal injections of SCR-ODN or GLUT3-AS one hour before training at PN24 (black arrow) and memory was tested 1 hour after training. N= 6/group. (C) Juvenile rats were injected bilaterally into the hippocampus with SCR-ODN or GLUT3-AS one hour before training at PN24 (black arrow). Memory was tested 1 day (Test 1) and 6 days (Test 2) later. They were again tested at PN32 after a reminder shock (Test 3) and after retraining at PN33 (Test 4). ***p < 0.001, repeated measures two-way ANOVA followed by Bonferroni post hoc. N= 6/group. (D) Adult rats received a bilateral hippocampal injection of SCR-ODN or GLUT3-AS one hour before training at PN80 (black arrow) and memory was tested at 1 day later (Test 1), and 6 days later (Test 2). N= 7–8/group. (E) Juvenile rats received a bilateral hippocampal injection of SCR-ODN or GLUT3-AS one hour before training at PN24 (black arrow) followed by a second injection of 300 nmol L-lactate, 150 nmol D-glucose or vehicle (PBS) at 15 minutes before training (grey arrow). Memory was tested 1 day (Test 1) and 6 days (Test 2) later. *p < 0.05, ***p < 0.001, repeated measures two-way ANOVA followed by Bonferroni post hoc. N= 8–10/group. (F) A bilateral hippocampal injection of SCR-ODN or GLUT3-AS one hour before training at PN24 (black arrow) followed by a 300 nmol L-lactate, 150 nmol D-glucose, or vehicle (PBS) injection at 15 minutes before training (grey arrow) and another injection of either 300 nmol L-lactate, 150 nmol D-glucose or vehicle 5 hours after training (grey arrow) at PN24. Memory was tested at (1 day, Test 1) and (6 days, Test 2). ***p < 0.001, repeated measures two-way ANOVA followed by Bonferroni post hoc. N= 6–8/group. The numeric values with detailed statistical analyses of the experiments of Figure 5 are shown in Supplemental Table 2.
Figure 6.
Figure 6.. PFKFB3, Differentially Expressed In The Neurons Of The Juvenile Hippocampus, Is Upregulated By Learning
(A) Western blot analysis of dorsal hippocampal levels of PFKFB3 and APC/C-Cdh1 in juveniles (PN24) and adults (PN80). Data are expressed as mean percentage ± SEM of the adult (100%) mean values; *p < 0.05, unpaired Student’s t-test. N= 4–6/group. (B) Western blot analysis of dorsal hippocampal levels of PFKFB3 and APC/C-Cdh1 20 hours after training at PN24 compared to age-matched controls. Data are expressed as mean percentage ± SEM of the untrained (100%) mean values; *p < 0.05, unpaired Student’s t-test. N= 5–7/group. (C) Western blot analysis of dorsal hippocampal levels of PFKFB3 and APC/C-Cdh1 20 hours after training at PN80 compared to untrained controls. Data are expressed as mean percentage ± SEM of the untrained (100%) mean values. n= 5/group. (D) Immunohistochemical double-staining analyses of PFKFB3 with S100 (astrocytes) or with MAP2 (neurons) in juveniles and adult hippocampal CA1. (scale bar, 20 μm). Data are expressed as mean percentage ± SEM of the adult (100%) mean values; ***p < 0.001, unpaired Student’s t-test. 12 brain sections/rat, n= 3 rats/group. (E) Immunohistochemical double-staining analyses of APC/C-Cdh1 with S100 (astrocytes) or with MAP2 (neurons) in juveniles and adult hippocampal CA1. (scale bar, 20 μm). Data are expressed as mean percentage ± SEM of the adult (100%) mean values; ***p < 0.001, unpaired Student’s t-test. 12 brain sections/rat, n= 3 rats/group. (F) Immunohistochemical double staining analyses of PFKFB3 with S100 (astrocytes) or with MAP2 (neurons) in the hippocampus of juvenile trained rats euthanized at 20 hours after training relative to untrained controls (scale bar, 20 μm). Data are expressed as mean percentage ± SEM of the untrained (100%) mean values; **p < 0.01, unpaired Student’s t-test. 12 brain sections/rat, n= 3 rats/group. (G) Immunohistochemical double staining analyses of APC/C-Cdh1 with S100 (astrocytes) or with MAP2 (neurons) in the hippocampus of juvenile trained rats euthanized at 20 hours after training relative to untrained controls (scale bar, 20 μm). Data are expressed as mean percentage ± SEM of the untrained (100%) mean values; *p < 0.05, ***p < 0.001, unpaired Student’s t-test. 12 brain sections/rat, n= 3 rats/group. The numeric values with detailed statistical analyses of the experiments of Figure 6 are shown in Supplemental Table 2.
Figure 7.
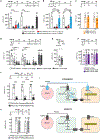
Figure 7.. Neuronal PFKFB3 Is Required for Juvenile But Not Adult Long-term Memory
(A-H) Memory retention is expressed as mean latency ± SEM (in seconds, sec). Training (Tr), testing (T1, T2, T3, and T4), reminder shock (Rmd), and retraining (RTr) schedule above graphs. (A) Juvenile rats received hippocampal injections of SCR-ODN or PFKFB3-AS one hour before training (black arrow) followed by an injection of 300 nmol L-lactate, 150 nmol D-glucose or vehicle (PBS) at 15 minutes before training (grey arrow) at PN24. Memory was tested 1 day (Test 1) and 6 days (Test 2) later. They were again tested at PN32 after a reminder shock (Test 3) and after retraining at PN33 (Test 4). ***p < 0.001, repeated measures two-way ANOVA followed by Bonferroni post hoc. N= 6/group (B) Juvenile rats received hippocampal injections of SCR-ODN or PFKFB3-AS one hour before training (black arrow) followed by an injection of 300 nmol L-lactate, 150 nmol D-glucose, or vehicle (PBS) at 15 minutes before training (grey arrow) and another injection of either 300 nmol L-lactate, 150 nmol D-glucose or vehicle 5 hours after training (grey arrow) at PN24. Memory was tested 1 day (Test 1) and 6 days (Test 2) later. ***p < 0.001, repeated measures two-way ANOVA followed by Bonferroni post hoc. N= 6/group. (C) Adult rats received hippocampal injections of SCR-ODN or PFKFB3-AS one hour before training at PN80 (black arrow) and memory was tested at 1 day (Test 1) and 6 days later (Test 2). N= 6/group. (D) Juvenile rats received a bilateral hippocampal injection of vehicle (PBS) 2 fmol, 2 pmol, or 2 nmol of AZ26 15 minutes before training at PN24 (black arrow). Memory was tested 1 day (Test 1) and 6 days (Test 2) later. They were again tested at PN32 after a reminder shock (Test 3) and after retraining at PN33 (Test 4). **p < 0.01, ***p < 0.001, repeated measures two-way ANOVA followed by Bonferroni post hoc. N= 6–10/group. (E) Juvenile rats received a bilateral hippocampal injection of vehicle (PBS) or 2 pmol AZ26 (PBS) 15 minutes before training at PN24 black arrow) and memory was tested 1 hour after training. N= 6/group. (F) Adult rats received a bilateral hippocampal injection of vehicle (PBS) or 2 pmol, 2 nmol of AZ26 15 minutes before training at PN80 (black arrow) and memory was tested 1 day (Test 1) and 6 days later (Test 2). N= 7/group. (G) Juvenile rats received a bilateral hippocampal injection of hSyn-Control-shRNA-AAVDJ or hSyn-PFKFB3-shRNA-AAVDJ 10 days before training at PN24 (black arrow) and memory was tested 1 day (Test 1) and 6 days (Test 2) later. They were again tested at PN32 after a reminder shock (Test 3). ***p < 0.001, repeated measures two-way ANOVA followed by Bonferroni post hoc. N= 7–8/group. (H) Adult rats received a bilateral hippocampal injection of hSyn-Control-shRNA-AAVDJ or hSyn-PFKFB3-shRNA-AAVDJ 10 days before training at PN80 (black arrow) and memory was tested 1 day (Test 1) and 6 days (Test 2) later. N= 6/group. The numeric values with detailed statistical analyses of the experiments of Figure 7A-7H are shown in Supplemental Table 2. (I) Models illustrating distinctive hippocampal metabolic pathways involved in long-term memory formation in juvenile and adult rats. Blue indicates the metabolic pathways differentially engaged in juvenile long-term memory (GLUT3 and neuronal PFKFB3).

Similar articles

Cited by

References

    1. Agostini M, Romeo F, Inoue S, Niklison-Chirou MV, Elia AJ, Dinsdale D, Morone N, Knight RA, Mak TW, and Melino G (2016). Metabolic reprogramming during neuronal differentiation. Cell Death Differ. 23, 1502–1514. - PMC - PubMed
    1. Alberini CM, and Kandel ER (2015). The Regulation of Transcription in Memory Consolidation. Cold Spring Harb. Perspect. Biol 7, a021741. - PMC - PubMed
    1. Alberini CM, and Travaglia A (2017). Infantile Amnesia: A Critical Period of Learning to Learn and Remember. J. Neurosci 37, 5783–5795. - PMC - PubMed
    1. Alberini CM, Cruz E, Descalzi G, Bessières B, and Gao V (2017). Astrocyte glycogen and lactate: New insights into learning and memory mechanisms. Glia. - PMC - PubMed
    1. Allaman I, and Magistretti PJ (2013). Brain Energy Metabolism. In Fundamental Neuroscience: Fourth Edition, p.

Publication types