

Mesenchymal tumor organoid models recapitulate rhabdomyosarcoma subtypes
- PMID: 35916583
- PMCID: PMC9549731
- DOI: 10.15252/emmm.202216001
Mesenchymal tumor organoid models recapitulate rhabdomyosarcoma subtypes
Abstract
Rhabdomyosarcomas (RMS) are mesenchyme-derived tumors and the most common childhood soft tissue sarcomas. Treatment is intense, with a nevertheless poor prognosis for high-risk patients. Discovery of new therapies would benefit from additional preclinical models. Here, we describe the generation of a collection of 19 pediatric RMS tumor organoid (tumoroid) models (success rate of 41%) comprising all major subtypes. For aggressive tumors, tumoroid models can often be established within 4-8 weeks, indicating the feasibility of personalized drug screening. Molecular, genetic, and histological characterization show that the models closely resemble the original tumors, with genetic stability over extended culture periods of up to 6 months. Importantly, drug screening reflects established sensitivities and the models can be modified by CRISPR/Cas9 with TP53 knockout in an embryonal RMS model resulting in replicative stress drug sensitivity. Tumors of mesenchymal origin can therefore be used to generate organoid models, relevant for a variety of preclinical and clinical research questions.
Keywords: CRISPR/Cas9; drug screening; mesenchymal; rhabdomyosarcoma; tumoroid.
© 2022 The Authors. Published under the terms of the CC BY 4.0 license.
Figures

- A
Tumor organoid (tumoroid) pipeline. WGS, whole‐genome sequencing; RNA‐seq, mRNA sequencing; liq N2, liquid nitrogen.
- B
Overview of available RMS tumoroid models in the collection separated by primary versus metastatic site and exact tumor location. The color of the inner circle indicates the histological subtype while the color of the outer circle indicates the presence or absence of a fusion transcript. Letters within the circle indicate disease instance. Asterisks mark tumoroid models derived from the same patient but from distinct tumor samples.
- C
Brightfield microscopy images of two representative RMS tumoroid models from a fusion‐negative embryonal and a PAX3‐FOXO1 fusion‐positive alveolar tumoroid model grown in a two‐dimensional monolayer in two magnifications as indicated by the scale bars.

- A
RT‐qPCR of early passage RMS tumoroid models shows positivity for at least one gene used in standard‐of‐care pathology analysis (DES, MYOG, or MYOD1). Conventional RMS cell lines (RD and RH30) were used as positive controls, while two Synovial Sarcoma (SS000DAZ and SS077) tumoroid models were used as negative controls. Gene expression was normalized to the expression of a house‐keeping gene and human reference RNA (HREF) via the ΔΔCq method. Each tumoroid line was measured once with four technical replicates with the error bars representing the standard deviation of said technical replicates.
- B
RT‐qPCR of early passage RMS tumoroid models reliably detects the aberrant fusion transcripts. Fusion gene expression was normalized to the expression of a house‐keeping gene via the ΔCq method. Each tumoroid line was measured once with four technical replicates with the error bars representing the standard deviation of said technical replicates.
- C
Morphological (via H&E) and immunohistochemical (IHC) comparison of RMS tumors and derived RMS tumoroid models shows retained marker protein (Desmin, Myogenin and MYOD1) expression and cellular morphology. Scale bars equal 200 μm (RMS012, RMS102) or 100 μm (RMS000HQC).
- D
t‐SNE projection of single‐cell transcriptomes from the RMS127 and RMS444 tumoroid models. Plots on the right show the normalized expression values, per single cell, of MYOG, MYOD1, DES, and MKI67, respectively.


- A
H&E and immunohistochemistry (IHC) stainings of early passage RMS102 (passage 2 and passage 4 – passage 6 used for drug screening) and RMS000HQC (passage 1 and passage 3 – passage 5 used for drug screening). Scale bars equal 100 μm.
- B
Heatmaps showing the inferred CNV profiles of single cells (y‐axis) from the RMS127 and RMS444 tumoroid models, respectively. Chromosome arms are delineated by dotted lines where applicable.

- A
Copy number frequency plots of RMS tumors (upper row) and derived RMS tumoroid models (lower row) divided by fusion‐status (columns). Chromosomes are annotated on the x‐axis from left to right while the y‐axis shows the percentage of samples in this group carrying a gain (red) or loss (blue) in this genomic region.
- B
Contribution of somatic mutational signatures per tumor and tumoroid model. SBS, single base substitution; TMZ, temozolomide; T, tumor; O, tumoroid.
- C
Table depicting pathogenic single‐nucleotide variants (SNVs) in RMS tumors (T) and tumoroid models (O). Circle color indicates SNV type while circle size indicates variant allele fraction (VAF). Vertical dotted lines separate samples derived from individual patients. Highlighted are genes previously reported for this RMS subtype.
- D
Correlogram of bulk mRNA sequencing expression profiles of pediatric kidney tumors (controls) as well as RMS tumoroid models and RMS tumors. CCRCC, Clear Cell Renal Cell Carcinoma; CMN, Congenital Mesoblastic Nephroma; WT, Wilms' Tumor; Cor, correlation.

- A
Examples of circular copy number plots of fusion‐negative RMS with embryonal (RMS000ETY) or alveolar (RMS007) histology. Outer circle depicts the tumoroid model, inner circle depicts the tumor.
- B
Examples of circular copy number plots of fusion‐positive RMS with alveolar histology and PAX3‐FOXO1 fusion (RMS410) or PAX7‐FOXO1 fusion (RMS000HQC). Outer circle depicts the tumoroid model, inner circle depicts the tumor.
- C
Contribution of averaged single base substitution (SBS) profiles for RMS tumors (upper row) and tumoroid models (lower row).
- D
Clustered correlogram of SBS profiles detected in RMS tumors (T) and tumoroid models (O).
- E
Comparison of total number of mutations (synonymous and nonsynonymous) in RMS tumors and tumoroid models per fusion‐type (fusion‐negative n = 4, fusion‐positive = 15, Wilcoxon test, P = 0.15 for tumors, P = 0.02 for tumoroid models). Data are shown as boxplots: The central line in the box represents the median; the upper and lower limits of the box represent the third and first quartile, respectively; the whiskers represent the minimum (bottom) and maximum (top) values excluding outliers, which are plotted as individual points.

- A
Correlogram of variant allele fraction (VAF) of single‐nucleotide variants (SNVs) detected in RMS tumors and derived tumoroid models per pair.
- B
Density plots of alternate allele (B‐allele) fraction over the entire genome per RMS tumor (red) and derived RMS tumoroid model (blue) per pair.

Contribution of somatic mutational signatures per tumor and tumoroid model. SBS, single base substitution; TMZ, temozolomide; T, tumor; O, standard passage tumoroid model; OL, late passage tumoroid model; O2, independently derived tumoroid model.
Table depicting pathogenic single‐nucleotide variants (SNVs) in different RMS tumoroid models derived from the same tumor sample. Circle color indicates SNV type while circle size indicates variant allele fraction (VAF). Highlighted are genes previously reported for this RMS subtype.
Principal component analysis on bulk mRNA sequencing derived global gene expression. Color indicates the RMS tumoroid model while the symbol indicates the sample. O, standard passage tumoroid model; OL, late passage tumoroid model; O2, independently derived tumoroid model.

- A
Circular copy number plots of standard and late passage RMS tumoroid models of a fusion‐negative alveolar (RMS007) and a PAX7‐FOXO1 positive alveolar (RMS335) RMS. Outer circle depicts the standard passage tumoroid, inner circle depicts the late passage tumoroid model.
- B
Circular copy number plots of standard passage and independently derived RMS tumoroid models of two fusion‐negative embryonal RMS (RMS012 and RMS444). Outer circle depicts the standard passage tumoroid, inner circle depicts the independently derived tumoroid model.
- C
Contribution of averaged single base substitution (SBS) profiles for standard (O), independently derived (O2), and late passage (OL) RMS tumoroid models.
- D
Clustered correlogram of SBS profiles detected in standard (O), independently derived (O2), and late passage (OL) RMS tumoroid models.
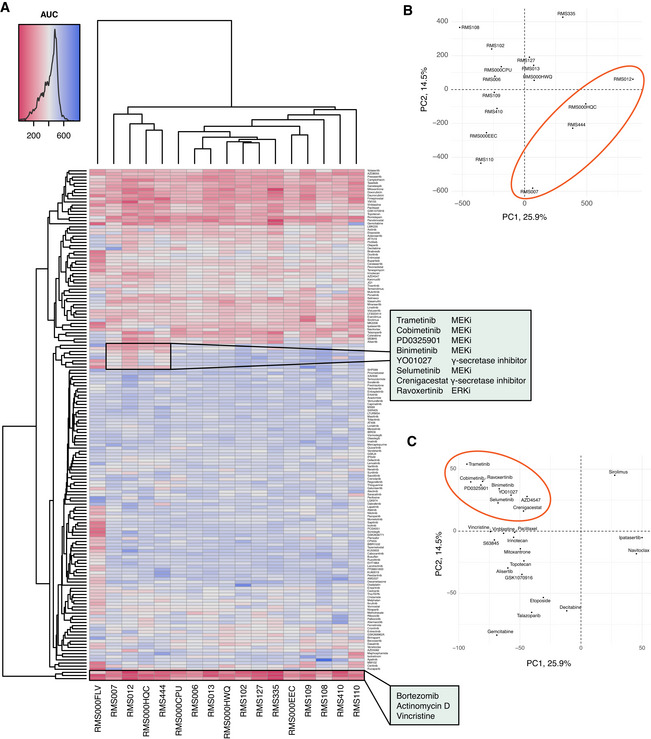
- A
Clustered heatmap of viability measurements per RMS tumoroid model (x axis) and drug (y axis), showing the Area Under the Curve (AUC) after treatment of the cells for 120 h with a dose‐range of 0.1 nM to 10 μM. Low AUC (red) indicates high drug efficacy while high AUC (blue) indicates low drug efficacy. Annotated clusters of (1) MEK/ERK and γ‐secretase inhibitors showing specific efficacy in RMS tumoroid models without (RMS007, RMS012, RMS444) or low (RMS000HQC) fusion transcript expression, and (2) drugs that show broad efficacy across RMS tumoroid models.
- B
Principal component analysis of drug screening AUC values of the RMS tumoroid models (RMS000FLV omitted due to outlier behavior as discussed in the main text). The ellipse indicates the cluster that shows specific sensitivity against MEK/ERK and γ‐secretase inhibitors.
- C
Principal component analysis of the top 25 contributing drugs that influence variance. The ellipse indicates the MEK/ERK and γ‐secretase inhibitors as well as AZD4547 (RMS000FLV omitted as described above).

- A
Transfection and selection strategy to achieve TP53 knockout in a TP53 wild‐type tumoroid model.
- B
Western Blot analysis of TP53 wild‐type (WT) and knockout (KO) RMS tumoroid line RMS012. Histone 3 (H3) served as loading control.
- C
Dose‐response curve of TP53 WT and KO cells treated with the Chk‐1 inhibitor prexasertib. Thin lines with numbers indicate individual biological replicates (n = 3) while thick lines indicate fitted lines over all replicates. The statistical significance of the differences in fitted IC50 values between WT and KO were obtained using a two‐sided t‐test (P = 0.008).

- A
Left panel: Inferred Indel Spectrum from Sanger sequencing using the TIDE tool (
https://tide.nki.nl ). Right panel: Sanger sequencing around Cas9 cut site (arrow at the bottom) in TP53 gene. Protospacer Adjacent Motif (PAM) sequence indicated. - B
Western Blotting analysis of γH2AX (Ser‐139) as proxy for DNA double‐strand breaks in untreated RMS012 tumoroid cells (TP53 wildtype and TP53 knockout). RMS cell line RD treated with staurosporine served as positive control while GAPDH served as loading control.
References
-
- Amary MFC, Berisha F, Bernardi FDC, Herbert A, James M, Reis‐Filho JS, Fisher C, Nicholson AG, Tirabosco R, Diss TC et al (2007) Detection of SS18‐SSX fusion transcripts in formalin‐fixed paraffin‐embedded neoplasms: analysis of conventional RT‐PCR, qRT‐PCR and dual color FISH as diagnostic tools for synovial sarcoma. Mod Pathol 20: 482–496 - PubMed
Publication types
MeSH terms
LinkOut - more resources
Full Text Sources
Research Materials
Miscellaneous
