. 2022 Jun 25;29(4):dsac024.
doi: 10.1093/dnares/dsac024.

Construction of prediction models for growth traits of soybean cultivars based on phenotyping in diverse genotype and environment combinations

Affiliations

Construction of prediction models for growth traits of soybean cultivars based on phenotyping in diverse genotype and environment combinations

Andi Madihah Manggabarani et al. DNA Res. .

Abstract

As soybean cultivars are adapted to a relatively narrow range of latitude, the effects of climate changes are estimated to be severe. To address this issue, it is important to improve our understanding of the effects of climate change by applying the simulation model including both genetic and environmental factors with their interactions (G×E). To achieve this goal, we conducted the field experiments for soybean core collections using multiple sowing times in multi-latitudinal fields. Sowing time shifts altered the flowering time (FT) and growth phenotypes, and resulted in increasing the combinations of genotypes and environments. Genome-wide association studies for the obtained phenotypes revealed the effects of field and sowing time to the significance of detected alleles, indicating the presence of G×E. By using accumulated phenotypic and environmental data in 2018 and 2019, we constructed multiple regression models for FT and growth pattern. Applicability of the constructed models was evaluated by the field experiments in 2020 including a novel field, and high correlation between the predicted and measured values was observed, suggesting the robustness of the models. The models presented here would allow us to predict the phenotype of the core collections in a given environment.

Keywords: field phenotyping; multiple regression models; multiple sowing times; soybean.


Figures

Figure 1
Figure 1
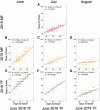
Scatter plots depicting the FTs for all 93 soybean cultivars in two fields and across three different sowing times compared with the FT in June 2018 in TF. (A) July 2018 in MF; (B) June 2019 in MF; (C) July 2019 in MF; (D) August 2019 in MF; (E) June 2019 in TF; (F) July 2019 in TF; (G) August 2019 in TF. The correlation and P-value were calculated based on Pearson’s correlation.
Figure 2
Figure 2
Relationship between FT and terminal plant height. Red and orange represent MF in 2018 and 2019. Blue and green represent TF in 2018 and 2019. Square, cross, and triangle dots represent individual cultivar sown in June, July, and August, respectively. Solid, dashed, and dotted-dashed lines represent regression lines for cultivars sown in June, July, and August, respectively (A color version of this figure appears in the online version of this article).
Figure 3
Figure 3
Scatter plots depicting the relationships between the observed values and the estimated values of the traits FT, K, and r calculated by the models with 50 genetic factors using the training data in 2018 and 2019. (A–D) The estimated values of FT were, respectively, calculated by the models P = G, P = E, P = G + E, and P = G + E + G×E; (E–H and I–L) the estimated values of K and r were calculated in the same way; the horizontal axis and the vertical axis show the observed values and the estimated values, respectively. Samples in TF and MF are indicated by small circles with blue and red edge colour. Samples observed in June, July, and August in 2019 are coloured in cyan, light green, and light red. Samples in 2018 are coloured in yellow. The Pearson’s correlation coefficient between the observed values and the estimated values is indicated at the bottom right of each plot. The RMSE is also indicated in the parentheses (A color version of this figure appears in the online version of this article).
Figure 4
Figure 4
Scatter plots depicting the relationships between the observed values and the predicted values of the traits FT, K, and r calculated by the models (P = G + E + G×E) with genetic factors (50 sequence variants) and the environmental factors (average temperatures, sowing date, and latitude) and their interactions using the test data in 2020. (A) Relationship between the observed values and the predicted values in relation to the FT model; (B) relationship in relation to the K model; (C) relationship in relation to the r model. The horizontal axis and the vertical axis show the observed values and the predicted values, respectively. Samples in TF, KF, and MF are indicated by small circles with blue, green, and red edge colour. Samples observed in June, July, and August in 2020 are coloured in cyan, light green, and light red. The Pearson’s correlation coefficient between the observed values and the predicted values is indicated at the bottom right of each plot. The RMSE is also indicated in the parentheses.

References

    1. Cober E.R., Morrison M.J.. 2010, Regulation of seed yield and agronomic characters by photoperiod sensitivity and growth habit genes in soybean, Theor. Appl. Genet., 120, 1005–12. - PubMed
    1. Zhang L.X., Kyei-Boahen S., Zhang J., et al.2007, Modifications of optimum adaptation zones for soybean maturity groups in the USA, Crop Manag., 6, 1–11.
    1. Deryng D., Conway D., Ramankutty N., Price J., Warren R.. 2014, Global crop yield response to extreme heat stress under multiple climate change futures, Environ. Res. Lett., 9, 034011.
    1. Yang Q., Lin G., Lv H., et al.2021, Environmental and genetic regulation of plant height in soybean, BMC Plant Biol., 21, 63. - PMC - PubMed
    1. Xu H., Zhang L., Zhang K., Ran Y.. 2020, Progresses, challenges, and prospects of genome editing in soybean (Glycine max), Front. Plant Sci., 11, 571138. - PMC - PubMed

Grants and funding