. 2022 Aug 30;222(1):iyac104.
doi: 10.1093/genetics/iyac104.

Selective disruption of Drp1-independent mitophagy and mitolysosome trafficking by an Alzheimer's disease relevant tau modification in a novel Caenorhabditis elegans model

Affiliations

Selective disruption of Drp1-independent mitophagy and mitolysosome trafficking by an Alzheimer's disease relevant tau modification in a novel Caenorhabditis elegans model

Sanjib Guha et al. Genetics. .

Abstract

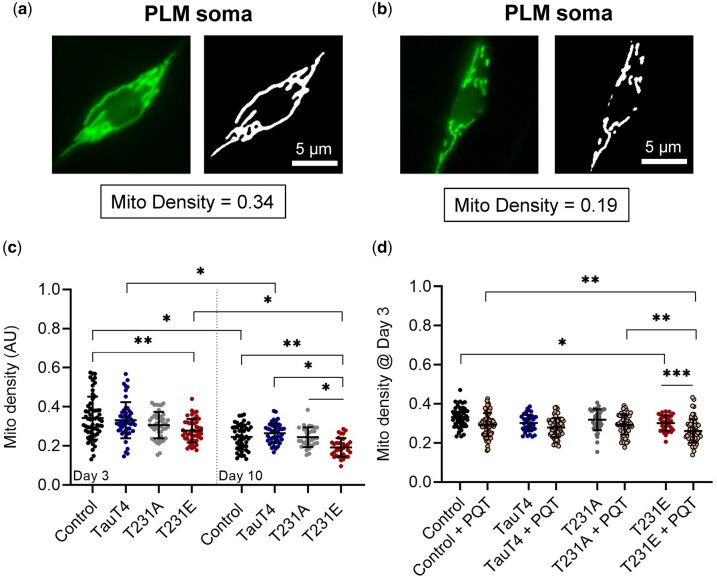
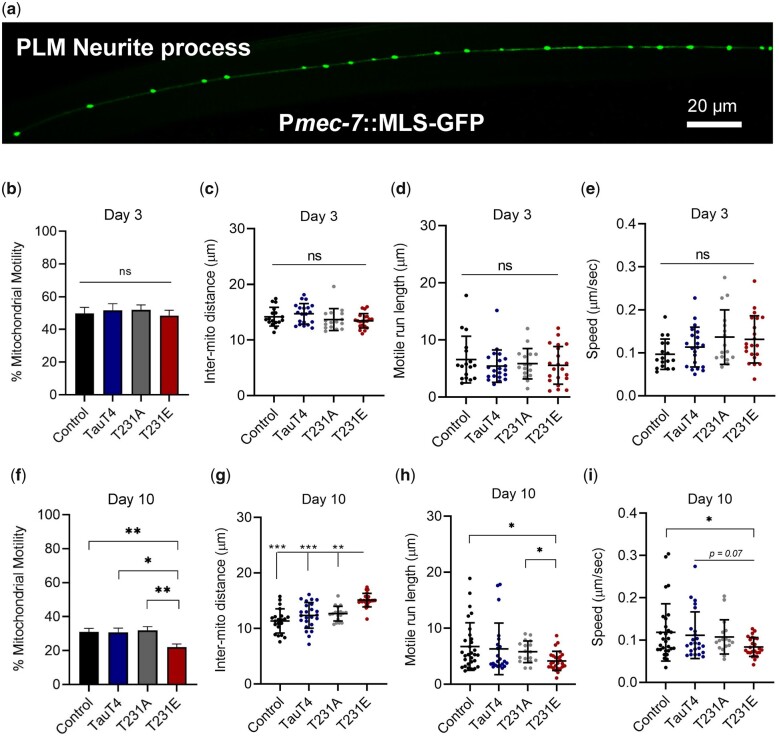
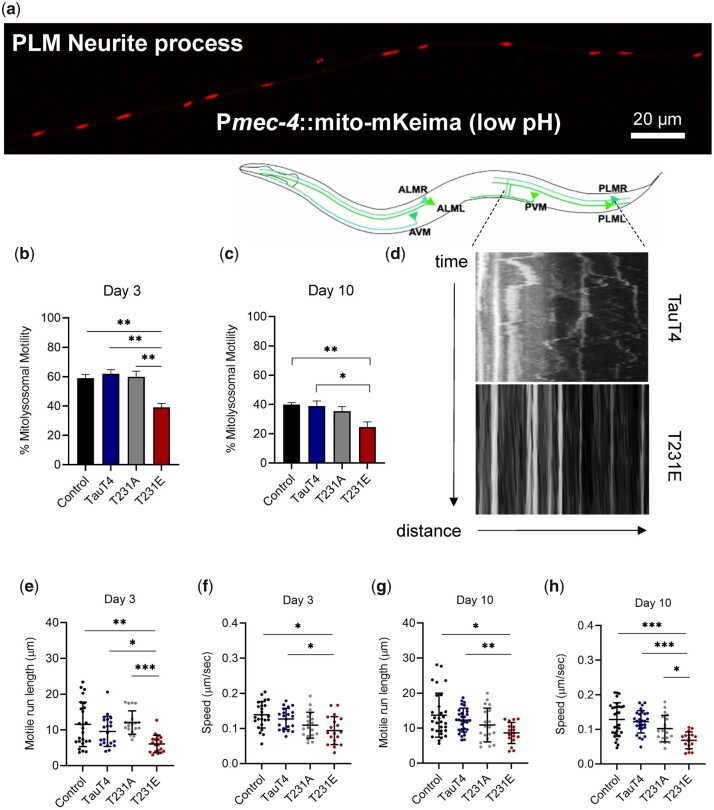
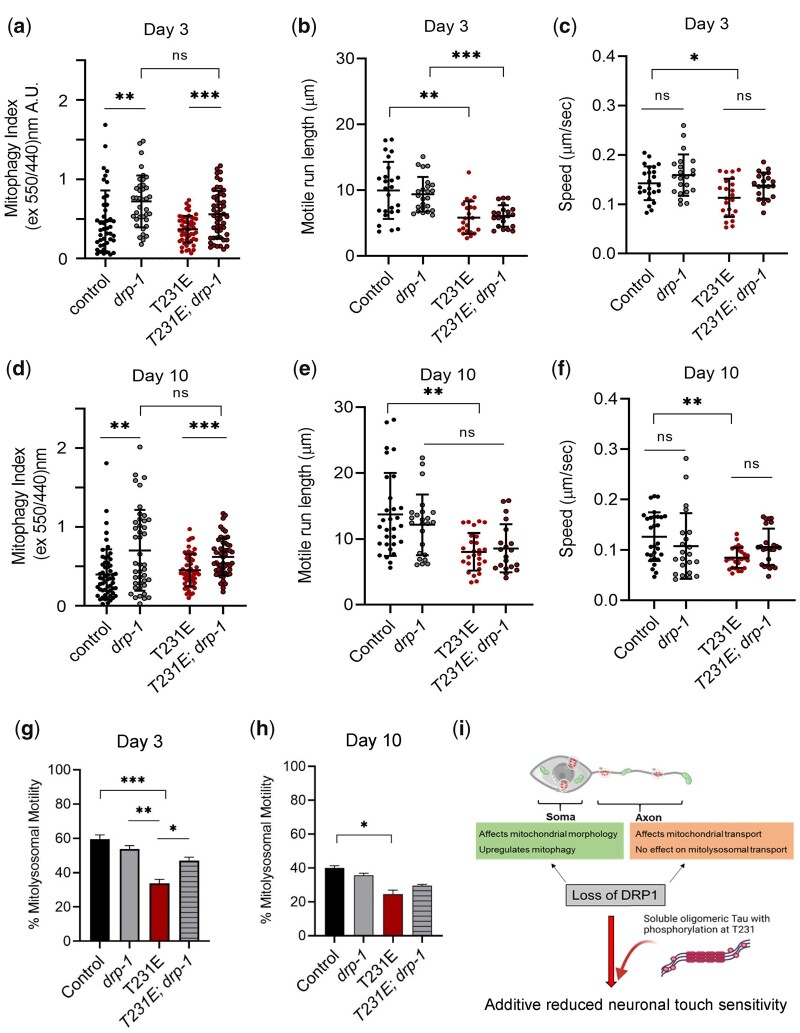
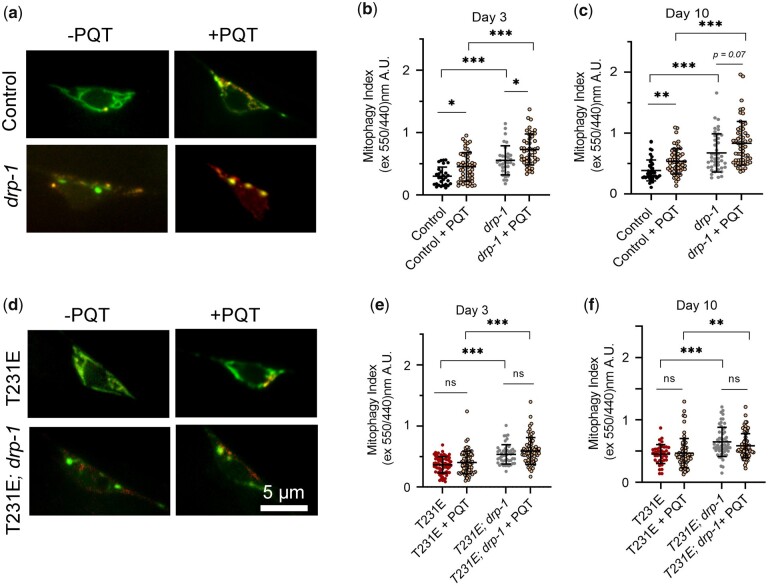
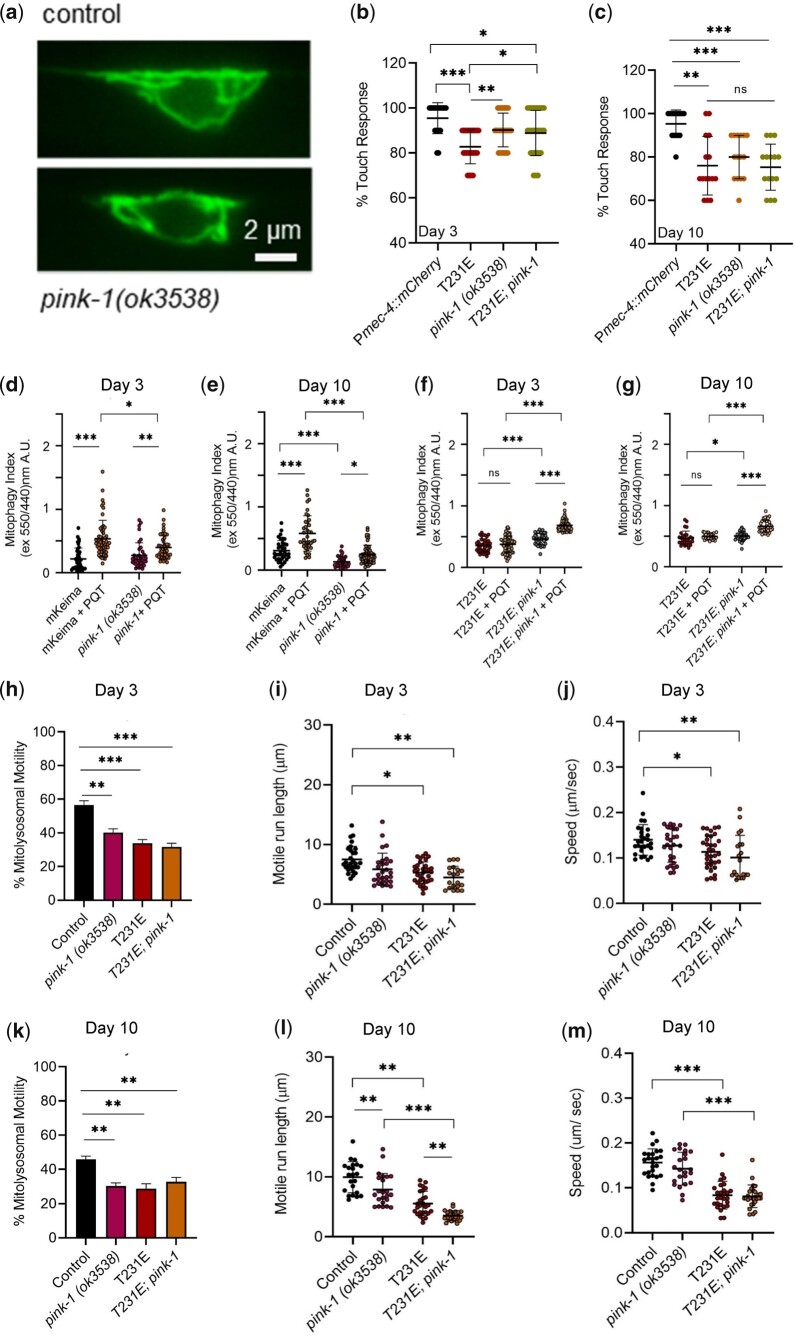
Accumulation of inappropriately phosphorylated tau into neurofibrillary tangles is a defining feature of Alzheimer's disease, with Tau pT231 being an early harbinger of tau pathology. Previously, we demonstrated that expressing a single genomic copy of human phosphomimetic mutant tau (T231E) in Caenorhabditis elegans drove age-dependent neurodegeneration. A critical finding was that T231E, unlike wild-type tau, completely and selectively suppressed oxidative stress-induced mitophagy. Here, we used dynamic imaging approaches to analyze T231E-associated changes in mitochondria and mitolysosome morphology, abundance, trafficking, and stress-induced mitophagy as a function of mitochondrial fission mediator dynamin-related protein 1, which has been demonstrated to interact with hyper phosphorylated tau and contribute to Alzheimer's disease pathogenesis, as well as Pink1, a well-recognized mediator of mitochondrial quality control that works together with Parkin to support stress-induced mitophagy. T231E impacted both mitophagy and mitolysosome neurite trafficking with exquisite selectivity, sparing macroautophagy as well as lysosome and autolysosome trafficking. Both oxidative-stress-induced mitophagy and the ability of T231E to suppress it were independent of drp-1, but at least partially dependent on pink-1. Organelle trafficking was more complicated, with drp-1 and pink-1 mutants exerting independent effects, but generally supported the idea that the mitophagy phenotype is of greater physiologic impact in T231E. Collectively, our results refine the mechanistic pathway through which T231E causes neurodegeneration, demonstrating pathologic selectivity for mutations that mimic tauopathy-associated post-translational modifications, physiologic selectivity for organelles that contain damaged mitochondria, and molecular selectivity for dynamin-related protein 1-independent, Pink1-dependent, perhaps adaptive, and mitophagy.

Keywords: Caenorhabditis elegans; Alzheimer’s disease; Drp1; Pink1; mitochondria; mitophagy; tau phosphorylation.


Figures

Fig. 1.
Fig. 1.
Mitochondrial morphology in PLM soma as a function of single-copy Tau mutants. An MLS::GFP reporter expressed via the mec-7 promoter was used to image mitochondria in the soma of PLM neurons. (a, b) Images on the left are the original fluorescent micrographs obtained from wild-type animals with mitochondrial networks that differ within the scope of our observations, representing natural variation and falling in the upper and lower quartile of the density metric, with values as shown. Images on the right represent a binary mask used to derive density. Scale bar: 5 µm. (c) Quantitative analysis of mitochondrial density at day 3 and 10 as a function of single-copy tau genotype. (d) Density as a function of 24 h treatment with 8 mM PQT starting at day 2 of adulthood. Data were collected via 3 independent biological replicates where all relevant genotypes were compared in parallel. Individual data points are values from single PLM cells from separate animals, with the mean ± SD plotted in the background (N = 33–71). Statistical analyses were 2-way ANOVA with Tukey’s multiple comparison test, with ***P < 0.001, **P < 0.01, *P < 0.05 when comparing bracketed samples.
Fig. 2.
Fig. 2.
Mitochondrial distribution and transport are reduced by pathological phosphomimetic Tau T231E. Mitochondrion were visualized through dynamic fluorescent imaging of an MLS::GFP reporter to track their movement in the PLM neuronal process of live worms. a) Representative confocal image of a PLM neurite from a wild-type worm expressing MLS::GFP. Scale bar: 20 µm. b, f) Mitochondrial motility (fraction of mitochondria that moved during imaging); c, g) intermitochondrial distance (distance between 2 consecutive mitochondria); d, h) run length (distance traversed on average by a healthy mitochondrion), and (e, i) speed, as a function of age and single-copy tau genotype. Motility metrics were limited to mitochondria that exhibited movement over the course of 5 min imaging. Two independent biological replicates were performed on different days, with all genotypes analyzed in parallel. Individual data points demarcate values from single PLM cells from separate animals, with the mean ± SD as shown (N = 20–26). Statistical analysis within day 3 and day 10 datasets was by 1-way ANOVA with Tukey’s multiple comparison test, with ***P < 0.001, **P < 0.01, *P < 0.05 when comparing bracketed samples.
Fig. 3.
Fig. 3.
Pathological phosphomimetic tau T231E reduces mitolysosome motility. Mitolysosomes (MLs) were visualized through dynamic fluorescent imaging of mito-mKeima (550-nm excitation) to track their movement in the PLM neuronal process of live worms. a) Representative confocal image of a wild-type PLM neurite expressing mito-mKeima Scale bar: 20 µm. b, c) ML motility; e, g) run length and (f, h) speed, as a function of age and single-copy tau genotype. Motility metrics were limited to MLs that exhibited movement over the course of 5 min imaging. d) Diagram showing the C. elegans touch-sensitive mechanosensory neurons, including the PLM neuronal process (demarcated by dotted lines), with kymographs of ML movement in TauT4 and T231E, as labeled. The T231E example is extreme, but not unique. Two independent biological replicates were performed on different days. Individual data points demarcate values from single PLM neurites from separate animals, with the mean ± SD as shown (N = 22–30). Statistical analysis within day 3 and 10 datasets was by 1-way ANOVA with Tukey’s multiple comparison test, with ***P < 0.001, **P< 0.01, *P < 0.05 when comparing bracketed samples.
Fig. 4.
Fig. 4.
Drp-1 has extreme effects on mitochondrial morphology and motility, but only subtle effects on touch sensitivity. Mitochondria were visualized through time-lapse fluorescent imaging of an MLS::GFP reporter to measure mitochondrial morphology in the soma and to track their movement in the PLM neuronal process of live worms. a) Representative binary images used to quantitate morphology in the genotypes indicated. Note that the mitochondria appear as blobs in the drp-1(tm1108) mutant, irrespective of the tau genotype and age. Scale bar: 5 µm. b, d) Quantitative analysis of mitochondrial density in the distal PLM cell bodies at day 3 and day 10 as a function of drp-1 and tau genotype. Control indicates data points from MLS::GFP reporter. Individual data points demarcate values from single PLM cells from separate animals (N = 30–75). c, e) Responsiveness to touch was plotted as a function of drp-1 and T231E at day 3 and 10. The data are from 3 independent biological replicates (N = 60–115). f, g) Representative confocal images of the PLM neurite from control and drp-1(tm1108) expressing MLS::GFP. Scale bar: 20 µm. Quantitative analysis of mitochondria (h, l) motility, (i, m) distribution, (j, n) run length, and (k, o) speed in distal PLM processes at day 3 or day 10 as a function of drp-1 or T231E, as indicated. Individual data points are from single PLM neurites from separate animals (N = 17–25). Data are the mean ± SD from 3 independent biological replicates. Statistical analysis for all datasets was by 1-way ANOVA with Tukey’s multiple comparison test, with ***P < 0.001, **P < 0.01, *P < 0.05 when comparing bracketed samples.
Fig. 5.
Fig. 5.
The effect of T231E on baseline mitophagy and ML motility in a drp-1(tm1108) loss-of-function mutant. Mito-mKeima was used to measure mitophagy in the PLM soma and to visualize PLM neurite ML trafficking through dynamic fluorescent imaging. Drp-1 refers to the drp-1(tm1108) allele. a, d) Dual excitation fluorescence ratio imaging was used to derive a mitophagy index as a function of age, drp-1 genotype, and T231E, as indicated. Individual data points demarcate values from single PLM cells from separate animals (N = 40–58) collected by 2 independent researchers. b, c, e–h) Quantification of ML trafficking parameters (run length, speed, and motility) in the PLM cell neurites as a function of age, drp-1 genotype, and T231E, as indicated. Individual data points demarcate average values from single PLM cells from separate animals (N = 20–29). i) Cartoon illustrating the location of mitochondria (fibrils) and MLs (circles) in a neurite process. Drp-1 loss of function severely affects mitochondrial morphology and affects mitochondrial transport. The effects of T231E are independent and additive, leading to further loss of neuronal touch sensitivity. Data are the mean ± SD from 2 biological replicates performed on different days. Statistical analysis within day 3 and 10 datasets was by 1-way ANOVA with Tukey’s multiple comparison test, with ***P < 0.001, **P < 0.01, *P < 0.05.
Fig. 6.
Fig. 6.
Oxidative-stress stimulated mitophagy and suppression by phosphomimetic Tau T231E are drp-1 independent. Mitophagy was measured using dual excitation ratio imaging of mito-mKeima expressed in C. elegans PLM neurons. Drp-1 refers to the drp-1(tm1108) allele. a, d) Representative merged images where 440-nm excitation was used to detect mitochondria (green) and 550-nm excitation was used to detect mitolysosomes (red) as a function of drp-1 genotype, T231E or 24 h PQT treatment, as indicated. Scale bar: 5 µm. b, c, e, f) Quantitative analysis of mitophagy as a function of age, drp-1 genotype, T231E or PQT. Data are the mean ± SD from 2 biological replicates performed on different days (N = 30–75). Statistical analysis was by 2-way ANOVA followed by Tukey’s post hoc test, with ***P < 0.001, **P < 0.01, *P < 0.05 denoting significance when comparing bracketed samples.
Fig. 7.
Fig. 7.
Tau T231E interacts with pink-1 to regulate mitophagy and behavior. a) Representative fluorescent images of mito-mKeima in day 3 control and pink-1(ok3538) animals. Scale bar: 2 µm. Mito-mKeima was also used to measure mitophagy in the PLM soma and to visualize PLM neurite ML trafficking through dynamic fluorescent imaging. Pink-1 refers to the ok3538 loss-of-function allele. b, c) Responsiveness to touch was plotted as a function of pink-1 and T231E at day 3 and 10 (N = 15–38 animals, touched 10 times apiece). d–g) Quantitative analysis of mitophagy using dual excitation ratio imaging of mito-mKeima as a function of age, pink-1 genotype, T231E, and PQT. Data are represented as the mean ± SD, with individual data points demarcating values from single PLM cells from separate animals (N = 30–65, from 2 biological replicates). h–m) Quantification of ML trafficking parameters (percentage motility, run length, and speed) in the distal PLM cell neurites at day 3 and 10 as a function of age, pink-1 genotype, and T231E, as indicated. Data are represented as the mean ± SD, with individual data points demarcating values from single PLM cells from separate animals (N = 21–34, from 2 biological replicates). Statistical analysis was by 1-way or 2-way ANOVA followed by Tukey’s post hoc test, with ***P < 0.001, **P < 0.01, and *P < 0.05 denoting significance when comparing bracketed samples.

Similar articles

Cited by

References

    1. Alirezaei M, Kemball CC, Flynn CT, Wood MR, Whitton JL, Kiosses WB.. Short-term fasting induces profound neuronal autophagy. Autophagy. 2010;6(6):702–710. - PMC - PubMed
    1. Alonso AD, Di Clerico J, Li B, Corbo CP, Alaniz ME, Grundke-Iqbal I, Iqbal K.. Phosphorylation of tau at Thr212, Thr231, and Ser262 combined causes neurodegeneration. J Biol Chem. 2010;285(40):30851–30860. - PMC - PubMed
    1. Alquezar C, Arya S, Kao AW.. Tau post-translational modifications: dynamic transformers of tau function, degradation, and aggregation. Front Neurol. 2020;11:595532. - PMC - PubMed
    1. Aragão Gomes L, Uytterhoeven V, Lopez-Sanmartin D, Tomé SO, Tousseyn T, Vandenberghe R, Vandenbulcke M, von Arnim CAF, Verstreken P, Thal DR, et al.Maturation of neuronal AD-tau pathology involves site-specific phosphorylation of cytoplasmic and synaptic tau preceding conformational change and fibril formation. Acta Neuropathol. 2021;141(2):173–192. - PubMed
    1. Arnsten AFT, Datta D, Del Tredici K, Braak H.. Hypothesis: tau pathology is an initiating factor in sporadic Alzheimer's disease. Alzheimers Dement. 2021;17(1):115–124. - PMC - PubMed

Publication types