

Longitudinal monitoring of BKPyV miRNA levels in kidney transplant recipients with BKPyV-related pathology reflects viral DNA levels and remain high in viremia patients after clearance of viral DNA
- PMID: 35916729
- PMCID: PMC10077896
- DOI: 10.1111/tid.13927
Longitudinal monitoring of BKPyV miRNA levels in kidney transplant recipients with BKPyV-related pathology reflects viral DNA levels and remain high in viremia patients after clearance of viral DNA
Abstract
Introduction: It is unclear whether polyomavirus BK (BKPyV) microribonucleic acid (miRNA) measurement has additional diagnostic and predictive value in kidney transplant recipients (KTR) as compared to current methods of monitoring BKPyV DNA loads.
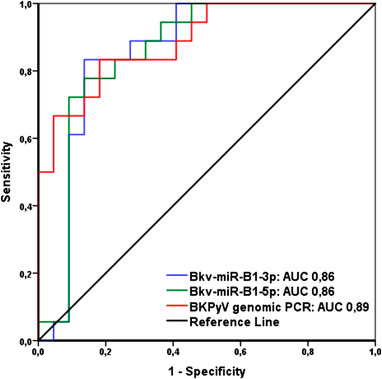
Patients and methods: A retrospective, longitudinal study was performed in 30 KTR with BKPyV viruria (n = 10), BKPyV viremia (n = 10), or BKPyV-associated neuropathy (BKPyVAN) (n = 10). Bkv-miR-B1-3p and 5p and BKPyV DNA load were measured in urine and plasma and compared using receiver operating characteristic (ROC) curves.
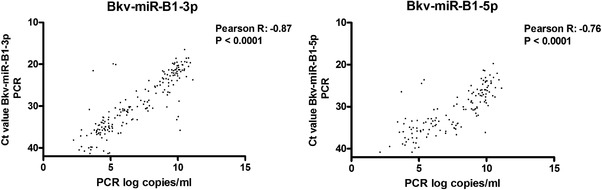
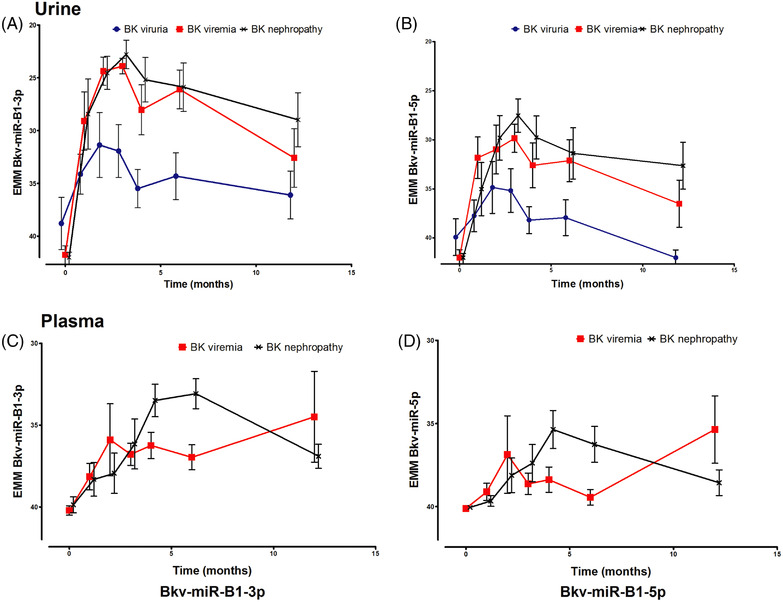
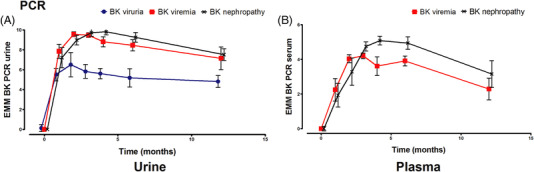
Results: Levels of Bkv-miR-B1-3p and 5p and BKPyV DNA correlated strongly. Overall, mostly analog courses of urinary and plasma miRNA and DNA loads were observed. Areas under the ROC curves were not significantly different between miRNAs and DNA. Only, in contrast to BKPyV DNA load, BKPyV miRNA levels increased from 6 to 12 months in the viremia group, while in the BKPyVAN group, a decline was seen in both DNA and miRNA.
Conclusions: In this study, we could not demonstrate an additional value of BKPyV miRNA detection compared to BKPyV DNA monitoring in the early phase after kidney transplantation. We did observe significant differences between the viremia and the BKPyVAN groups during follow-up. This study was performed with a small number of patients and therefore results should be verified in a larger patient cohort. Furthermore, future studies with larger patient groups are necessary to elucidate final clinical value of these data.
Keywords: BK virus nephropathy; BKPyV; kidney transplantation; longitudinal; marker; miRNA.
© 2022 The Authors. Transplant Infectious Disease published by Wiley Periodicals LLC.
Conflict of interest statement
The authors declare they have no conflicts of interest.
Figures
Similar articles
-
Urine Donor-Derived Cell-Free DNA Helps Discriminate BK Polyomavirus-Associated Nephropathy in Kidney Transplant Recipients With BK Polyomavirus Infection.Front Immunol. 2020 Aug 19;11:1763. doi: 10.3389/fimmu.2020.01763. eCollection 2020. Front Immunol. 2020. PMID: 32973745 Free PMC article.
-
BK Polyomavirus Micro-RNAs: Time Course and Clinical Relevance in Kidney Transplant Recipients.Viruses. 2021 Feb 23;13(2):351. doi: 10.3390/v13020351. Viruses. 2021. PMID: 33672313 Free PMC article.
-
Pretransplantation Donor-Recipient Pair Seroreactivity Against BK Polyomavirus Predicts Viremia and Nephropathy After Kidney Transplantation.Am J Transplant. 2017 Jan;17(1):161-172. doi: 10.1111/ajt.13880. Epub 2016 Jul 8. Am J Transplant. 2017. PMID: 27251361
-
Risk factors for BK virus viremia and nephropathy after kidney transplantation: A systematic review.J Clin Virol. 2018 Dec;109:6-12. doi: 10.1016/j.jcv.2018.10.002. Epub 2018 Oct 12. J Clin Virol. 2018. PMID: 30343190
-
Host and viral RNA dysregulation during BK polyomavirus infection in kidney transplant recipients.Wiley Interdiscip Rev RNA. 2023 Jul-Aug;14(4):e1769. doi: 10.1002/wrna.1769. Epub 2022 Dec 5. Wiley Interdiscip Rev RNA. 2023. PMID: 36470265 Review.
Cited by
-
Urine Exosomal bkv-miR-B1-5p and BK Virus Nephropathy in Kidney Transplant Recipients.J Infect Dis. 2023 May 12;227(10):1185-1193. doi: 10.1093/infdis/jiac440. J Infect Dis. 2023. PMID: 36374933 Free PMC article. Clinical Trial.
References
-
- Winter J, Jung S, Keller S, Gregory RI, Diederichs S. Many roads to maturity: microRNA biogenesis pathways and their regulation. Nat Cell Biol. 2009;11(3):228‐234. - PubMed
-
- Hu JH, Zhao H, Huang YP, et al. Opportunistic posttransplantation virus infections in renal transplant recipients. Transplant Proc. 2011;43(10):3715‐3719. - PubMed
-
- Sawinski D, Goral S. BK virus infection: an update on diagnosis and treatment. Nephrol Dial Transplant. 2015;30(2):209‐217. - PubMed
MeSH terms
Substances
LinkOut - more resources
Full Text Sources
Medical
