. 2022 Oct 27;34(11):4329-4347.
doi: 10.1093/plcell/koac234.

Loss-of-function of SAWTOOTH 1 affects leaf dorsiventrality genes to promote leafy heads in lettuce

Affiliations

Loss-of-function of SAWTOOTH 1 affects leaf dorsiventrality genes to promote leafy heads in lettuce

Guanghui An et al. Plant Cell. .

Abstract

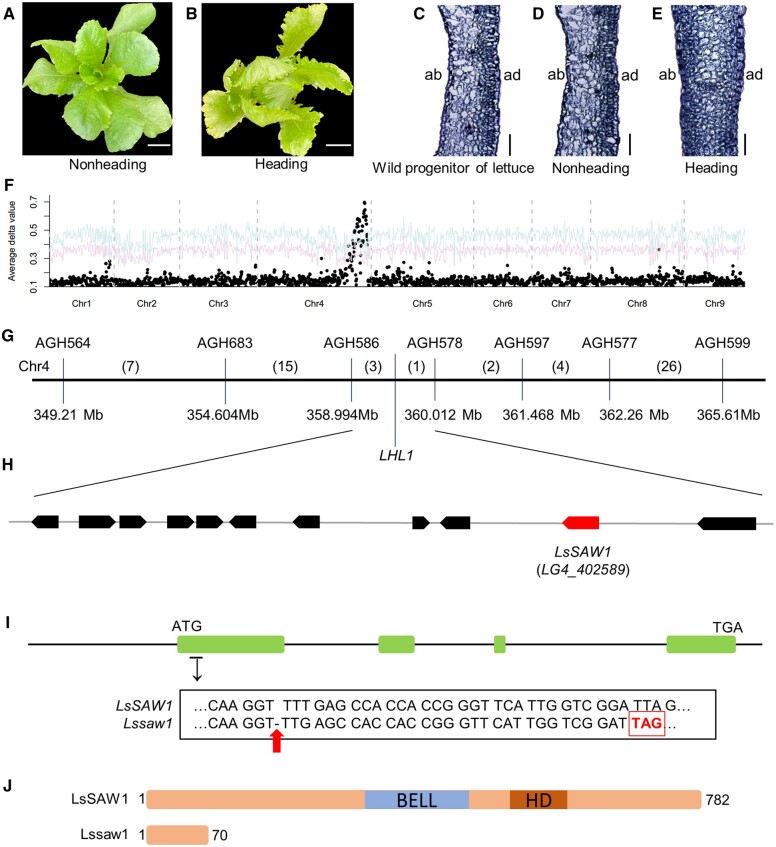
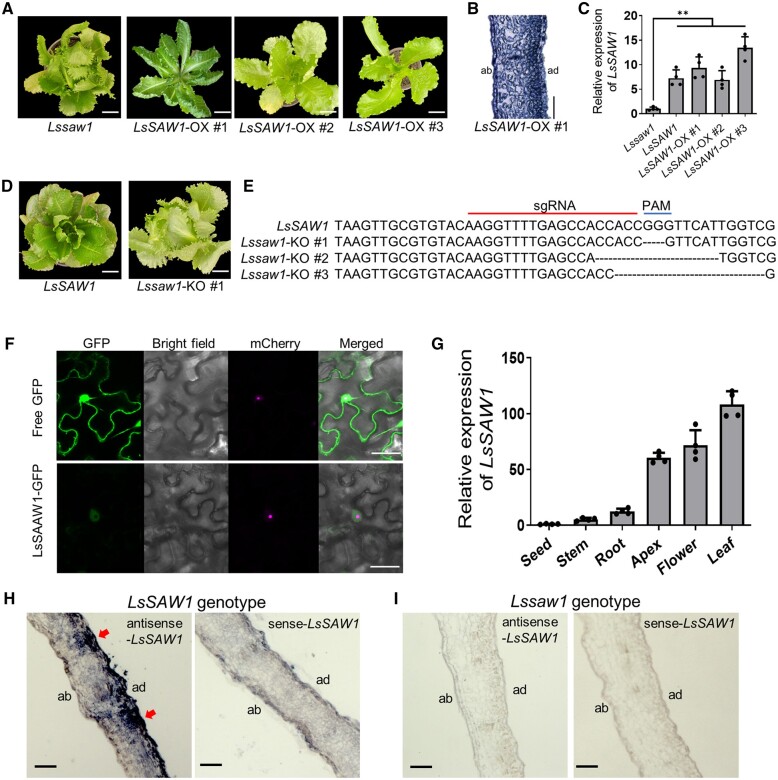
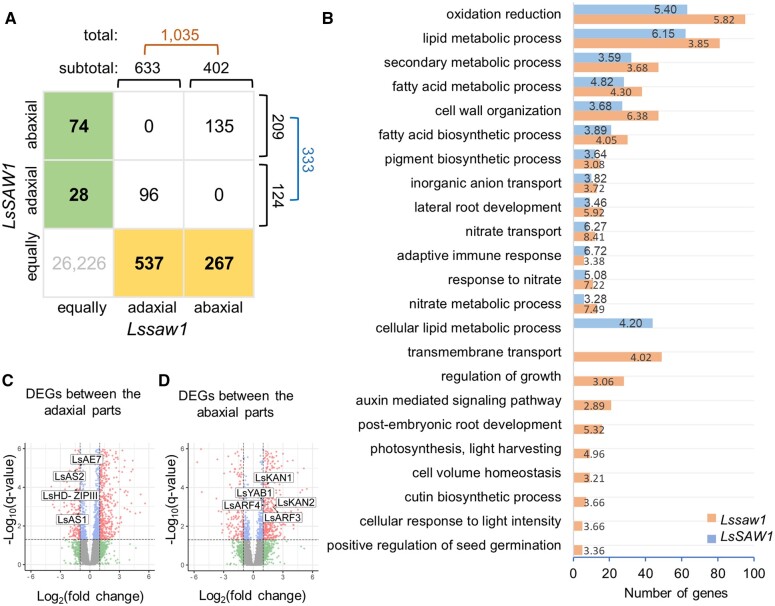
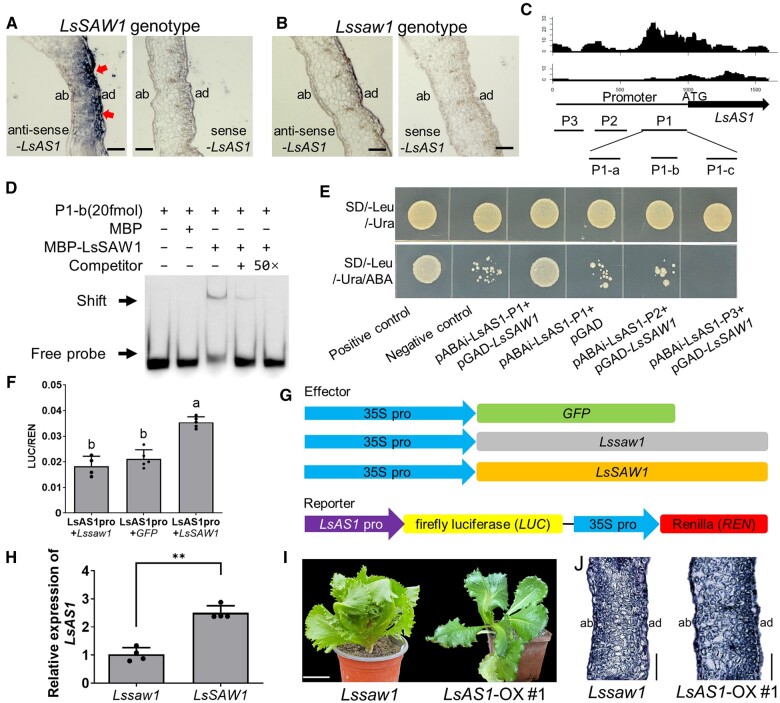
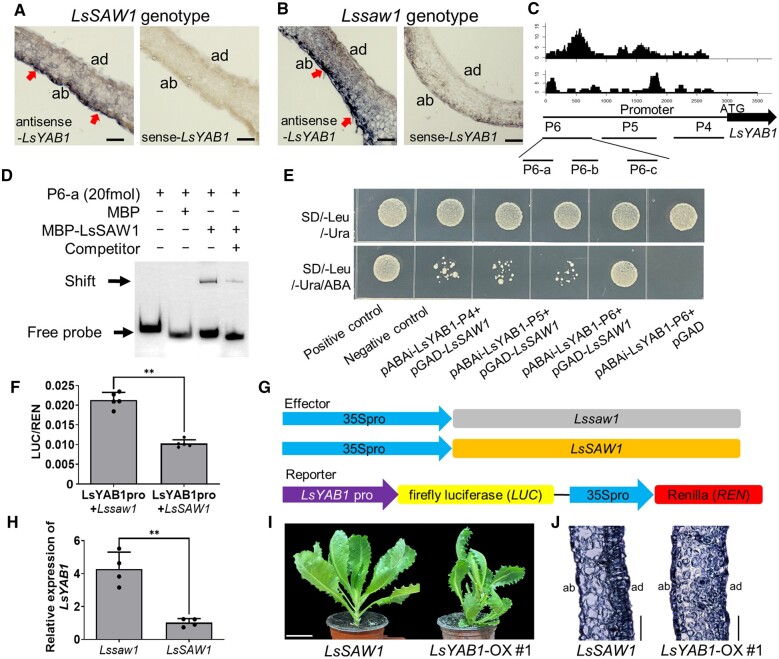
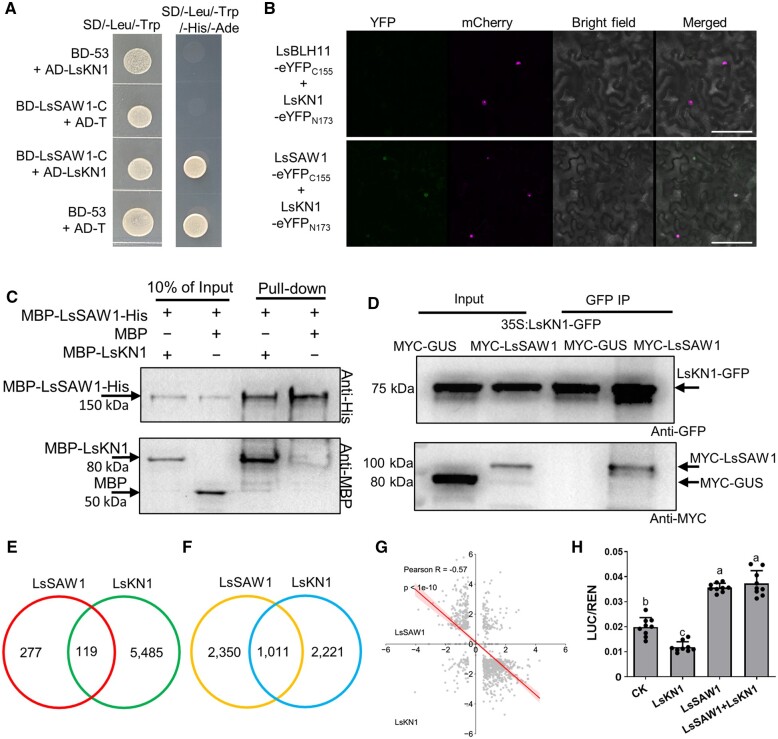
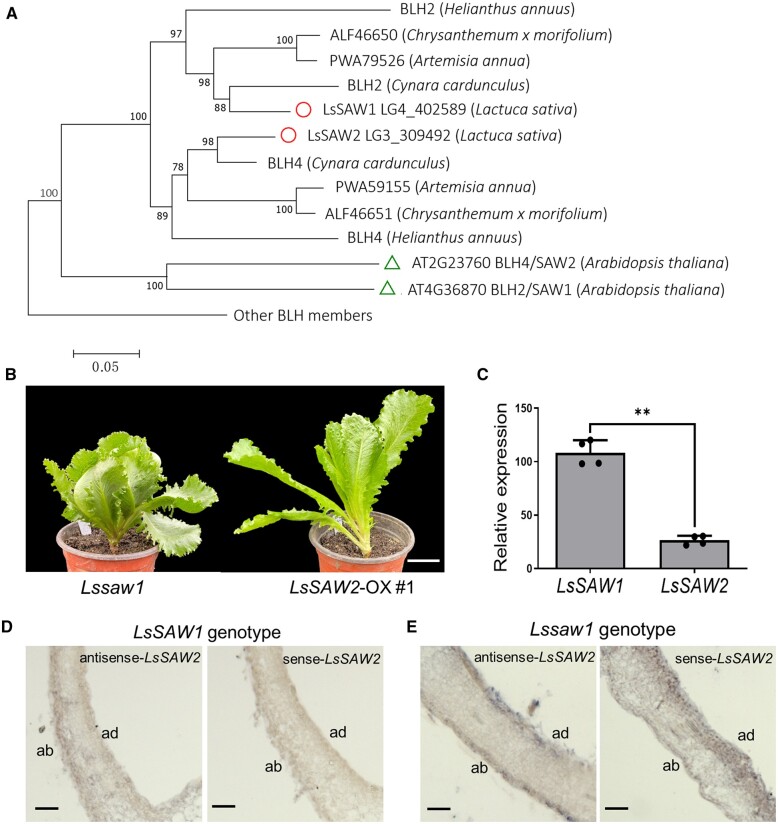
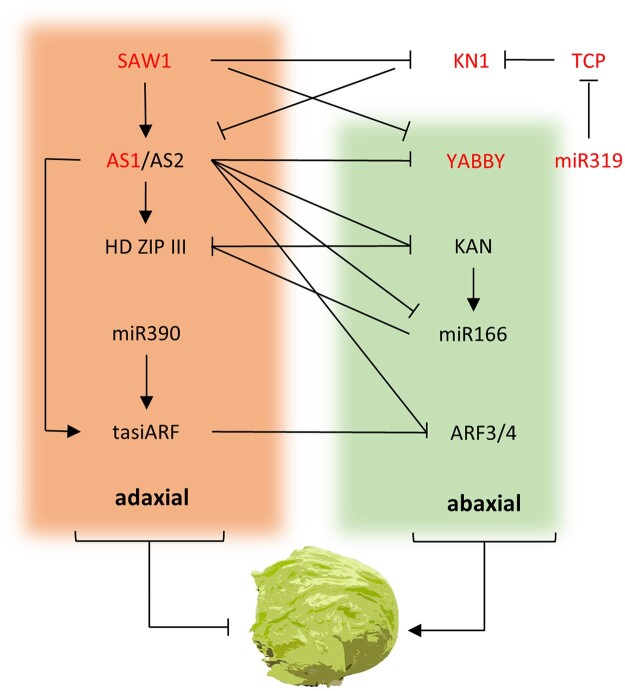
The mechanisms underlying leafy heads in vegetables are poorly understood. Here, we cloned a quantitative trait locus (QTL) controlling leafy heads in lettuce (Lactuca sativa). The QTL encodes a transcription factor, SAWTOOTH 1 (LsSAW1), which has a BEL1-like homeodomain and is a homolog of Arabidopsis thaliana. A 1-bp deletion in Lssaw1 contributes to the development of leafy heads. Laser-capture microdissection and RNA-sequencing showed that LsSAW1 regulates leaf dorsiventrality and loss-of-function of Lssaw1 downregulates the expression of many adaxial genes but upregulates abaxial genes. LsSAW1 binds to the promoter region of the adaxial gene ASYMMETRIC LEAVES 1 (LsAS1) to upregulate its expression. Overexpression of LsAS1 compromised the effects of Lssaw1 on heading. LsSAW1 also binds to the promoter region of the abaxial gene YABBY 1 (LsYAB1), but downregulates its expression. Overexpression of LsYAB1 led to bending leaves in LsSAW1 genotypes. LsSAW1 directly interacts with KNOTTED 1 (LsKN1), which is necessary for leafy heads in lettuce. RNA-seq data showed that LsSAW1 and LsKN1 exert antagonistic effects on the expression of thousands of genes. LsSAW1 compromises the ability of LsKN1 to repress LsAS1. Our results suggest that downregulation or loss-of-function of adaxial genes and upregulation of abaxial genes allow for the development of leafy heads.


Figures

Figure 1
Figure 1
Phenotypes of heading and nonheading individuals from the F5 segregating family and genetic mapping of the LHL1 gene. A and B, A nonheading (A) and a heading (B) individual from an F5 segregating family viewed from above. Bar = 5 cm. C–E, Cross-sections of leaves from the wild progenitor of lettuce (C), a nonheading individual (D), and a heading individual (E). “ab” and “ad” represent abaxial and adaxial parts of the leaves, respectively. Bar = 50 μm. F, BSR-seq of the F5 segregating family showed a single locus on Chromosome 4 controlling heading. The Δvalue (y-axis) was plotted along the nine chromosomes of lettuce (x-axis). The red and green curves refer to a confidence interval of P = 0.05 and P = 0.01, respectively. G, Genetic mapping of the LHL1 locus. The numbers in the parentheses refer to the number of recombinants between two neighboring markers from 1,232 progenies. H, Eleven ORFs are present in the candidate interval, including LsSAW1 (in red). I, Sequence variation between LsSAW1 and Lssaw1, from the nonheading and heading parents, respectively. The 1-bp deletion in Lssaw1 from the heading parent is indicated by an arrow. The premature stop codon is indicated by a box. J, The allele LsSAW1 from the nonheading parent encodes a protein (782 amino acids) which contains the BELL domain (BELL) and homeobox domain (HD). The allele Lssaw1 from the heading parent encodes a truncated protein which lacks the BELL and HD domains.
Figure 2
Figure 2
Functional verification of the effect of the LsSAW1 gene on leafy heads and the expression pattern of the LsSAW1 gene in lettuce. A, OX the LsSAW1 gene converted the phenotype from heading (left) to nonheading. Bar = 5 cm. B, Cross-section of leaves from LsSAW1-OX plants. Bar = 50 μm. C, Expression of LsSAW1 in leaves of three LsSAW1-OX lines and the heading Lssaw1 genotype. Data represent means ± sd of four biological replicates. Asterisks denote significant differences based on a one-way ANOVA (** for P < 0.01). D, Knockout of the LsSAW1 gene converted the phenotype from nonheading (left) to heading (right). Bar = 5 cm. E, Modified sequences of Lssaw1 in the three knockout mutants. F, Subcellular localization of LsSAW1 in N. benthamiana leaf cells viewed under confocal laser scanning microscopy. The empty GFP vector was used as a control. Three biological replicates (approximately 100 nuclei for each replicate) were observed and fluorescence was detected in 70% of nuclei. Bars = 25 μm. mCherry represents the marker with fluorescence localized in the nucleus. G, Relative transcript level of LsSAW1 in different tissues from lettuce. H and I, In situ hybridization of LsSAW1 transcripts in the nonheading LsSAW1 genotype (H) and heading Lssaw1 genotype (I). The arrowheads indicate expression atlas of LsSAW1. The left panel is for the antisense probe and the right panel is for the sense probe. Bars = 50 μm. “ab” and “ad” represent abaxial and adaxial parts of leaves, respectively.
Figure 3
Figure 3
Loss-of-function of LsSAW1 led to the downregulation of adaxial genes and upregulation of abaxial genes. A, DEGs between abaxial or adaxial parts of leaves from Lssaw1 (heading) and LsSAW1 (nonheading) plants. “Equally” refers to no expression difference between adaxial and abaxial parts. “Adaxial” refers to predominantly expressed in adaxial parts of leaves. “Abaxial” refers to predominantly expressed in abaxial parts of leaves. B, GO enrichment analysis of DEGs. Functional enrichment was determined for the GO terms in the “biological process” category. Numbers on the bar graph represent the −log10(P-value). C, Volcano plot of DEGs between the adaxial parts from Lssaw1 and LsSAW1 plants. The red dot represents DEGs with a |log2(fold change)| ≥ 1, q-value ≤ 0.05; the blue dot represents DEGs with a |log2(fold change)| ≤ 1, q-value ≤ 0.05; the green dot represents DEGs with a |log2(fold change)| ≥ 1, q-value ≥ 0.05; the gray color indicates DEGs with no significant difference. D, Volcano plot of DEGs between the abaxial parts from Lssaw1 and LsSAW1 plants. See (C) for details.
Figure 4
Figure 4
Lssaw1 downregulates the expression of LsAS1 to promote the development of leafy heads. A and B, In situ hybridization of LsAS1 transcripts in the LsSAW1 nonheading plant (A) and Lssaw1 heading plant (B). The arrowheads indicate expression atlas of LsAS1. The left panel shows the antisense probe and the right panel shows the sense probe. Bars = 50 μm. “ab” and “ad” indicate abaxial and adaxial parts of leaves, respectively. C, Preliminary data from ChIP-seq analysis suggested LsAS1 as a potential direct target of LsSAW1. The y-axis shows the number of reads in ChIP-seq and the x-axis shows the positions of the reads relative to the target gene. ATG represents the start codon. P1 (−8 to −401), P2 (−463 to −742), and P3 (−966 to −1,217) indicate the DNA fragments used as baits in the Y1H assay. P1-a (−8 to −66), P1-b (−157 to −215), and P1-c (−241 to −299) are the DNA fragments used as probes in EMSA. D, EMSA shows that LsSAW1 directly binds to the P1-b fragment of the LsAS1 promoter. E, Y1H assay. Transformant yeasts were grown on the SD/-Leu/-Ura medium and the SD/-Leu/-Ura/ABA medium (300 ng/mL aureobasidin). Negative control refers to transformants of p53-AbAi and pGADT7; positive control refers to transformants of p53-AbAi and pGADT7-p53. F, Dual luciferase assay suggests that LsSAW1 upregulates LsAS1. Data represent means ± sd of five biological replicates. Means with different letters refer to significant difference based on one-way ANOVA followed by Tukey’s multiple comparison test (P < 0.05). G, Schematic representation of effector and reporter constructs for dual luciferase transient expression assays. The LUC gene was driven by the promoters of LsAS1. H, RT-qPCR shows the expression level of LsAS1 in LsSAW1 and Lssaw1 plants. Data represent means ± sd of four biological replicates. Asterisks denote significant differences based on Student’s t test (** for P < 0.01). I, Phenotypes of the Lssaw1 and LsAS1-OX #1 plants. Bar = 5 cm. J, Cross-sections of leaves from the Lssaw1 and LsAS1-OX #1 plants. Bars = 50 μm.
Figure 5
Figure 5
Lssaw1 upregulates the expression of LsYAB1 to promote the development of leafy heads. A and B, In situ hybridization of LsYAB1 transcripts in the LsSAW1 nonheading plant (A) and Lssaw1 heading plant (B). The arrowheads indicate expression atlas of LsYAB1. The left panel shows the antisense probe and the right panel shows the sense probe. Bars = 50 μm. “ab” and “ad” represent abaxial and adaxial parts of leaves, respectively. C, Preliminary data from ChIP-seq analysis suggested LsYAB1 as a potential direct target of LsSAW1. The y-axis shows the number of reads in ChIP-seq and the x-axis shows positions of the reads relative to the target gene. Only part of the gene is shown and the ATG represents the start codon. P4 (−93 to −703), P5 (−1,207 to −1,791), and P6 (−2,286 to −2,960) indicate the DNA fragments used as baits in the Y1H assay. P6-a (−2,354 to −2,412), P6-b (−2,701 to −2,759), and P6-c (−2,862 to −2,920) are the DNA fragments used as probes in EMSA. D, EMSA shows that LsSAW1 directly binds to the P6-a fragment of the LsYAB1 promoter. E, Y1H assay. Transformant yeasts were grown on the SD/-Leu/-Ura medium and the SD/-Leu/-Ura/ABA medium (300 ng/mL aureobasidin). Negative control refers to transformants of p53-AbAi and pGADT7; positive control refers to transformants of p53-AbAi and pGADT7-p53. F, Dual luciferase assay suggests that LsSAW1 downregulates LsYAB1. Data represent means ± sd of five biological replicates. Asterisks denote significant differences based on Student’s t test (** for P < 0.01). G, Schematic representation of effector and reporter constructs for dual luciferase transient expression assays. The LUC gene was driven by the promoters of LsYAB1. H, RT-qPCR shows the expression level of LsYAB1 in LsSAW1 and Lssaw1 plants. Data represent means ± sd of four biological replicates. Asterisks denote significant differences based on Student’s t test (** for P < 0.01). I, Phenotypes of the LsSAW1 and LsYAB1-OX #1 plants. Bar = 5 cm. J, Cross-sections of leaves from the LsSAW1 and LsYAB1-OX #1 plants. Bars = 50 μm.
Figure 6
Figure 6
LsSAW1 interacts with LsKN1 and compromises its suppression effects on the LsAS1 gene. A, Yeast two-hybrid shows the interaction between LsSAW1 and LsKN1. B, BiFC in N. benthamiana leaves shows LsSAW1 interacting with LsKN1. Three biological replicates (approximately 100 nuclei for each replicate) were observed and fluorescence was detected in 50% of nuclei. Bars = 200 μm. mCherry represents the marker with fluorescence localized in the nucleus. eYFPN173, the N-terminal 1–173 amino acids of eYFP. eYFPC155, the C-terminal 156–239 amino acids of eYFP. LsBLH11-eYFPC155 + LsKN1-eYFPN173 as a negative control. C, Pull-down shows the interaction between LsSAW1 and LsKN1. D, Co-IP shows the interaction between LsSAW1 and LsKN1. E, Venn diagram showing the potential shared targets between LsSAW1 and LsKN1 according to the preliminary data from ChIP-seq analysis of LsSAW1 and the potential targets of LsKN1. F, Venn diagram of DEGs of near iso-genic lines of LsSAW1 and LsKN1. G, Dot plot of GFOLD of the shared DEGs of near isogenic lines of LsSAW1 and LsKN1. (Pearson R = −0.57; P < 1 × 10⁻¹⁰). H, LsSAW1 compromises the suppression effects of LsKN1 on the LsAS1 gene. The LUC gene is driven by the promoter of LsAS1. Data represent means ± sd of eight biological replicates. Means with different letters refer to significant difference based on one-way ANOVA followed by Tukey’s multiple comparison test (P < 0.05).
Figure 7
Figure 7
LsSAW2 has low expression and OX LsSAW2 rescues the heading phenotype. A, NJ phylogenetic tree using amino acid sequences of BLH proteins. Only the SAW clade is shown. LsSAW1 and LsSAW2 from lettuce are indicated with circles, and SAW1 and SAW2 from Arabidopsis are indicated with triangles. Numbers on nodes refer to the bootstrap value. The bar represents substitution per site. B, Phenotypes of the Lssaw1 and LsSAW2-OX #1 plants. Bar = 5 cm. C, Relative expression of LsSAW1 and LsSAW2 in lettuce leaves. Data represent means ± sd of four biological replicates. Asterisks denote significant differences based on Student’s t test (** for P < 0.01). D and E, In situ hybridization of LsSAW2 transcripts in the LsSAW1 nonheading plant (D) and Lssaw1 heading plant (E). The left panel shows the antisense probe and the right panel shows the sense probe. The LsSAW2 gene is almost undetectable. Bars = 50 μm. “ab” and “ad” represent abaxial and adaxial parts of leaves, respectively.
Figure 8
Figure 8
The adaxial–abaxial polarity network regulates leafy heads in lettuce. LsSAW1 and LsKN1 are involved in the core adaxial–abaxial polarity network. LsSAW1 is a transcriptional activator for the adaxial gene LsAS1 and a transcriptional repressor for the abaxial gene LsYAB1. LsSAW1 changes the regulation pattern of LsKN1 through physical interactions. Arrows and T bars represent promoting and repressing, respectively. Genes in red have been experimentally shown to contribute to leafy heads in vegetable crops.
Figure 9
Figure 9
Expression patterns of LsAS2 and LsKAN1 in LsSAW1 and Lssaw1 plants. A and B, In situ hybridization of LsAS2 transcripts in the nonheading LsSAW1 genotype (A) and heading Lssaw1 genotype (B). C and D, In situ hybridization of LsKAN1 transcripts in the nonheading LsSAW1 genotype (C) and heading Lssaw1 genotype (D). The left panel is for the antisense probe and the right panel is for the sense probe. Bars = 50 μm. “ab” and “ad” represent abaxial and adaxial parts of leaves, respectively.

Similar articles

Cited by

References

    1. Adhikari ND, Simko I, Mou B (2019) Phenomic and physiological analysis of salinity effects on lettuce. Sensors (Basel) 19: 4814 - PMC - PubMed
    1. Alconero R (1988) Lettuce (Lactuca sativa L.).In YPS Bajaj, eds, Crops II. Springer, Berlin, Heidelberg, pp 351–369
    1. Bhatt AM, Etchells JP, Canales C, Lagodienko A, Dickinson H (2004) VAAMANA—a BEL1-like homeodomain protein, interacts with KNOX proteins BP and STM and regulates inflorescence stem growth in Arabidopsis. Gene 328: 103–111 - PubMed
    1. Burglin TR (1997) Analysis of TALE superclass homeobox genes (MEIS, PBC, KNOX, Iroquois, TGIF) reveals a novel domain conserved between plants and animals. Nucleic Acids Res 25: 4173–4180 - PMC - PubMed
    1. Cheng F, Sun R, Hou X, Zheng H, Zhang F, Zhang Y, Liu B, Liang J, Zhuang M, Liu Y, et al. (2016) Subgenome parallel selection is associated with morphotype diversification and convergent crop domestication in Brassica rapa and Brassica oleracea. Nat Genet 48: 1218–1224 - PubMed

Publication types

MeSH terms

LinkOut - more resources