

A novel diagnostic model for insulinoma
- PMID: 35916979
- PMCID: PMC9346017
- DOI: 10.1007/s12672-022-00534-w
A novel diagnostic model for insulinoma
Abstract
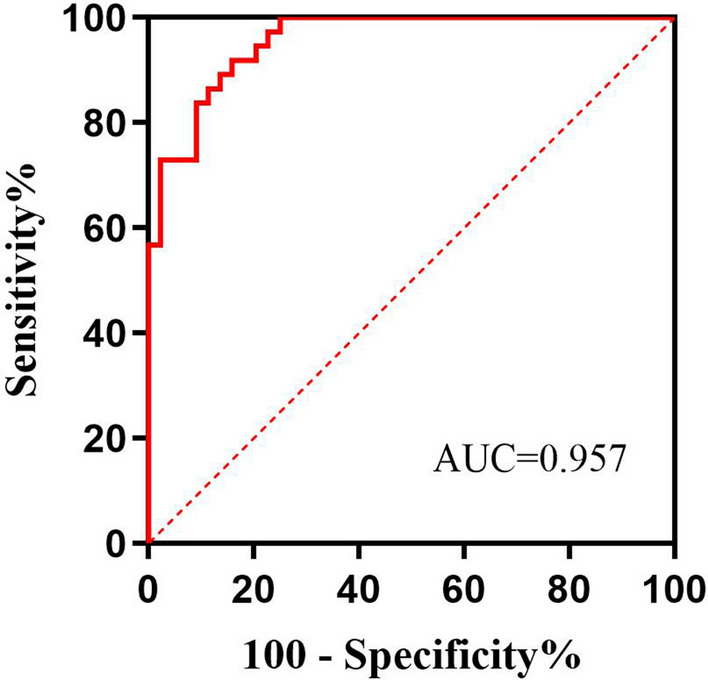
The aim is to describe a simple and feasible model for the diagnosis of insulinoma. This retrospective study enrolled 37 patients with insulinoma and 44 patients with hypoglycemia not due to insulinoma at the First Affiliated Hospital of Guangxi Medical University. General demographic and clinical characteristics; hemoglobin A1c (HbA1c), insulin and C-peptide concentrations; and the results of 2-h oral glucose tolerance tests (OGTT) were recorded, and a logistic regression model predictive of insulinoma was determined. Body mass index (BMI), HbA1c concentration, 0-h C-peptide concentration, and 0-h and 1-h plasma glucose concentrations (P < 0.05 each) were independently associated with insulinoma. A regression prediction model was established through multivariate logistics regression analysis: Logit p = 7.399+(0.310 × BMI) - (1.851 × HbA1c) - (1.467 × 0-h plasma glucose) + (1.963 × 0-h C-peptide) - (0.612 × 1-h plasma glucose). Using this index to draw a receiver operating characteristic (ROC) curve, the area under the curve (AUC) was found to be 0.957. The optimal cut-off value was - 0.17, which had a sensitivity of 89.2% and a specificity of 86.4%. Logit P ≥ - 0.17 can be used as a diagnostic marker for predicting insulinoma in patients with hypoglycemia.
Keywords: Diagnostic predictive model; Hypoglycemia; Insulinoma.
© 2022. The Author(s).
Conflict of interest statement
The authors declare that there are no conflicts of interest regarding the publication of this paper.
Figures

Similar articles
-
Using the Secretion Ratios of Insulin and C-peptide During the 2-h Oral Glucose Tolerance Test to Diagnose Insulinoma.Dig Dis Sci. 2021 May;66(5):1533-1539. doi: 10.1007/s10620-020-06379-z. Epub 2020 Jun 11. Dig Dis Sci. 2021. PMID: 32529519
-
Diagnosis of insulinoma using the ratios of serum concentrations of insulin and C-peptide to glucose during a 5-hour oral glucose tolerance test.Endocr J. 2017 Jan 30;64(1):49-57. doi: 10.1507/endocrj.EJ16-0292. Epub 2016 Oct 1. Endocr J. 2017. PMID: 27725372
-
[Diagnostic value of parameters of glucose metabolism as screening tests for insulinoma].Zhonghua Yi Xue Za Zhi. 2010 Apr 27;90(16):1093-6. Zhonghua Yi Xue Za Zhi. 2010. PMID: 20646424 Chinese.
-
Clinical implications of various criteria for the biochemical diagnosis of insulinoma.Endocrinol Metab (Seoul). 2014 Dec 29;29(4):498-504. doi: 10.3803/EnM.2014.29.4.498. Epub 2014 Jul 2. Endocrinol Metab (Seoul). 2014. PMID: 25325272 Free PMC article.
-
Characteristics of glucose metabolism indexes and continuous glucose monitoring system (CGMS) in patients with insulinoma.Diabetol Metab Syndr. 2017 Mar 14;9:17. doi: 10.1186/s13098-017-0215-3. eCollection 2017. Diabetol Metab Syndr. 2017. PMID: 28293303 Free PMC article.
Cited by
-
Diagnostic Risk Prediction Models for Upper Gastrointestinal Cancers: A Systematic Review.Cancer Epidemiol Biomarkers Prev. 2025 Aug 1;34(8):1240-1251. doi: 10.1158/1055-9965.EPI-24-1714. Cancer Epidemiol Biomarkers Prev. 2025. PMID: 40402037 Free PMC article.
-
Searching for New Biomarkers of Neuroendocrine Tumors: A Comparative Analysis of Chromogranin A and Inflammatory Cytokines in Patients with Neuroendocrine Tumors.Curr Oncol. 2024 Oct 12;31(10):6110-6132. doi: 10.3390/curroncol31100456. Curr Oncol. 2024. PMID: 39451760 Free PMC article.
References
Grants and funding
LinkOut - more resources
Full Text Sources