Review
. 2022 Aug 2;14(1):158.
doi: 10.1007/s40820-022-00908-3.

Quantum Dots Compete at the Acme of MXene Family for the Optimal Catalysis

Affiliations
Review

Quantum Dots Compete at the Acme of MXene Family for the Optimal Catalysis

Yuhua Liu et al. Nanomicro Lett. .

Abstract

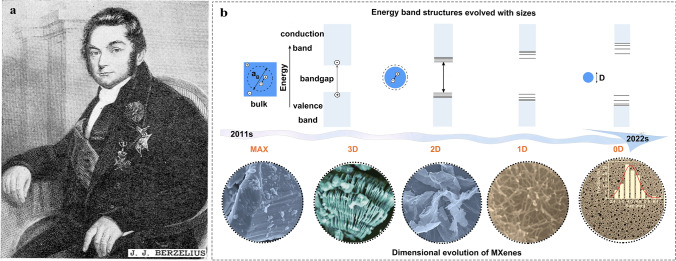
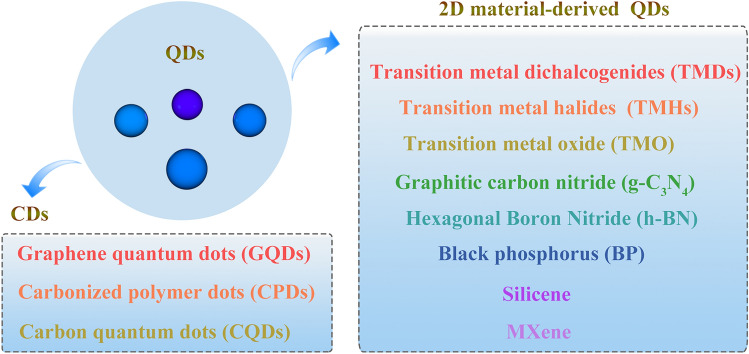
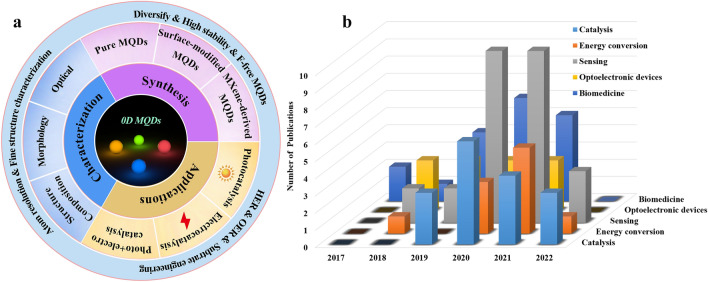
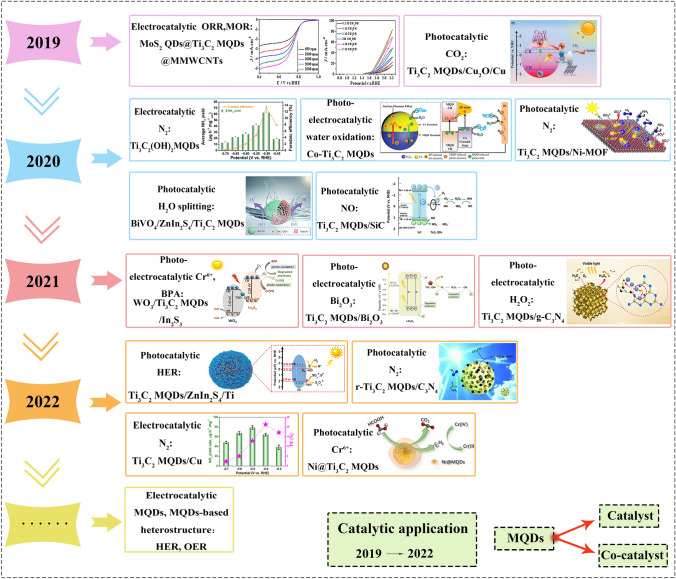
It is well known that two-dimensional (2D) MXene-derived quantum dots (MQDs) inherit the excellent physicochemical properties of the parental MXenes, as a Chinese proverb says, "Indigo blue is extracted from the indigo plant, but is bluer than the plant it comes from." Therefore, 0D QDs harvest larger surface-to-volume ratio, outstanding optical properties, and vigorous quantum confinement effect. Currently, MQDs trigger enormous research enthusiasm as an emerging star of functional materials applied to physics, chemistry, biology, energy conversion, and storage. Since the surface properties of small-sized MQDs include the type of surface functional groups, the functionalized surface directly determines their performance. As the Nobel Laureate Wolfgang Pauli says, "God made the bulk, but the surface was invented by the devil," and it is just on the basis of the abundant surface functional groups, there is lots of space to be thereof excavated from MQDs. We are witnessing such excellence and even more promising to be expected. Nowadays, MQDs have been widely applied to catalysis, whereas the related reviews are rarely reported. Herein, we provide a state-of-the-art overview of MQDs in catalysis over the past five years, ranging from the origin and development of MQDs, synthetic routes of MQDs, and functionalized MQDs to advanced characterization techniques. To explore the diversity of catalytic application and perspectives of MQDs, our review will stimulate more efforts toward the synthesis of optimal MQDs and thereof designing high-performance MQDs-based catalysts.

Keywords: Catalysis; MXene; Quantum dots; Structure; Surface groups.


Figures

Fig. 1
Fig. 1
a Jöns Jacob Berzelius (1779–1848) [1]. Copyright @1948, American Chemical Society. b Schematic illustration of the energy band structure of materials with different sizes, and typical images of MAX and MXene from 3D multilayer to 2D nanosheets to 1D nanowires to 0D nanodots [6]. Copyright @2021, The American Association for the Advancement of Science. The morphology was obtained by field emission scanning electron microscopy [–10], Copyright @2011, WILEY–VCH, @2019, WILEY–VCH, @2018, Elsevier and @2018, American Chemical Society
Fig. 2
Fig. 2
The classification of quantum dots
Fig. 3
Fig. 3
a State of the art and prospect of 0D MQDs. b Number of journal publications related to publication time and applications science 2017 (Source: Web of Science)
Fig. 4
Fig. 4
The timeline showing the development of MQDs in catalysis in the past few years. Reproduced with permission from Refs. [–79]. Copyright @2019, Elsevier, @2019, WILEY–VCH, @2020, Elsevier, @2020, American Chemcial Society, @2020, WILEY–VCH, @2020, American Chemical Society, @2020, WILEY–VCH, @2021, American Chemical Society, @2021, Elsevier, @2021, Elsevier, @2022, The Royal Society of Chemistry, @2022, Elsevier, @2022. MDPI and the author, @2022, Zhengzhou University and Wiley
Fig. 5
Fig. 5
Development of synthesis methods and synthesis of MQDs. a Number of synthesis methods publications on MQDs. (Source: Web of science, 2017 to 2022s). b Scheme of hydrothermal synthesis method [107]. Copyright @2021, American Chemical Society. c-h Morphology of MQDs at different reaction temperature of 100, 120, and 150 °C. The data was obtained by transmission electron microscopy; i XRD characterization of MQDs [58]. Copyright @2017, WILEY–VCH. j Scheme of synthesis MQDs at different solvents of DMSO, DMF, and ethanol; k XRD characterization of MQDs [96]. Copyright @2018, WILEY–VCH
Fig. 6
Fig. 6
Schematic illustration for the synthesis of MQDs by using different methods. a Probe ultrasound [108]. Copyright @2020, Wiley–VCH. b Bath sonication [109]. Copyright @2020, American Chemical Society. c A combination of probe sonication and bath sonication [110]. Copyright @2017, The Royal Society of Chemistry. d Mechanical stirring method [111]. Copyright @2021, Wiley–VCH
Fig. 7
Fig. 7
Schematics, structural and optical behavior characterizations of MQDs modified by single/dual heteroatoms. a Schematic illustration of the synthesis of N, P-Ti3C2 MQDs; b Charge density difference of N, P functionalized Ti3C2 MQDs; c Fluorescence emission spectra of N, P-Ti3C2 MQDs; d Photoluminescence decay spectra of the N-Ti3C2 MQDs, P-Ti3C2 MQDs, N, P-Ti3C2 MQDs [144]. Copyright @2019, The Royal Society of Chemistry. e Schematic illustration of the synthesis of S-Ti3C2 MQDs, N-Ti3C2 MQDs, S, N-Ti3C2 MQDs; f–h UV–Vis adsorption spectra of S-Ti3C2 MQDs, N-Ti3C2 MQDs, S, N-Ti3C2 MQDs [133]. Copyright @2019, Elsevier. i Schematic illustration of the synthesis of N-Ti2C MQDs; j Antioxidants performance test at KMnO4 solutions; k Mechanism of antioxidants [145]. Copyright @2021, American Chemical Society
Fig. 8
Fig. 8
Schematic and morphological and structural characterizations of 0D MQDs/0D nanocomposite. a Schematic illustration of the synthesis of CsPbBr3–Ti3C2Tx MQD/QD; b XRD patterns of CsPbBr3 QDs, Ti3C2Tx MQD, CsPbBr3–Ti3C2Tx MQD/QD; c TEM image of CsPbBr3–Ti3C2Tx MQD/QD; d HRTEM image of CsPbBr3–Ti3C2Tx MQD/QD [156]. Copyright @2020, American Chemical Society. e Schematic of the formation of Ni@Ti3C2 MQDs; f-g TEM image of Ni@Ti3C2 MQDs. insets of A and B represent HRTEM image of Ni and MQDs, respectively; h EDS of Ni@ Ti3C2 MQDs [77]. Copyright @2022, Elsevier
Fig. 9
Fig. 9
Schematic and morphological and structure characterizations of 0D MQDs/1D nanomaterials heterostructure. a Synthesis process of Ti3C2 QDs/Cu2O NWs/Cu heterostructure; b TEM image of the Ti3C2 QDs/Cu2O NWs heterojunction; c HRTEM image of the interface in Ti3C2 QDs and Cu2O; d-g EDX elemental mapping of Ti3C2 QDs/Cu2O NWs [67]. Copyright @2019, WILEY–VCH. h Schematic illustration of WO3/TQDs/In2S3 heterostructure; i TEM image of WO3/TQDs; j HRTEM image of WO3/TQDs; k TEM image of WO3/TQDs/In2S3; l HRTEM image of WO3/TQDs/In2S3 [74]. Copyright @2021, Elsevier. m Schematic for the preparation of Au NRs/Ti3C2 MQDs/Ti3C2 nanosheets; n TEM image of Au NRs/TDTS. Inset illustration is HRTEM image of Ti3C2 MQDs [157]. Copyright @2021, Elsevier
Fig. 10
Fig. 10
Schematic and morphological and structure characterizations of 0D MQDs/2D nanosheets heterostructure. a Schematic diagram of Ti3C2 MQDs/Ni-MOF; b SEM images of Ti3C2 MQDs/Ni-MOF; c TEM images of Ti3C2 MQDs/Ni-MOF. The inset illustration is the size distribution of Ti3C2 MQDs. Reproduced with permission [69]. Copyright @2020, American Chemical Society. d Synthesis process schematic of Ti3C2 QDC/N-C nanocomposites and e TEM image of Ti3C2 QDC/N-C, inset illustration is SAED pattern; f HRTEM image of Ti3C2 QDC/N-C [137]. Copyright @2021, Wiley–VCH. g Schematic preparation of Ti3C2 MQDs/TiO2/C3N4 hierarchical structure; h HRTEM image of T-CN-TC heterostructure [159]. Copyright @2020, Elsevier
Fig. 11
Fig. 11
Schematic and morphological and structure characterizations of 0D/3D heterostructure. a The prepared process diagram of C3N4/r-Ti3C2 QDs; b TEM image of C3N4/r-Ti3C2 QDs; c HRTEM image of C3N4/r-Ti3C2 QDs; d XRD pattern of C3N4, C3N4/r-Ti3C2 QDs [76]. Copyright @2022, The Royal Society of Chemistry. e Schematic preparation of Ti3C2 MQDs/3D Inverse Opal g‑C3N4 heterojunction; f SEM image of TC/CN-20 after adding 20 mL of MQDs solution and 20 mL water; g HRTEM image of TC/CN-20 [73]. Copyright @2020, American Chemical Society. h Schematic illustration of Ti3C2-QDs/ZnIn2S4/Ti(IV) heterostructure; i-k TEM image of Ti3C2-QDs/ZnIn2S4/Ti(IV) at different magnifications; l-p Elemental mappings of Ti3C2-QDs/ZnIn2S4/Ti(IV) [78]. Copyright @2022, MDPI and the authors
Fig. 12
Fig. 12
Schematic and morphological and structure characterizations of MXene-derived inorganic QDs. a Schematic of synthesis for TiO2/C-QDs; b TEM image of TiO2/C-QDs, the inset illustration is size distribution of TiO2/C-QDs; c HRTEM image of TiO2/C-QDs; d UV–Vis adsorption spectra of TiO2/C-QDs [88]. Copyright @2020, The Royal Society of Chemistry. e Illustration of preparation of oxygen-vacancy-rich TinO2n−1 QDs @PCN; f-g TEM image of OV–Tn QDs @PCN at different magnification; h-i HRTEM image of TinO2n−1 QDs @PCN with different number of oxygen vacancies [90]. Copyright @2021, Wiley–VCH. j Schematic illustration of the preparation of graphene quantum dots (GQDs); k TEM image of GQDs, and the inset illustration is size distribution of GQDs [195]. Copyright @2020, Elsevier
Fig. 13
Fig. 13
Characterization techniques of MQDs
Fig. 14
Fig. 14
Morphology and structure characterization of MQDs. a TEM image of Ti3C2 MQDs; b Size distribution of Ti3C2 MQDs; c HRTEM image of Ti3C2 MQDs, the inset illustration is corresponded Fourier transform; d AFM image of Ti3C2 MQDs; e The height distribution based on AFM; f Height profiles of Ti3C2 MQDs along d image [110]. Copyright @2017, The Royal Society of Chemistry. g XRD patterns of Ti3AlC2, Ti3C2 MXene, and Ti3C2 MQDs [204]. Copyright @2019, The Royal Society of Chemistry. h XRD patterns of bulk Ti3C2 MXene, Ti3C2 nanosheet, and Ti3C2 MQDs [59]. Copyright @2019, WILEY–VCH. i XRD patterns of Nb2AlC and Nb2C MQDs [205]. Copyright @2020, Elsevier
Fig. 15
Fig. 15
Composition and optical spectral characterization of MQDs. a XPS survey spectra of Ti3C2 MQDs; b High-resolution spectra of Ti 2p [204]. Copyright @2019, The Royal Society of Chemistry. c FTIR spectra of Ti3C2 MQDs [215]. Copyright @2018, The Royal Society of Chemistry. d Raman spectra of Ti3C2(OH)2 MQDs [70]. Copyright @2020, WILEY–VCH. e UV–Vis adsorption, PL, and PLE spectra of Ti3C2 MQDs; f PL spectra at different excitation wavenumbers [58]. Copyright @2017, WILEY–VCH
Fig. 16
Fig. 16
a-b Simulation diagram of energy levels and charge transfer processes in the MQDs and N-MQDs; c-d DOS calculation of MQDs and N-MQDs; e Work function of MQDs and N-MQDs [147]. Copyright @2018, The Royal Society of Chemistry. f-g DFT calculation of total and projected DOS of Nb2CO2 QDs and S, N-doped Nb2CO2 QDs [86]. Copyright @2020, The Royal Society of Chemistry
Fig. 17
Fig. 17
Electrocatalytic performance of MQDs. a Number of journal publications on different catalytic aspects (Source: Web of Science). b Reaction mechanism of electrocatalytic N2 reduction and free energy calculation on the Ti edge of Ti3C2, Ti3C2F, Ti3C2OH MXene from the adsorption of N2 to the reduction of NH3; c The average NH3 yield and faradaic efficiency of Ti3C2OH MQDs at different applied voltages [70]. Copyright @2020, WILEY–VCH. d Charge density difference of Ti3C2 MQDs/Cu; e The NH3 yield of Cu, MQDs, MQDs/Cu at applied voltage of -0.5 V, inset diagram is chronoamperometry test [79]. Copyright @2022, Zhengzhou University and Wiley
Fig. 18
Fig. 18
a Synthesis of Ti2CTx MQDs/Cu2O/Cu foam nanocomposite (top), the evolution process of functional groups and Soft X-ray emission spectrum (SXES) image; b The LSV image [164]. Copyright @2022, Zhengzhou University and Wiley. c TEM image of MoS2QDs @Ti3C2TxQDs@MWCNTs and d ORR performance of sample [66]. Copyright @2019, Elsevier. e AC-STEM image of Ti3C2 nanosheet; f AC-STEM of Ti3C2 MQDs; g Initial deep discharge–charge curves of the three samples at 200 mA g−1; h Cycling stability and terminal discharge–charge voltages of Ti3C2 QDC/N–C electrode at 200 mA g−1 [137]. Copyright @2021, Wiley–VCH
Fig. 19
Fig. 19
Photocatalytic water splitting performances of MQDs-based heterostructure. a Schematic react mechanism of g-C3N4@Ti3C2 QD; b Steady photoluminescence spectra of g-C3N4, MQDs@g-C3N4; c Time-resolved fluorescence decay spectra under the 325 nm excitation wavelength; d The transient photocurrent response; e Photocatalytic HER rate plot of catalyst [160]. Copyright @2019, American Chemical Society. f Schematic photocatalytic mechanism of BV@ZIS/TC QDs; g UV–visible diffuse reflectance spectra of BV@ZIS/TC QDs and control sample; h Photocatalytic gas production of BV@ZIS/TC QDs and control sample [68]. Copyright @2020, Elsevier
Fig. 20
Fig. 20
Photocatalytic CO2 reduction performances of MQDs-based photocatalysts. a TEM image of Ti3C2 MQDs/Cu2O/Cu; b Photocatalytic reaction mechanism of Ti3C2 MQDs/Cu2O/Cu; c UV–Vis diffuse reflectance spectra (DRS) of samples; d Nyquist plots of samples; e Methanol yield of samples [67]. Copyright @2019, WILEY–VCH. f TEM of TiO2/C3N4 with core–shell; g S-scheme heterojunction before and after contact, and light irradiation; h Schematic diagram of structure of TiO2/C3N4/Ti3C2 MQDs [159]. Copyright @2020, Elsevier
Fig. 21
Fig. 21
Photocatalytic performances of NH3, H2O2 production. a SEM image of Ti3C2 MQDs/Ni-MOF; b Energy band structure of Ti3C2 MQDs/Ni-MOF; c UV–Vis diffuse reflectance spectra of Ti3C2 MQDs, Ni-MOF, Ti3C2 MQDs/Ni-MOF nanocomposites with different loads of MQDs; d The NH3 yield of Ti3C2 MQDs/Ni-MOF [69]. Copyright @2020, American Chemical Society. e TEM image of C3N4/r-Ti3C2 MQDs Schematic diagram of photocatalytic N2 fixation; f Photocurrent test in Ar and N2 of samples; g UV–Vis DRS spectra of C3N4, C3N4/r-Ti3C2 MQDs; h Photocatalyst NH3 production rate and side reaction of H2 production [76]. Copyright @2022, The Royal Society of Chemistry. i Transfer of photogenerated electrons and holes near the carbon vacancies of C3N4 and C3N4/ r-Ti3C2 MQDs; j The energy band structure of C3N4/ r-Ti3C2 MQDs; k The photocatalytic reaction mechanism diagram of C3N4/r-Ti3C2 MQDs [73]. Copyright @2021, American Chemical Society
Fig. 22
Fig. 22
Photocatalytic pollutant degradation performances of MQDs-based heterojunction. a UV–Vis diffuse reflectance spectra (DRS) of samples; b Calculation of band gap of Bi2O3, BiOTIC-75; c Photocatalytic reaction mechanism illustration of BiOTIC-75; d Photocatalytic degradation of TC by Bi2O3, Ti3C2 MQDs/Bi2O3 with different content of MQDs [75]. Copyright @2021, Elsevier. e Energy band structure of MQDs/SiC, SiC, MQDs [71]. Copyright @2020, American Chemical Society
Fig. 23
Fig. 23
The photoelectrocatalytic performances of MQDs as co-catalyst. a UV–Vis adsorption spectra of Ti3C2 MQDs, Co-MQDs with different rates of Co/Ti; b Photoelectric conversion efficiency of Ti3C2 MQDs, Co-MQDs with different rates of Co/Ti; c Time-resolved photoluminescence (TRPL) spectra; d Photoelectrocatalytic water splitting mechanism under light irradiation; e Photocurrent test of Ti3C2 MQDs, Co-MQDs with different rates of Co/Ti [72]. Copyright @2020, WILEY–VCH. f Schematic illustration of the charge transfer process for NiFeOOH/MoOx/MQD/BiVO4 photoanodes; g Photoelectrochemical water splitting device [161]. Copyright @2022, Wiley–VCH

Similar articles

Cited by

References

    1. Winderlich R. Jons Jakob Berzelius. J. Chem. Educ. 1948;25(9):500. doi: 10.1021/ed025p500. - DOI
    1. Morachevskii AG. Jons Jakob Berzelius (to 225th anniversary of his birthday) Russ. J. Appl. Chem. 2004;77:1388–1391. doi: 10.1007/s11167-005-0037-1. - DOI
    1. Rupert FF. The solid hydrates of ammonia II. J. Am. Chem. Soc. 1910;32(6):748–749. doi: 10.1021/ja01924a004. - DOI
    1. Shi MM, Bao D, Wulan BR, Li YH, Zhang YF, et al. Au sub-nanoclusters on TiO2 toward highly efficient and selective electrocatalyst for N2 conversion to NH3 at ambient conditions. Adv. Mater. 2017;29(17):1606550. doi: 10.1002/adma.201606550. - DOI - PubMed
    1. Ling C, Bai X, Ouyang Y, Du A, Wang J. Single molybdenum atom anchored on N-doped carbon as a promising electrocatalyst for nitrogen reduction into ammonia at ambient conditions. J. Phys. Chem. C. 2018;122:16842–16847. doi: 10.1021/acs.jpcc.8b05257. - DOI

LinkOut - more resources