. 2023 Apr;43(3):1219-1236.
doi: 10.1007/s10571-022-01245-0. Epub 2022 Aug 2.

Visualizing Sphingosine-1-Phosphate Receptor 1(S1P1) Signaling During Central Nervous System De- and Remyelination

Affiliations

Visualizing Sphingosine-1-Phosphate Receptor 1(S1P1) Signaling During Central Nervous System De- and Remyelination

Ezzat Hashemi et al. Cell Mol Neurobiol. 2023 Apr.

Abstract

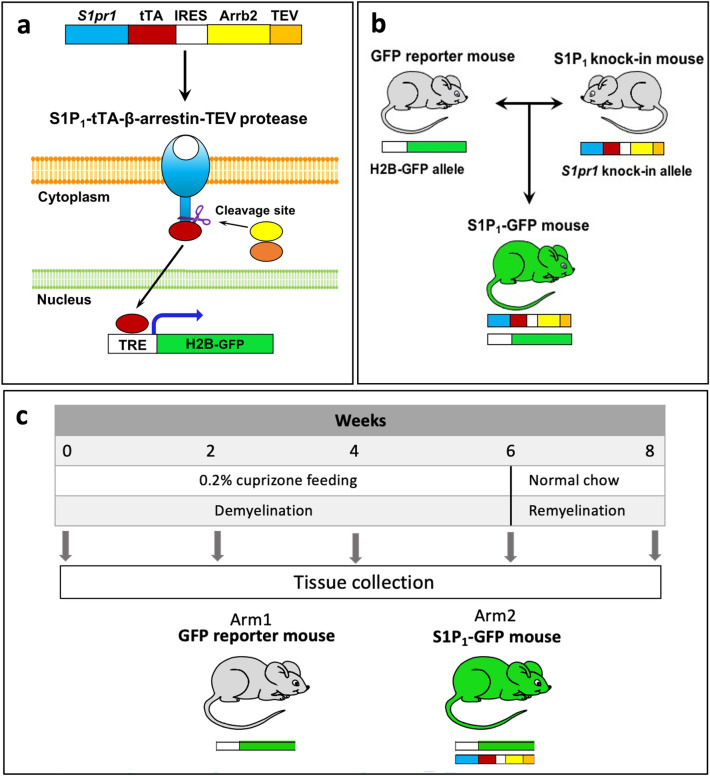
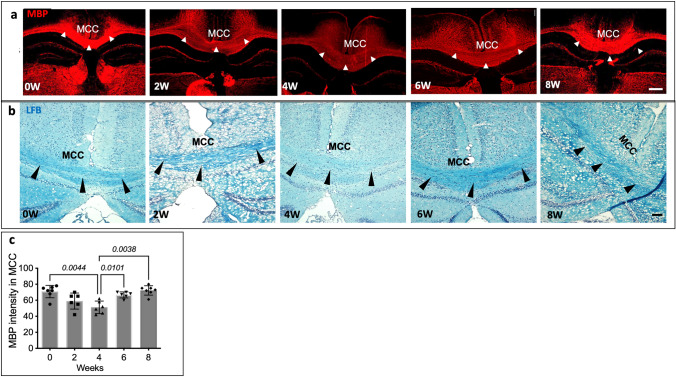
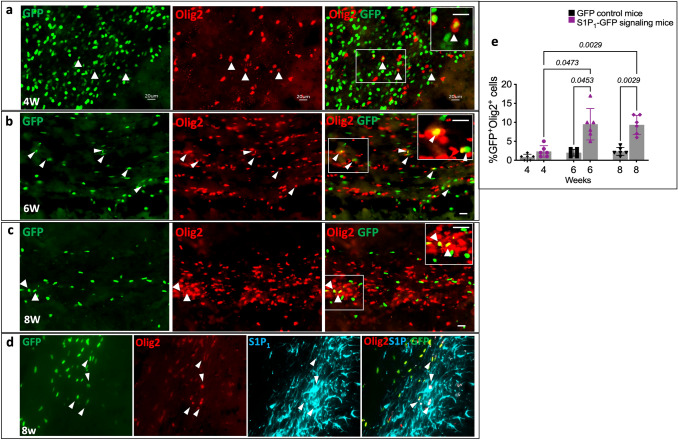
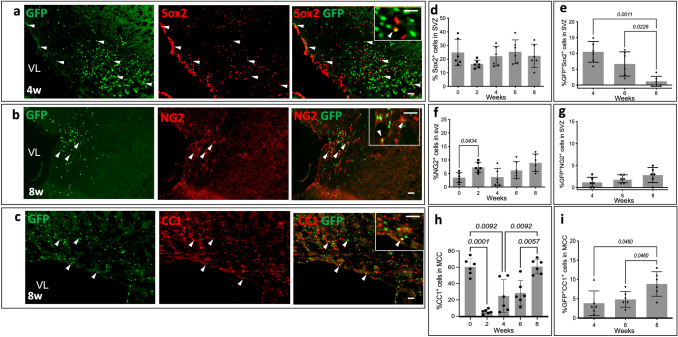
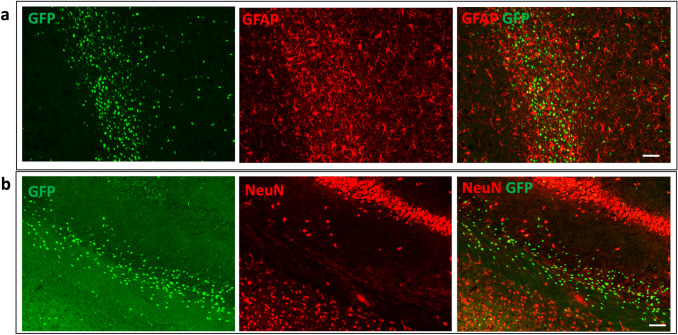
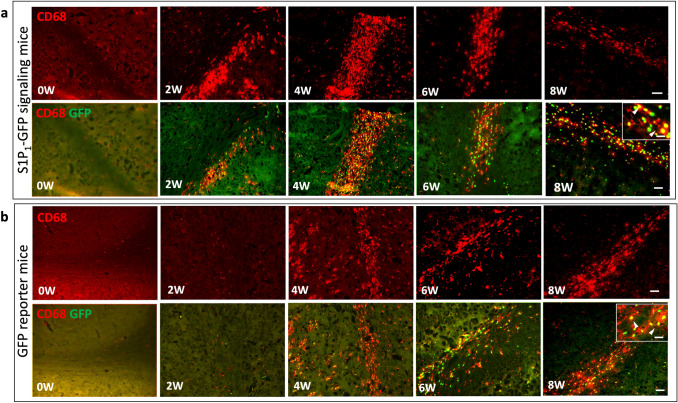
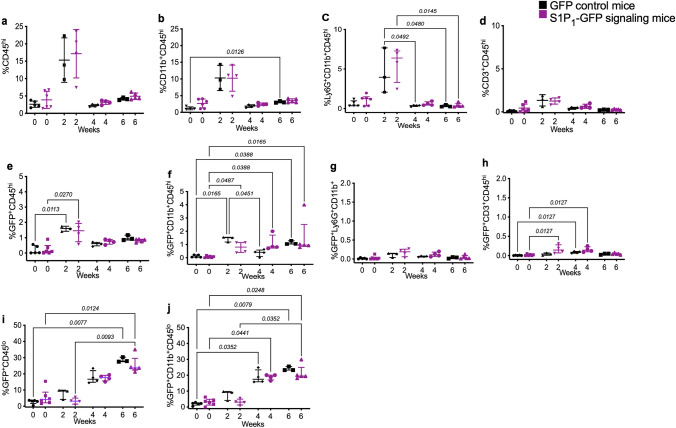
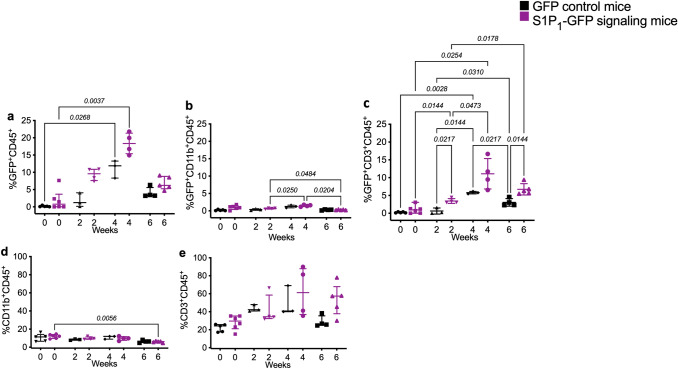
Multiple sclerosis (MS) is an inflammatory-demyelinating disease of the central nervous system (CNS) mediated by aberrant auto-reactive immune responses. The current immune-modulatory therapies are unable to protect and repair immune-mediated neural tissue damage. One of the therapeutic targets in MS is the sphingosine-1-phosphate (S1P) pathway which signals via sphingosine-1-phosphate receptors 1-5 (S1P1-5). S1P receptors are expressed predominantly on immune and CNS cells. Considering the potential neuroprotective properties of S1P signaling, we utilized S1P1-GFP (Green fluorescent protein) reporter mice in the cuprizone-induced demyelination model to investigate in vivo S1P - S1P1 signaling in the CNS. We observed S1P1 signaling in a subset of neural stem cells in the subventricular zone (SVZ) during demyelination. During remyelination, S1P1 signaling is expressed in oligodendrocyte progenitor cells in the SVZ and mature oligodendrocytes in the medial corpus callosum (MCC). In the cuprizone model, we did not observe S1P1 signaling in neurons and astrocytes. We also observed β-arrestin-dependent S1P1 signaling in lymphocytes during demyelination and CNS inflammation. Our findings reveal β-arrestin-dependent S1P1 signaling in oligodendrocyte lineage cells implying a role of S1P1 signaling in remyelination.

Keywords: Demyelination; GFP reporter mice; Multiple sclerosis; Oligodendrocyte; Sphingosine-1-phosphate receptor 1.


Conflict of interest statement

The authors declare that they have no conflicts of interest.

Figures

Fig. 1
Fig. 1
Generation of S1P1-GFP-signaling mice using the Tango system. a Diagram depicting the generation of the S1pr1 knock-in allele. The S1pr1 knock-in vector is constructed using two sets of fusion genes, TEV protease cleavage site and tTA linked to S1P1 C terminal, and β-arrestin-2 linked to TEV protease (Arrb2-TEV). The two fusion genes are connected via an IRES segment. S1P-S1P1 interaction results in the coupling of S1P1 with β-arrestin-TEV protease fusion protein and initiates the release of tTA from the C terminus of modified S1P1. Free tTA transfers to the nucleus and initiates GFP expression in histone-EGFP reporter (H2B-GFP) mice. Diagram adapted from Kono et al. (2014). b S1P1 knock-in mice are crossed with H2B-GFP mice to generate S1P1-GFP-signaling mice. c Experimental design of the cuprizone-induced demyelination model. Arrb2; β-arrestin-2, TEV; Tobacco etch virus, tTA; tetracycline-controlled transactivator, IRES; internal ribosome entry site, GFP; Green fluorescence protein, S1pr1; S1P receptor 1 gene, S1P1; S1P receptor 1
Fig. 2
Fig. 2
Validation of cuprizone-induced demyelination in S1P1-GFP-signaling mice. a MBP staining, via immunohistochemistry of the brain depicting de/remyelination in the MCC (arrowheads) of S1P1-GFP signaling mice following exposure to cuprizone diet (0–8 weeks). Scale bar, 200 µm. b LFB staining depicting myelin density in the MCC (arrowhead) of S1P1-GFP mice upon cuprizone exposure (0–8 weeks), Scale bar, 100 µm. c Quantification of MBP intensity in the MCC of S1P1-GFP-signaling mice fed with cuprizone diet from (a), (n = 6 mice/group, n = 60 total mice). The values are presented as Mean ± SD. One-way ANOVA and multiple comparisons tests were used to determine the significant differences in MBP intensity in S1P1-signaling mice at 0, 2, 4, 6, and 8 weeks of cuprizone fed (p < 0.05). The variance homogeneity, F (DFn Dfd), was 9.175 (4.000, 20.06). MCC; Medial Corpus Callosum, LFB; Luxol Fast Blue, MBP; Myelin Basic Protein
Fig. 3
Fig. 3
Quantitative label-free microscopy validates cuprizone-induced demyelination. Retardance due to anisotropy of myelin in the MCC of (a) two naïve and (b) two cuprizone diet-fed (4 weeks) in S1P1-GFP-signaling mice. Higher retardance implies higher myelination. The grayscale color bar indicates the range of retardance measurement in the nanometer unit (0–50 nm). The histograms of the signals from the blue-box areas in the MCC of brain sections show the Mean ± SD of the retardance of myelin (nm) in (c) naïve mice (from images in a) and (d) 4 weeks cuprizone diet-fed mice (from images in b). The Y-axis of the histogram represents the number of pixels in the bin with ∼ 0.3 nm. Scale bar, 200 µm. e The graph represents the intensity of retardancy in myelin in the MCC of naïve and 4 weeks cuprizone diet in S1P1-signaling mice. (n = 4–5 mice/group, n = 9 total mice). Statistical significance was determined by an unpaired t-test (p < 0.05). The variance homogeneity, F (DFn Dfd), was 1.391 (4, 3). MCC; Medial Corpus Callosum
Fig. 4
Fig. 4
S1P1 signaling in oligodendrocytes depicted by GFP expression during remyelination. a Immunohistochemistry of oligodendrocytes (Olig2+) in the MCC of S1P1-GFP-signaling mice at 4 weeks, (b) 6 weeks, and (c) 8 weeks following exposure to cuprizone diet. White arrowheads indicate GFP expression colocalizing with Olig2+ cells. Scale bars, 20 µm. Magnification of S1P1 signaling in oligodendrocytes is depicted in the upper right corner. d S1P1 and Olig2 staining in the SVZ of S1P1-GFP-signaling mice at 8 weeks of cuprizone diet. White arrowheads represent GFP expression in Olig2+S1P1+ cells. The image on the right shows a higher magnification of GFP expression in Olig2+NG2+ cells. (e) Quantification of GFP+Olig2+ to the total GFP+ cells in 0.1 mm2 of MCC of the control and S1P1-GFP-signaling mice (n = 6 mice/group, n = 60 total mice). ImageJ was used for counting the cells. The values presented as Mean ± SD. One-way ANOVA and multiple comparisons tests were used to determine the significant differences in Olig2+GFP+ cells between the GFP reporter and S1P1-signaling mice in each time point of cuprizone fed and in each group of mice during the cuprizone fed (4, 6, and 8 weeks) (p < 0.05). The variance homogeneity F (DFn, Dfd) was 19.85 (5.000, 11.62) for GFP-Olig2. SVZ; Subventricular Zone. MCC; Medial Corpus Callosum, OPCs; Oligodendrocyte Progenitor Cells and NG2; Neural-Glial Antigen
Fig. 5
Fig. 5
S1P1 signaling in oligodendrocyte progenitor cells detected by GFP expression. The images represent S1P1 signaling in (a) Sox2+ (b) NG2+ and (c) CC1+ cells in SVZ of S1P1-GFP-signaling mice at 4 (a) and 8 (b and c) weeks following exposure to cuprizone. Arrowheads indicate colocalization with the GFP signal. The upper right corner images depict a higher magnification of S1P1 signaling in oligodendrocytes. The graphs represent the percentage of (d) Sox2+, (f) NG2+ and (h) CC1 cells in 0.1 mm2 of SVZ in S1P1-GFP-signaling mice, which normalized by DAPI. The percentage of (e) GFP+Sox2+, (g) GFP+NG2+ and (i) GFP+CC1+ cells of total GFP+ cells per 0.1 mm2 during cuprizone diet (0, 2, 4, 6, and 8 weeks), (n = 6 mice/groups, n = 60 total mice). The values are presented as Mean ± SD. One-way ANOVA and multiple comparisons tests were used to determine the significant differences in S1P1-signaling mice at each time point of cuprizone fed (p < 0.05), Scale bars, 20 µm. Variance Homogeneity, F (DFn Dfd), were: Sox 2 = 1.257 (4.000, 20.26), Sox2-GFP = 14.18 (2.000, 11.60), NG2 = 4.055 (4.000, 22.09), NG2-GFP = 2.435 (2.000, 11.65), CC1 = 20.84 (4.000, 14.62), and CC1-GFP = 5.143 (2.000, 13.39). SVZ; Subventricular Zone. NG2; Neural-Glial Antigen 2., VL; Lateral Ventricle
Fig. 6
Fig. 6
Lack of GFP expression in astrocytes and neurons in S1P1-GFP-signaling mice during cuprizone diet. The images indicated. (a) Astrocytes (GFAP+) and (b) NeuN+ cells were GFP negative in the LCC of S1P1-GFP-signaling mice at 4 weeks of cuprizone diet. Scale bars, 50 µm (a and b). LCC; Lateral Corpus Callosum
Fig. 7
Fig. 7
GFP expression in myeloid cells of S1P1-GFP signaling and GFP reporter mice upon cuprizone exposure. GFP expression in myeloid cells (CD68+) in the LCC of (a) S1P1-GFP-signaling mice and (b) GFP reporter mice at 0, 2, 4, 6, 8 weeks of the cuprizone diet. In the upper right corner higher magnification of GFP expression in CD68+ cells are shown. Scale bars, 50 µm and 20 µm for images with higher magnification. LCC; Lateral Corpus Callosum
Fig. 8
Fig. 8
Flow cytometry analysis of S1P1 signaling via GFP expression in cerebral immune cells upon cuprizone-induced demyelination. GFP expression in cerebral immune cell subpopulations upon cuprizone exposure (0, 2, 4, and 6 weeks) in GFP reporter and S1P1-GFP-signaling mice. a Infiltration of immune cells (CD45hi), (b) myeloid cells (CD11b+CD45hi), (c) granulocytes (LyG+CD45hi) and (d) lymphocytes (CD3+CD45hi) into the brain during demyelination (0–6 weeks) in S1P1-GFP signaling and GFP reporter mice. (e) GFP expression in infiltrating immune cells (CD45hi), (f) myeloid cells (CD11b+CD45hi), (g) granulocytes (LyG+CD45hi) and (h) lymphocytes (CD3+CD45hi) in GFP reporter and S1P1-GFP-signaling mice during demyelination. GFP expression in (i) resident microglia (GFP+CD45lo) and (j) activated microglia (GFP+CD45lo CD11b+) in GFP reporter and signaling mice. One-way ANOVA and multiple comparisons tests were used to analyze the significant differences between the GFP reporter and S1P1-signaling mice at each time point of the cuprizone diet and significant changes in each group of mice during cuprizone fed (p < 0.05) (3–6 mice/group, n = 34 total mice). The values are presented as Mean ± SD in the a, b, and d graphs. Kruskal–Wallis was used for nonparametric graphs, and the values presented as median with interquartile range in c, e, f, g, h, I, and j graphs. Variance homogeneity, F (DFn Dfd) in normal distributed groups: CD45hi = 10.85 (7.000, 5.785), CD11b = 12.19 (7.000, 5.662), Ly-6G, CD3 = 7.699 (7.000, 6.452). Ly-6G, CD45hi-GFP, CD11b-GFP, Ly-6G-GFP, CD3-GFP, CD45lo-GFP, CD45lo, and CD11b-GFP groups exhibited non-normal distribution
Fig. 9
Fig. 9
Flow cytometry analysis of S1P1 signaling via GFP expression in splenic immune cells upon cuprizone-induced demyelination. a GFP expression in leukocytes (CD45+), (b) myeloid cells (CD11b+) and (c) lymphocytes (CD3+) in the spleens of S1P1-GFP signaling and GFP reporter mice following exposure to cuprizone diet (0–6 weeks). (d) Percentage of myeloid cells (CD11b+) and (e) lymphocytes (CD3+) in CD45+ population during cuprizone diet. One-way ANOVA and multiple comparisons tests were used to analyze the significant differences between the GFP reporter and S1P1-signaling mice in each time point of cuprizone diet and significant changes in each group of mice during cuprizone fed (p < 0.05) (3–6 mice/group, n = 34 total mice). The values presented as Mean ± SD in b and c graphs. Kruskal–Wallis was used for nonparametric graphs and the values presented as median with interquartile range in a, d and e graphs (Supplementary Table 3S). The variance homogeneity, F (DFn, Dfd) were: CD11b-GFP = 11.58 (7.000, 12.80), CD3-GFP = 19.05 (7.000, 5.229). CD45-GFP, CD11b, and CD3 exhibited non-normal distribution

Similar articles

Cited by

References

    1. Alfonso J, Penkert H, Duman C, Zuccotti A, Monyer H (2015) Downregulation of sphingosine 1-phosphate receptor 1 promotes the switch from tangential to radial migration in the OB. J Neurosci 35(40):13659–13672. 10.1523/JNEUROSCI.1353-15.2015 - PMC - PubMed
    1. Allende ML, Tuymetova G, Lee BG, Bonifacino E, Wu YP, Proia RL (2010) S1P1 receptor directs the release of immature B cells from bone marrow into blood. J Exp Med 207(5):1113–1124. 10.1084/jem.20092210 - PMC - PubMed
    1. Anastasiadou S, Knoll B (2016) The multiple sclerosis drug fingolimod (FTY720) stimulates neuronal gene expression, axonal growth and regeneration. Exp Neurol 279:243–260. 10.1016/j.expneurol.2016.03.012 - PubMed
    1. Arac A, Brownell SE, Rothbard JB, Chen C, Ko RM, Pereira MP, Albers GW, Steinman L, Steinberg GK (2011) Systemic augmentation of alphaB-crystallin provides therapeutic benefit twelve hours post-stroke onset via immune modulation. Proc Natl Acad Sci USA 108(32):13287–13292. 10.1073/pnas.1107368108 - PMC - PubMed
    1. Baecher-Allan C, Kaskow BJ, Weiner HL (2018) Multiple sclerosis: mechanisms and immunotherapy. Neuron 97(4):742–768. 10.1016/j.neuron.2018.01.021 - PubMed

MeSH terms