. 2022 Sep 8;7(17):e156623.
doi: 10.1172/jci.insight.156623.

Lysosomal acid lipase, CSF1R, and PD-L1 determine functions of CD11c+ myeloid-derived suppressor cells

Affiliations

Lysosomal acid lipase, CSF1R, and PD-L1 determine functions of CD11c+ myeloid-derived suppressor cells

Ting Zhao et al. JCI Insight. .

Abstract

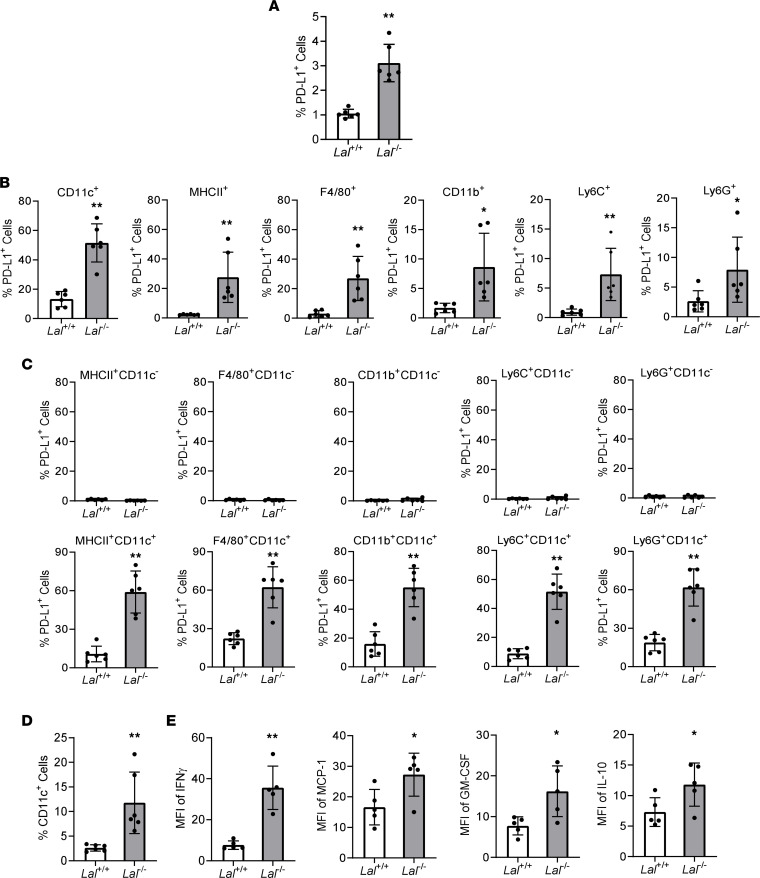
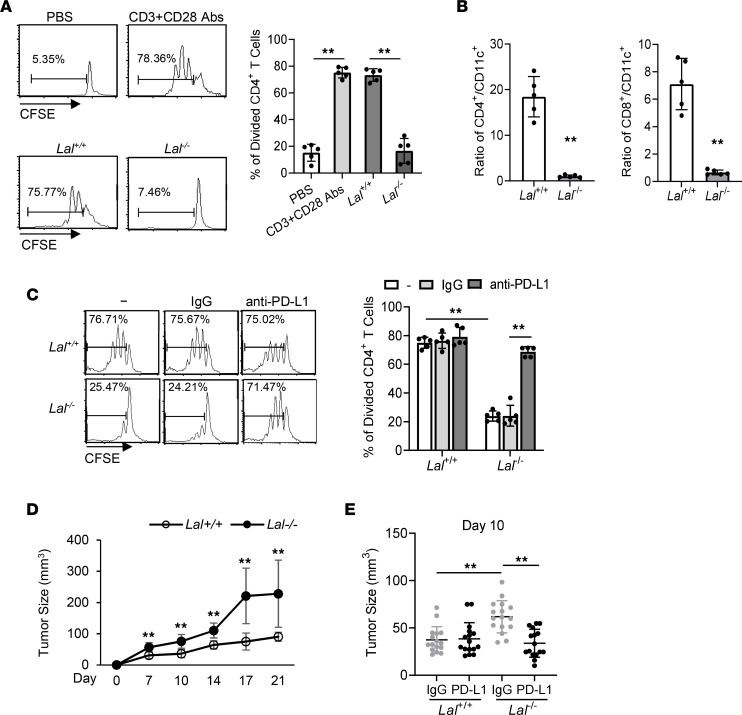
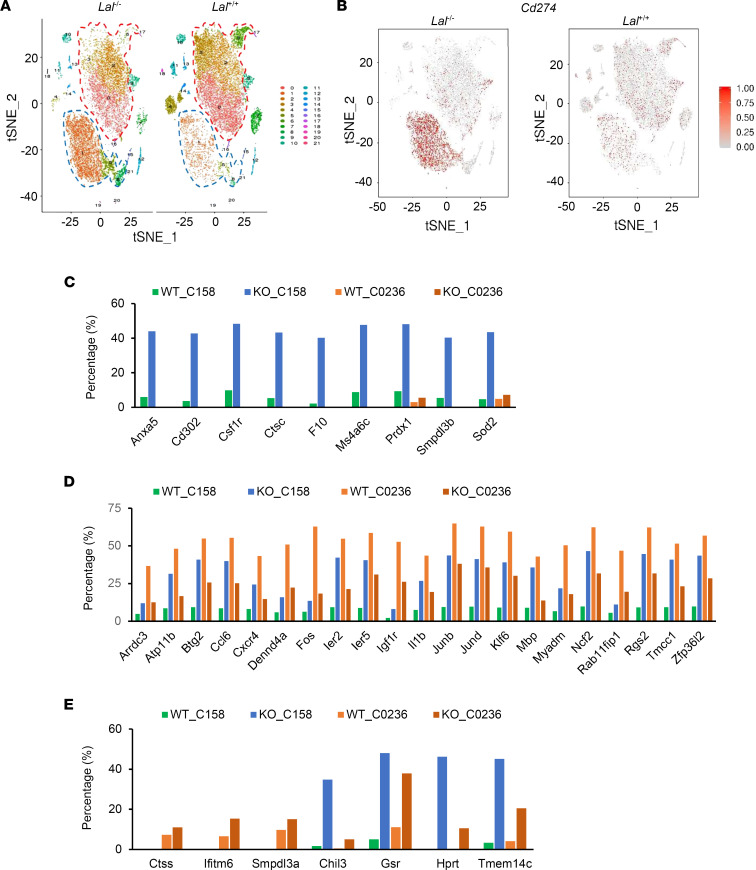
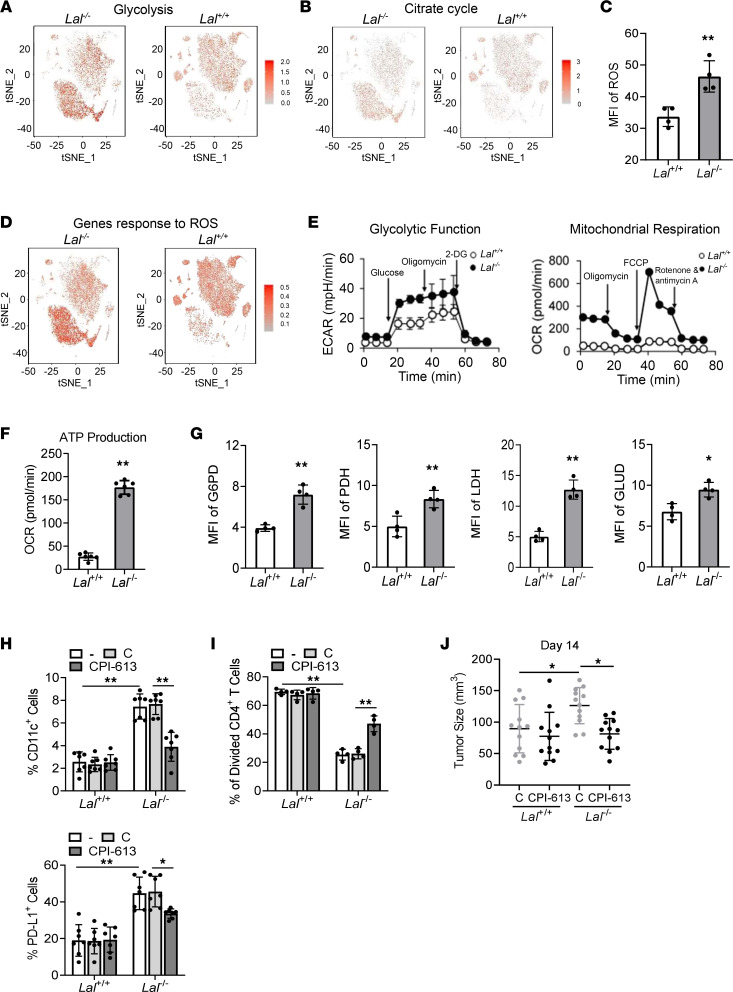
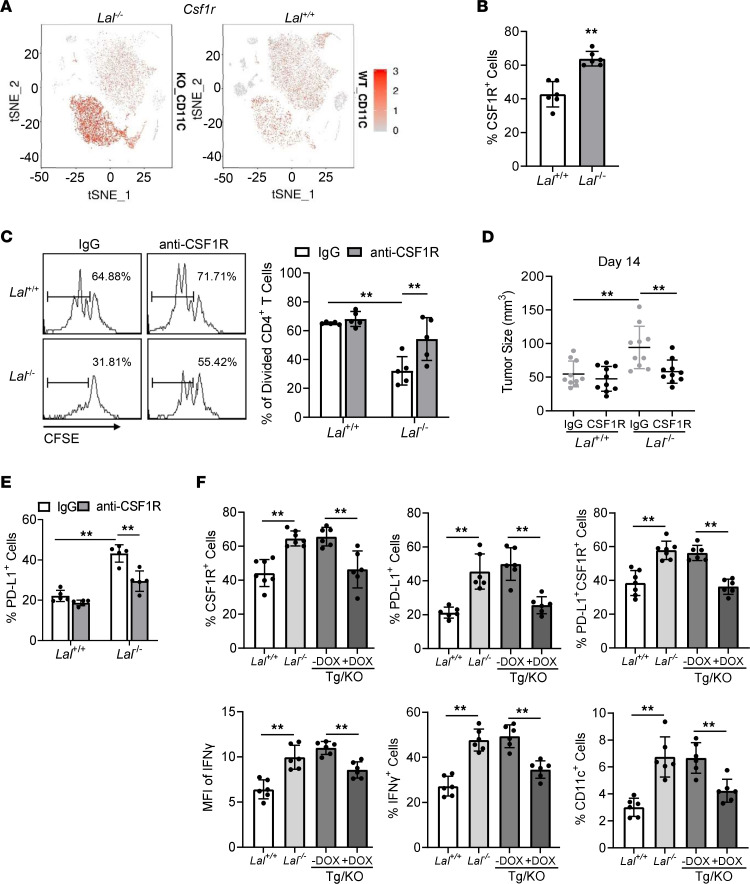
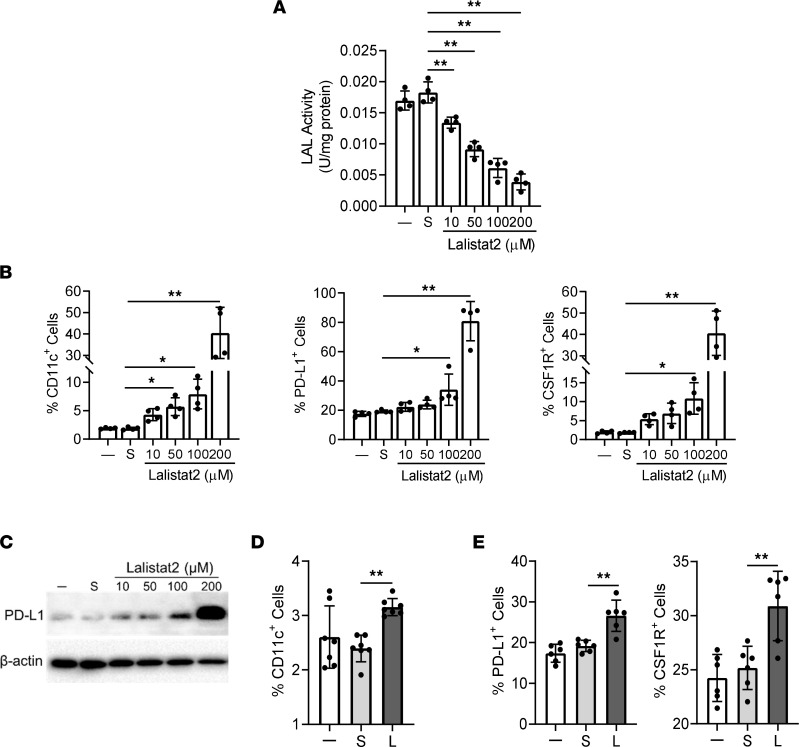
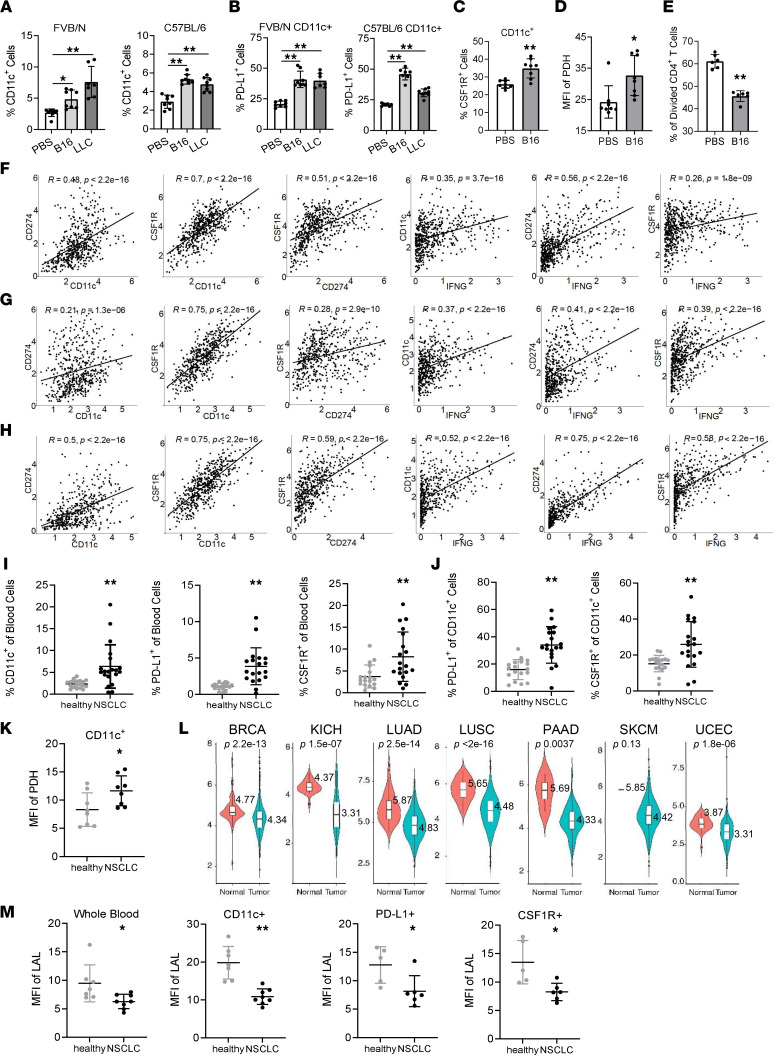
Lysosomal acid lipase (LAL) is a key enzyme in the metabolic pathway of neutral lipids. In the blood of LAL-deficient (Lal-/-) mice, increased CD11c+ cells were accompanied by upregulated programmed cell death ligand 1 (PD-L1) expression. Single-cell RNA sequencing of Lal-/- CD11c+ cells identified 2 distinctive clusters with a major metabolic shift toward glucose utilization and reactive oxygen species overproduction. Pharmacologically blocking pyruvate dehydrogenase in glycolysis not only reduced CD11c+ cells and their PD-L1 expression but also reversed their capabilities of T cell suppression and tumor growth stimulation. Colony-stimulating factor 1 receptor (CSF1R) played an essential role in controlling Lal-/- CD11c+ cell homeostasis and function and PD-L1 expression. Pharmacological inhibition of LAL activity increased CD11c, PD-L1, and CSF1R levels in both normal murine myeloid cells and human blood cells. Tumor-bearing mice and human patients with non-small cell lung cancer also showed CD11c+ cell expansion with PD-L1 and CSF1R upregulation and immunosuppression. There were positive correlations among CD11c, PD-L1, and CSF1R expression and negative correlations with LAL expression in patients with lung cancer or melanoma using The Cancer Genome Atlas database and patient samples. Therefore, CD11c+ cells switched their functions to immune suppression and tumor growth stimulation through CSF1R/PD-L1 upregulation and metabolic reprogramming.

Keywords: Cancer immunotherapy; Immunology.


Conflict of interest statement

Conflict of interest: The authors have declared that no conflict of interest exists.

Figures

Figure 1
Figure 1. PD-L1 expression is increased in Lal–/– CD11c+ cells.
(A) Percentage of PD-L1+ cells in the blood of Lal+/+ and Lal–/– mice by flow cytometry analysis. (B) PD-L1 expression in blood CD11c+, MHCII+, F4/80+, CD11b+, Ly6C+, and Ly6G+ cells of Lal–/– versus Lal+/+ mice by flow cytometry analysis. (C) PD-L1 expression in CD11c or CD11c+ double-gated myeloid cells of Lal–/– versus Lal+/+ blood by flow cytometry analysis. (D) Percentage of CD11c+ cells in the blood of Lal+/+ and Lal–/– mice by flow cytometry analysis. (E) Cytokine expression in Lal–/– versus Lal+/+ CD11c+ cells by flow cytometry analysis. Data are expressed as mean ± SD. Experiments were independently repeated, n = 6 for AD, n = 5 for E. *P < 0.05, **P < 0.01, unpaired Student’s t test.
Figure 2
Figure 2. Lal–/– CD11c+ cells suppress T cell proliferation and stimulate tumor cell growth through PD-L1.
(A) CFSE-labeled Lal+/+ CD4+ T cells were stimulated with anti-CD3 mAb plus anti-CD28 mAb for 4 days in the presence or absence of Lal+/+ or Lal–/– CD11c+ cells at a 1:1 CD4+ T cell/CD11c+ cell ratio. Proliferation of labeled CD4+ T cells was analyzed by flow cytometry. Peaks represent cell division cycles. PBS was used as a negative control. Left: A representative CFSE dilution by flow cytometry. Right: Statistical analyses of percentage of divided CD4+ T cells. (B) Ratios of CD4+ T cells to CD11c+ cells and CD8+ T cells to CD11c+ cells in the blood of Lal–/– versus Lal+/+ mice were analyzed by flow cytometry analysis. (C) Freshly isolated Lal+/+ or Lal–/– CD11c+ cells were pretreated with IgG or anti–PD-L1 antibody (5 μg/mL), then cocultured with CFSE-labeled Lal+/+ CD4+ T cells (at 1:1 ratio) for T cell proliferation assay as described for A. (D) B16 melanoma cells (2 × 10⁵) were mixed with Lal+/+ or Lal–/– CD11c+ cells (2 × 10⁵) and injected subcutaneously at the flank region of Lal+/+ recipient mice. Tumor size was measured at 7, 10, 14, 17, and 21 days after cell injection and determined using the formula (length × width2)/2. (E) Lal+/+ or Lal–/– CD11c+ cells were pretreated with IgG or anti–PD-L1 antibody (5 μg/mL), then coinjected with B16 melanoma cells into the flank region of Lal+/+ recipient mice. Data are expressed as mean ± SD. Experiments were independently repeated, n = 5 for AC, n = 10 for D, n = 16 for E. **P < 0.01, 1-way ANOVA for A and E, unpaired Student’s t test for B and D, 2-way ANOVA for C.
Figure 3
Figure 3. Identification and gene expression of Lal–/– versus Lal+/+ CD11c+ cell clusters by scRNA-Seq.
(A) t-SNE plot of CD11c+ cell clusters from Lal–/– versus Lal+/+ mice. Each dot represents a single cell colored by cluster assignment. The dashed blue line circles cluster 158, and the dashed red line circles cluster 0236. (B) Feature plot of Cd274 (PD-L1) expression across cell clusters identified in A. (C) Percentages of cells for expressed genes were increased in cluster 158 and relatively unchanged in cluster 0236 of Lal–/– versus Lal+/+ CD11c+ cells. The percentage was calculated using the number of expressed cells for the gene divided by the number of cells for this sample. (D) Percentages of cells for expressed genes were increased in cluster 158 but decreased in cluster 0236 of Lal–/– versus Lal+/+ CD11c+ cells. (E) Percentages of cells for expressed genes were increased in cluster 0236 but undetectable or increased in cluster 158 of Lal–/– versus Lal+/+ CD11c+ cells.
Figure 4
Figure 4. Metabolic reprogramming in Lal–/– CD11c+ cells.
(A and B) Gene expression of glycolysis (A) and citrate cycle (B) across cell clusters in t-SNE plots of CD11c+ cells from Lal–/– versus Lal+/+ mice. (C) Statistical analysis of ROS MFI in Lal–/– versus Lal+/+ CD11c+ cells by flow cytometry. (D) Expression of gene response to ROS across cell clusters in t-SNE plots of CD11c+ cells from Lal–/– versus Lal+/+ mice. (E) Extracellular acidification rate (ECAR) of glycolysis and oxygen consumption rate (OCR) in mitochondrial respiration in Lal–/– versus Lal+/+ CD11c+ cells. (F) ATP production in mitochondrial respiration in Lal–/– versus Lal+/+ CD11c+ cells. (G) MFI of G6PD, PDH, LDH, and GLUD expression in Lal–/– versus Lal+/+ CD11c+ cells by flow cytometry. (H) Percentage of CD11c+ cells in the blood and percentage of PD-L1+ cells in CD11c+ blood cells after CPI-613 treatment by flow cytometry analysis. (I) CPI-613–pretreated CD11c+ cells were cocultured with CFSE-labeled Lal+/+ CD4+ T cells for T cell proliferation assay. (J) CPI-613–pretreated CD11c+ cells (2 × 10⁵) were coinjected with B16 melanoma cells (2 × 10⁵) into the flank region of Lal+/+ recipient mice for tumor growth assay. Data are expressed as mean ± SD. Experiments were independently repeated, n = 4 for C, G, and I, n = 6–8 for E and F, n = 7 for H, n = 12 for J. *P < 0.05, **P < 0.01, unpaired Student’s t test for C, F, and G, 2-way ANOVA for H and I, 1-way ANOVA for J.
Figure 5
Figure 5. CSF1R expression and function in Lal–/– CD11c+ cells.
(A) Csf1r expression across cell clusters in t-SNE plots of CD11c+ cells from Lal–/– versus Lal+/+ mice. (B) Percentage of CSF1R+ cells in blood CD11c+ cells of Lal–/– versus Lal+/+ mice by flow cytometry analysis. (C) Isolated Lal+/+ or Lal–/– CD11c+ cells were pretreated with IgG or anti-CSF1R antibody (5 μg/mL) and cocultured with CFSE-labeled Lal+/+ CD4+ T cells (at 1:1 ratio). The proliferation of labeled CD4+ T cells was analyzed by flow cytometry. (D) Isolated Lal+/+ or Lal–/– CD11c+ cells (2 × 10⁵) were pretreated with IgG or anti-CSF1R antibody (5 μg/mL) and coinjected with B16 melanoma cells (2 × 10⁵) into the flank region of Lal+/+ recipient mice. The tumor size was measured at 14 days after cell injection. (E) Percentage of PD-L1+ cells in CD11c+ cells after anti-CSF1R antibody treatment (5 μg/mL) by flow cytometry analysis. (F) Percentages of CSF1R+ cells, PD-L1+ cells, PD-L1+CSF1R+ cells, and IFN-γ+ cells and MFI of IFN-γ in blood CD11c+ cells and percentage of blood CD11c+ cells in Lal+/+, Lal–/–, untreated (–DOX), and DOX-treated (+DOX) c-fms–Tg/KO (Tg/KO) mice by flow cytometry analysis. Data are expressed as mean ± SD. Experiments were independently repeated, n = 6 for B, n = 5 for C and E, n = 10 for D, n = 6–7 for F. **P < 0.01, unpaired Student’s t test for B, 2-way ANOVA for C and E, 1-way ANOVA for D and F.
Figure 6
Figure 6. Expression of PD-L1 and CSF1R in mouse myeloid cells and human blood CD11c+ cells after Lalistat2 treatment.
(A) LAL enzymatic activity in HD1A myeloid cells after incubation with 10 μM, 50 μM, 100 μM, and 200 μM Lalistat2 or DMSO (S) for 72 hours. (B) Murine HD1A myeloid cells were incubated with 10 μM, 50 μM, 100 μM, and 200 μM Lalistat2 or DMSO (S) for 72 hours. Percentages of CD11c+, PD-L1+, and CSF1R+ cells in HD1A myeloid cells were analyzed by flow cytometry. (C) Expression of PD-L1 in HD1A myeloid cells after Lalistat2 or DMSO treatment for 72 hours by Western blot analysis. Representative blots are shown. (D) Human white blood cells from healthy individuals were incubated with 10 μM Lalistat2 (L) or DMSO (S) for 24 hours. Percentages of CD11c+ cells in the whole white blood cells were analyzed by flow cytometry. (E) Percentages of PD-L1+ and CSF1R+ cells in blood CD11c+ cells of healthy individuals treated with Lalistat2 (L) versus DMSO (S). Data are expressed as mean ± SD. Experiments were independently repeated, n = 4 for A and B, n = 3 for C, n = 6 for D, n = 5 for E. *P < 0.05, **P < 0.01, 1-way ANOVA.
Figure 7
Figure 7. Expression of PD-L1 and CSF1R in CD11c+ cells of tumor-bearing mice and NSCLC patients.
(A and B) Percentages of CD11c+ blood cells (A) and percentages of PD-L1+ cells in CD11c+ blood cells (B) of B16 melanoma or LLC cell–injected versus PBS-injected FVB/N or C57BL/6 mice. (C and D) Percentages of CSF1R+ cells (C) and MFI of PDH expression (D) in CD11c+ blood cells of B16 melanoma cell–injected versus PBS-injected FVB/N mice. (E) CD11c+ blood cells were isolated from B16 melanoma cell–injected or PBS-injected FVB/N mice, and cocultured with CFSE-labeled Lal+/+ CD4+ T cells (at 1:1 ratio). (FH) Pearson correlation analysis of expressions of CD11C and CD274, CD11C and CSF1R, CD274 and CSF1R, IFNG and CD11C, IFNG and CD274, IFNG and CSF1R in LUAD (F), LUSC (G), and SKCM (H). (I) Statistical analysis of percentages of CD11c+, PD-L1+, and CSF1R+ cells in blood of patients with NSCLC versus healthy individuals. (J) Percentages of PD-L1+ and CSF1R+ cells in blood CD11c+ cells of patients with NSCLC versus healthy individuals. (K) MFI of PDH expression in blood CD11c+ cells of patients with NSCLC versus healthy individuals. (L) Expression of the gene LIPA (LAL) in violin plots from patients with BRCA, KICH, LUAD, LUSC, PAAD, SKCM, or UCEC versus healthy individuals. (M) MFI of LAL in whole blood, CD11c+, PD-L1+, and CSF1R+ cells of patients with NSCLC versus healthy individuals. Data are expressed as mean ± SD. Experiments were independently repeated, n = 7–8 for AD, n = 6 for E, n = 585 for F, n = 550 for G, n = 472 for H, n = 18–20 for I and J, n = 5–8 for K and M. *P < 0.05, **P < 0.01, 1-way ANOVA for A and B, unpaired Student’s t test for CE, IK, and M.

Similar articles

Cited by

References

    1. Lei X, et al. Immune cells within the tumor microenvironment: biological functions and roles in cancer immunotherapy. Cancer Lett. 2020;470:126–133. doi: 10.1016/j.canlet.2019.11.009. - DOI - PubMed
    1. Iwai Y, et al. Involvement of PD-L1 on tumor cells in the escape from host immune system and tumor immunotherapy by PD-L1 blockade. Proc Natl Acad Sci U S A. 2002;99(19):12293–12297. doi: 10.1073/pnas.192461099. - DOI - PMC - PubMed
    1. Pardoll DM. The blockade of immune checkpoints in cancer immunotherapy. Nat Rev Cancer. 2012;12(4):252–264. doi: 10.1038/nrc3239. - DOI - PMC - PubMed
    1. Alsaab HO, et al. PD-1 and PD-L1 checkpoint signaling inhibition for cancer immunotherapy: mechanism, combinations, and clinical outcome. Front Pharmacol. 2017;8:561. doi: 10.3389/fphar.2017.00561. - DOI - PMC - PubMed
    1. Butte MJ, et al. Programmed death-1 ligand 1 interacts specifically with the B7-1 costimulatory molecule to inhibit T cell responses. Immunity. 2007;27(1):111–122. doi: 10.1016/j.immuni.2007.05.016. - DOI - PMC - PubMed

Publication types

Substances