. 2022 Aug 9;119(32):e2120777119.
doi: 10.1073/pnas.2120777119. Epub 2022 Aug 2.

Recurrent droughts increase risk of cascading tipping events by outpacing adaptive capacities in the Amazon rainforest

Affiliations

Recurrent droughts increase risk of cascading tipping events by outpacing adaptive capacities in the Amazon rainforest

Nico Wunderling et al. Proc Natl Acad Sci U S A. .

Abstract

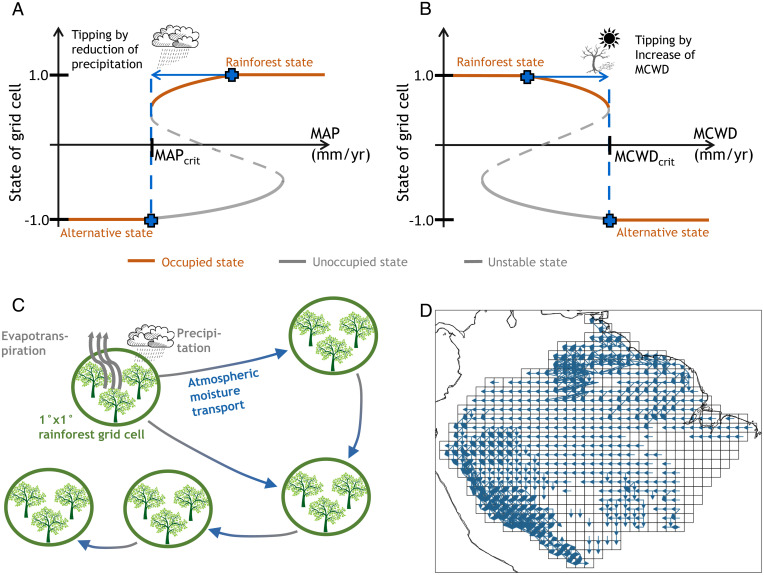
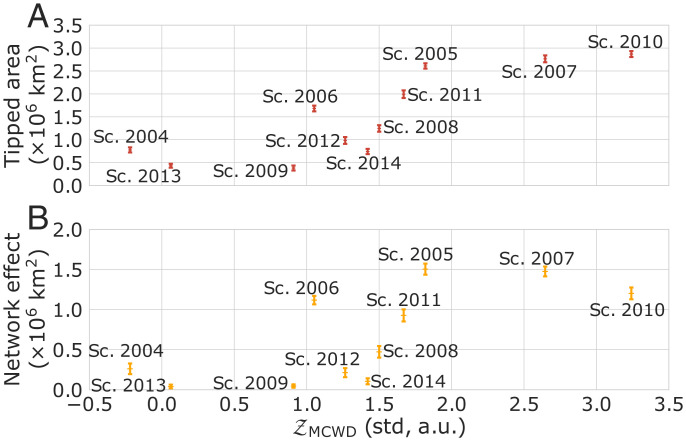
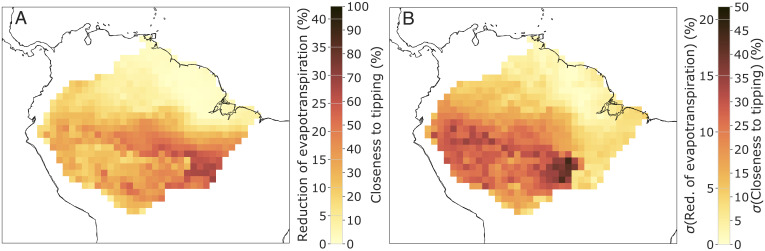
Tipping elements are nonlinear subsystems of the Earth system that have the potential to abruptly shift to another state if environmental change occurs close to a critical threshold with large consequences for human societies and ecosystems. Among these tipping elements may be the Amazon rainforest, which has been undergoing intensive anthropogenic activities and increasingly frequent droughts. Here, we assess how extreme deviations from climatological rainfall regimes may cause local forest collapse that cascades through the coupled forest-climate system. We develop a conceptual dynamic network model to isolate and uncover the role of atmospheric moisture recycling in such tipping cascades. We account for heterogeneity in critical thresholds of the forest caused by adaptation to local climatic conditions. Our results reveal that, despite this adaptation, a future climate characterized by permanent drought conditions could trigger a transition to an open canopy state particularly in the southern Amazon. The loss of atmospheric moisture recycling contributes to one-third of the tipping events. Thus, by exceeding local thresholds in forest adaptive capacity, local climate change impacts may propagate to other regions of the Amazon basin, causing a risk of forest shifts even in regions where critical thresholds have not been crossed locally.

Keywords: Amazon rainforest; climate tipping elements; droughts; network dynamics; tipping cascades.


Conflict of interest statement

The authors declare no competing interest.

Figures

Fig. 1.
Fig. 1.
Nonlinear effects and atmospheric moisture recycling network in the Amazon rainforest. (A) Dynamical property of each 1°×1° grid cell of the rainforest depicted as state of the grid cell versus MAP value. The state of the grid cell is limited by full forest cover (state value: 1.0) and an alternative state (open canopy, dry forest, savanna, treeless state value: –1.0). Between these two stable states, tipping occurs when the MAP value has fallen below its adaptation-specific MAPcrit value. Since we are focusing on drought-induced tipping events from forest to nonforest states in this study, each cell is stable only on the brown states, but not on gray states (since we are not simulating a recovery of the forest). The gray dashed line represents the border separating the upper from the lower stable state (unstable manifold). The blue arrow depicts a potential reduction in precipitation that is sufficient to trigger a tipping event in this specific cell. (B) Same as in A for MCWD. (C) Exemplary atmospheric moisture recycling network, where each forest circle represents a 1°×1° grid cell, whose dynamics are shown in A and B. The different grid cells receive precipitation and experience evapotranspiration. The interaction between the different cells arises from the atmospheric moisture transport from evapotranspiration to precipitation. Through this mechanism, effects of reduced tree cover would be enhanced and tipping cascades are possible. (D) Atmospheric moisture recycling network for the hydrological year 2014 thresholded for links above 15 mm/y to maintain visibility. In the simulation results, links above 1 mm/y are used. The dominant flow direction comes from the Atlantic Ocean through easterly winds, reaches the Andes, and then bends southward along the Andes. Atmospheric moisture recycling links based on separate months and the dry/wet season can be found in SI Appendix, Figs. S1–S3 comparing the year 2014 with the extreme drought year 2010.
Fig. 2.
Fig. 2.
Vulnerability of the rainforest against MCWD-based drought intensity. (A) The total tipped area is shown over the course of the normalized drought index based on the MCWD Ƶ score. The tipped area represents the number of tipped cells in the model where each 1°×1° cell has an area of approximately 111×111km2. (B) Ratio of the tipped area due to network effects for each simulated scenario (new climate normal). This shows the effects of cascading transitions, which can reach orders of 1.5·106 km2 depending on the evaluated scenario representing the hydrological years 2004 to 2014. The same analysis was performed for a MAP-based index (SI Appendix, Fig. S4). A sensitivity analysis for a stronger and a weaker moisture recycling network reveals the robustness of the obtained results (SI Appendix, Fig. S5). Sc., scenario.
Fig. 3.
Fig. 3.
Vulnerable regions and tipping reason. (A) The likelihood of tipping (vulnerability) as an average over all ensemble members and all evaluated scenarios resembling the hydrological years 2004 to 2014. The southeastern region is more vulnerable than other regions, but also the southern and southwestern regions are affected. In SI Appendix, Fig. S6, the yearly results can be found. (B) Overall tipping reason averaged over the entire Amazon basin with error bars as the SD over all years and all 100 ensemble members. A version separated into the future drought scenarios 2004, 2005, , 2014 can be found in SI Appendix, Fig. S7 for all these potential future drought scenarios. MAP does not contribute to tipping events (probability is less than 0.1%) and is thus omitted here. (C) Regionally resolved tipping reason in the case that MCWD is the reason for a tipping event. (D) Same as for C, but showing network effects (cascading effects of the atmospheric moisture recycling network) are the tipping reason. Note that A is the sum of C and D.
Fig. 4.
Fig. 4.
Mean shift toward the tipping point (closeness to tipping). (A) Mean shift to the tipping point as an average over all ensemble members. It can be seen that the shift is larger in the southern part of the Amazon rainforest, meaning that this region is more vulnerable than the northern part. (B) SD of A over all ensemble members. Note that cells are accounted for only if the cell is not in the tipped regime in the respective simulation run. Since the closeness to tipping is translated linearly into a reduction of evapotranspiration, a second color bar indicates this change (A) together with its SD (B). A version separated into the future scenarios resembling the conditions from 2004 to 2014 can be found in SI Appendix, Fig. S8.

Similar articles

Cited by

References

    1. Barlow J., et al. ., The future of hyperdiverse tropical ecosystems. Nature 559, 517–526 (2018). - PubMed
    1. Mitchard E. T. A., The tropical forest carbon cycle and climate change. Nature 559, 527–534 (2018). - PubMed
    1. Nobre C. A., et al. ., Land-use and climate change risks in the Amazon and the need of a novel sustainable development paradigm. Proc. Natl. Acad. Sci. U.S.A. 113, 10759–10768 (2016). - PMC - PubMed
    1. Malhi Y., et al. ., Exploring the likelihood and mechanism of a climate-change-induced dieback of the Amazon rainforest. Proc. Natl. Acad. Sci. U.S.A. 106, 20610–20615 (2009). - PMC - PubMed
    1. Salazar L. F., Nobre C. A., Climate change and thresholds of biome shifts in Amazonia. Geophys. Res. Lett. 37, 17706 (2010).

Publication types

LinkOut - more resources