. 2022 Aug 9;119(32):e2113795119.
doi: 10.1073/pnas.2113795119. Epub 2022 Aug 2.

De novo mutations in KIF1A-associated neuronal disorder (KAND) dominant-negatively inhibit motor activity and axonal transport of synaptic vesicle precursors

Affiliations

De novo mutations in KIF1A-associated neuronal disorder (KAND) dominant-negatively inhibit motor activity and axonal transport of synaptic vesicle precursors

Yuzu Anazawa et al. Proc Natl Acad Sci U S A. .

Abstract

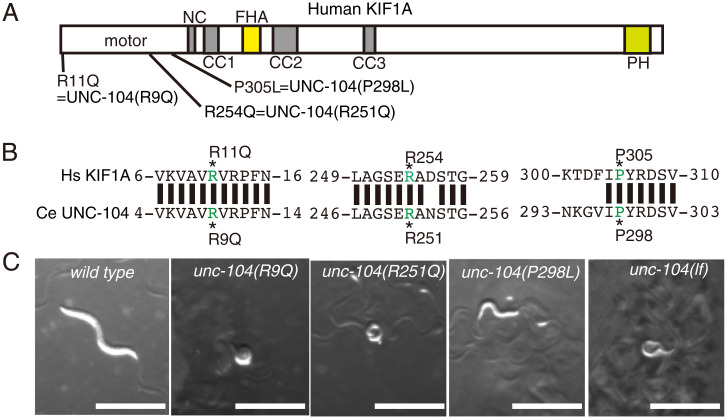
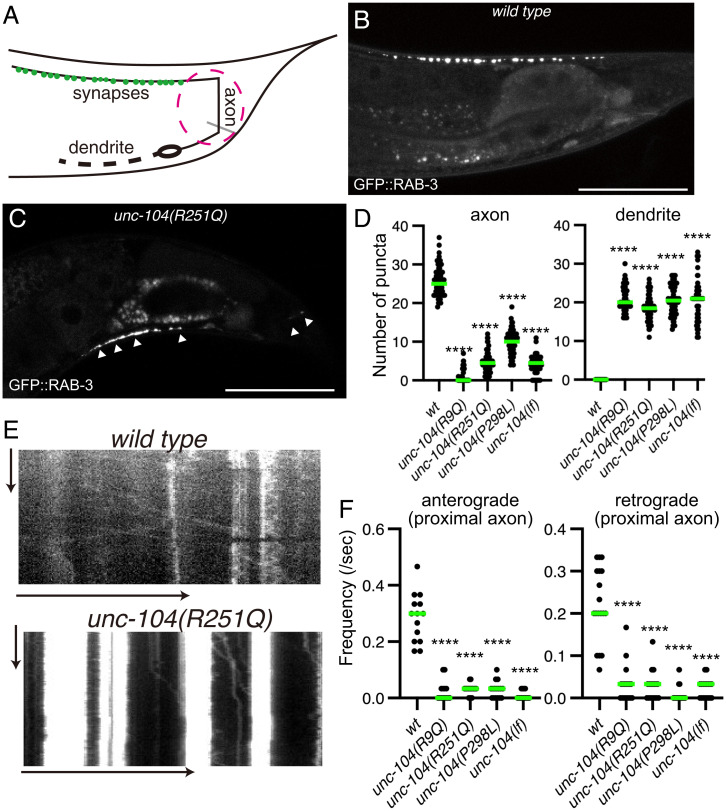
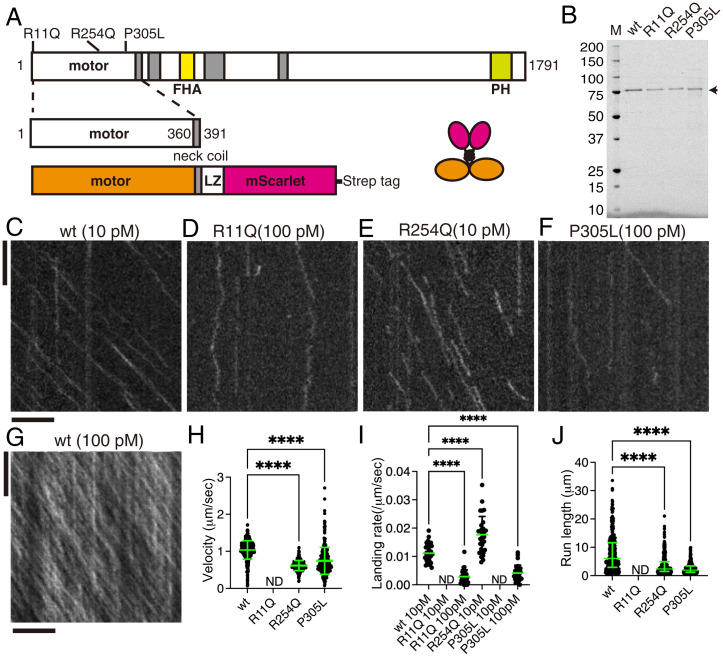
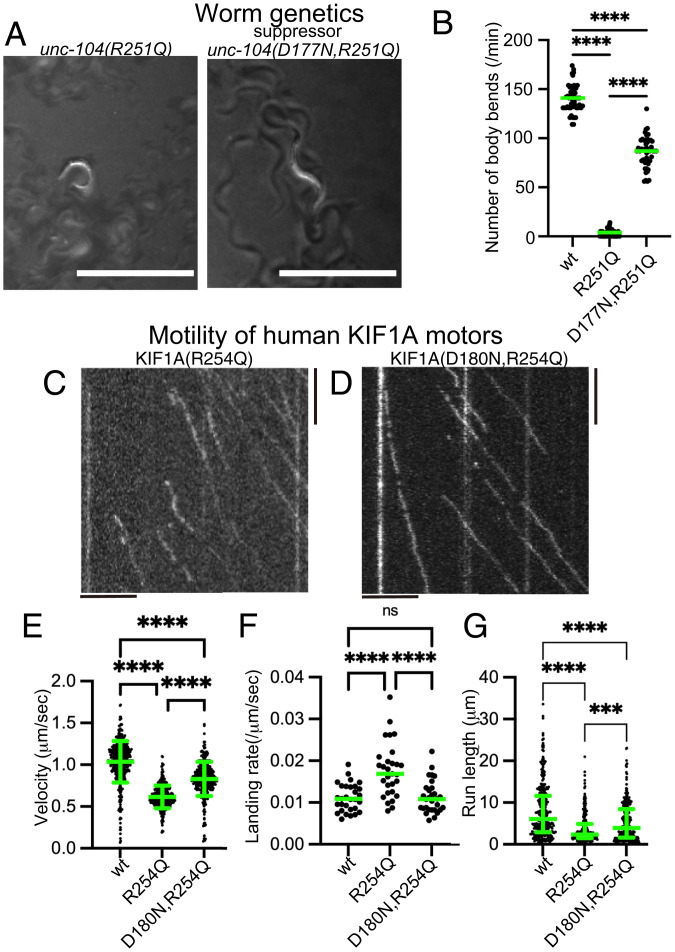
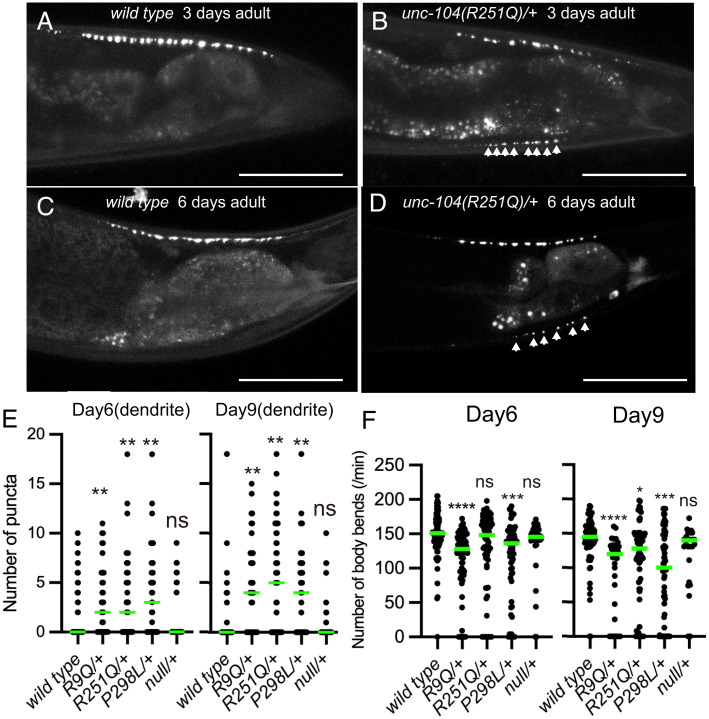
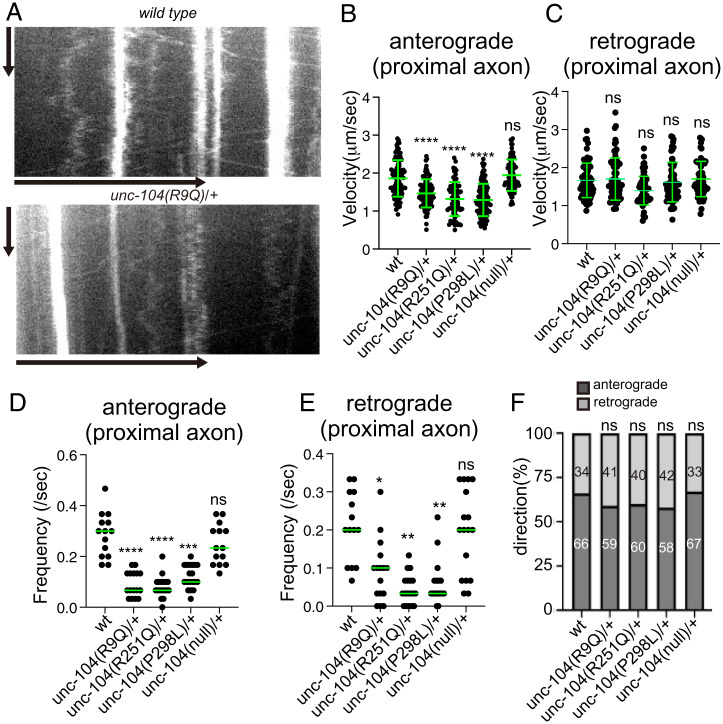
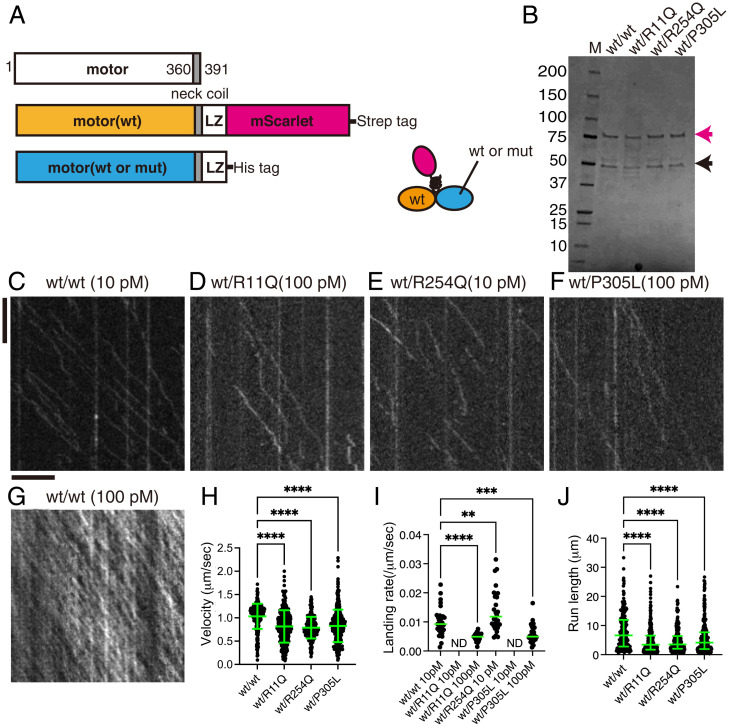
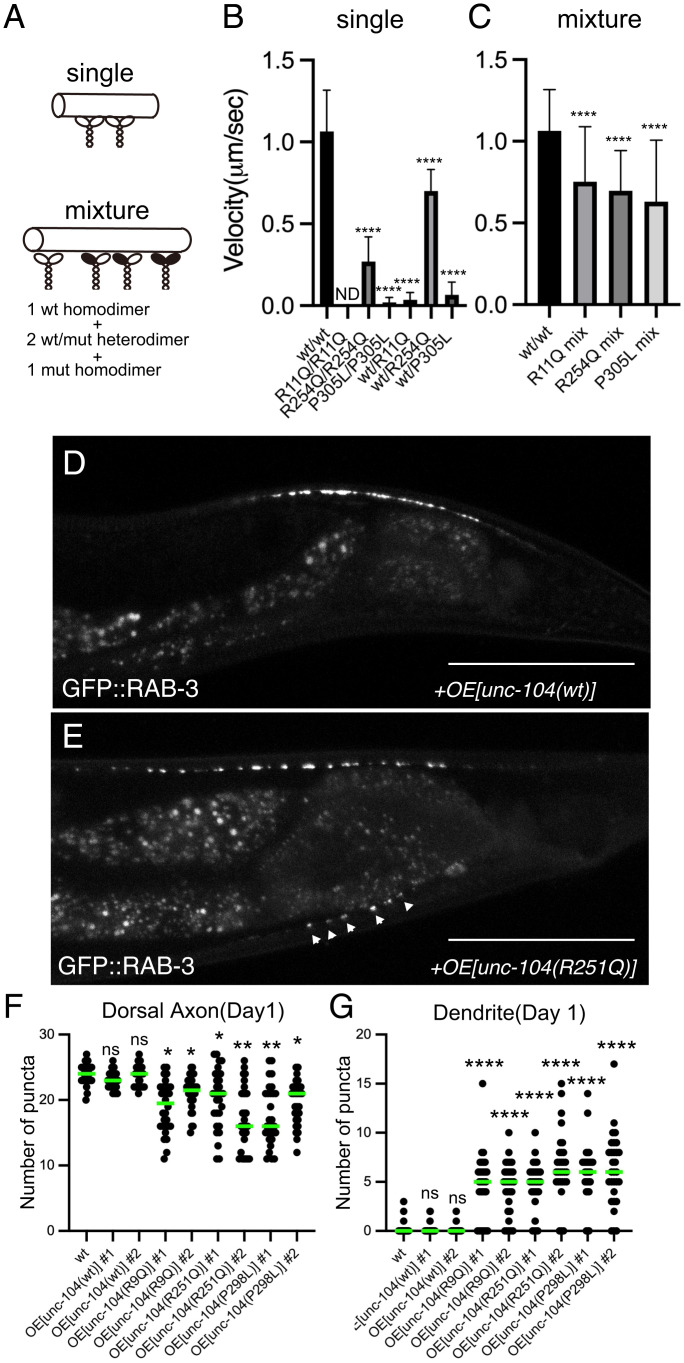
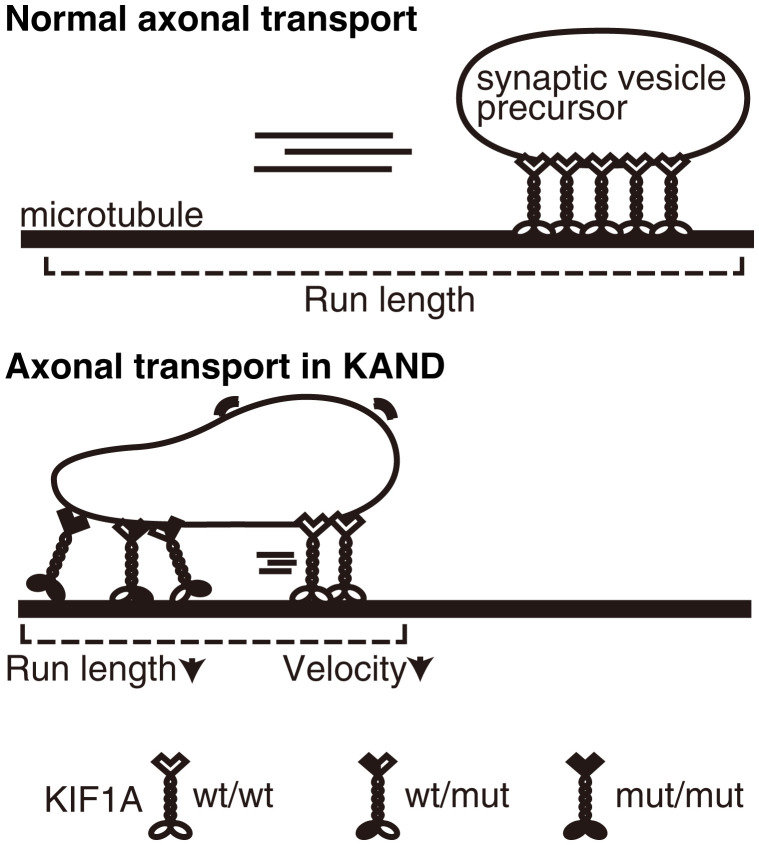
KIF1A is a kinesin superfamily motor protein that transports synaptic vesicle precursors in axons. Cargo binding stimulates the dimerization of KIF1A molecules to induce processive movement along microtubules. Mutations in human Kif1a lead to a group of neurodegenerative diseases called KIF1A-associated neuronal disorder (KAND). KAND mutations are mostly de novo and autosomal dominant; however, it is unknown if the function of wild-type KIF1A motors is inhibited by heterodimerization with mutated KIF1A. Here, we have established Caenorhabditis elegans models for KAND using CRISPR-Cas9 technology and analyzed the effects of human KIF1A mutation on axonal transport. In our C. elegans models, both heterozygotes and homozygotes exhibited reduced axonal transport. Suppressor screening using the disease model identified a mutation that recovers the motor activity of mutated human KIF1A. In addition, we developed in vitro assays to analyze the motility of heterodimeric motors composed of wild-type and mutant KIF1A. We find that mutant KIF1A significantly impaired the motility of heterodimeric motors. Our data provide insight into the molecular mechanism underlying the dominant nature of de novo KAND mutations.

Keywords: KAND; KIF1A; axonal transport; kinesin; synaptic vesicles.


Conflict of interest statement

The authors declare no competing interest.

Figures

Fig. 1.
Fig. 1.
(A) Schematic drawing of the domain organization of KIF1A motor protein. NC, neck coiled-coil domain. CC1, Coiled-coil 1 domain. FHA, Forkhead-associated domain. CC2, Coiled-coil 2 domain. CC3, Coiled-coil 3 domain. The three KAND mutations and corresponding C. elegans UNC-104 mutations analyzed in this study are indicated. (B) Sequence comparison between human KIF1A and C. elegans UNC-104. (C) Macroscopic phenotypes of KAND model homozygotes at 1-d adults. Mutant worms are smaller than wild-type worms and do not move well on the bacterial feeder. Bars, 1 mm. See also SI Appendix, Fig. S1.
Fig. 2.
Fig. 2.
Synaptic vesicle localization in KAND model homozygote worms. (A) Schematic drawing shows the morphology of the DA9 neuron. Green dots along the axon show synaptic vesicle distribution. The red circle shows proximal axon. (B and C) Representative images showing the distribution of synaptic vesicles in the DA9 neuron in wild type (B) and unc-104(R251Q) (C). Synaptic vesicles are visualized by GFP::RAB-3. Arrowheads show mislocalization of synaptic vesicles in the dendrite and proximal axon. Bars, 50 μm. (D) Dot plots showing the number of puncta in the dorsal axon (Left panel) and ventral dendrite (Right panel) of DA9. Green bars represent median value. Kruskal–Wallis test followed by Dunn's multiple comparison test. n = 60 worms for each genotype. ****, Adjusted P value of <0.0001. (E) Representative kymographs in wild type (Upper panel) and unc-104(R251Q) (Lower panel). The axonal transport of synaptic vesicle precursors was visualized by GFP::RAB-3. The proximal axon shown in A was observed. Vertical and horizontal arrows show 10 s and 10 μm, respectively. (F) Dot plots showing the frequency of anterograde axonal transport (Left panel) and retrograde axonal transport (Right panel). Green bars represent median value. Kruskal–Wallis test followed by Dunn’s multiple comparison test. n = 14 wild type, 14 unc-104(R9Q), 18 unc-104(R251Q), 16 unc-104(P298L), and 18 unc-104(lf) axons. ****, Adjusted P value of <0.0001. See also SI Appendix, Fig. S2.
Fig. 3.
Fig. 3.
Single-molecule behavior of disease-associated KIF1A mutants. (A) Schematic drawing of the domain organization of KIF1A motor protein and recombinant protein analyzed in Fig. 3. (B) Purified KIF1A(1–393)::LZ::mScarlet and its mutants were separated by sodium dodecyl-sulfate polyacrylamide gel electrophoresis (SDS-PAGE) and detected by trichloroethanol staining. M represents a marker lane. Numbers on the left indicate molecular weight (kDa). Arrow indicates KIF1A(1–393)::LZ::mScarlet. (CG) Representative kymographs showing the motility of 10 pM KIF1A(wt) (C), 100 pM KIF1A(R11Q) (D), 10 pM KIF1A(R254Q) (E), 100 pM KIF1A(P305L), and 100 pM KIF1A(wt) (G). Vertical and horizontal bars represent 5 s and 5 μm, respectively. (H) Dot plots showing the velocity of KIF1A. Each dot indicates one datum. Green bars represent mean ± SD. Kruskal–Wallis test followed by Dunn’s multiple-comparison test. n = 433 (wt), 325 (R254Q), and 498 (P305L). ****, Adjusted P value of <0.0001. Note that no processive movement was detected for KIF1A(R11Q). ND, not detected. (I) Dot plots showing the landing rate of KIF1A. The number of KIF1A that bound to microtubules was counted and adjusted by the time window and microtubule length. Each dot shows one datum. Green bars represent median value. Kruskal–Wallis test followed by Dunn’s multiple comparison test. n = 30 (10 pM wt), 28 (100 pM R11Q), 29 (10 pM R254Q), and 30 (100 pM P305L) movies. ****, Adjusted P value of <0.0001. Compared with KIF1A(wt). Note that no landing event was detected in 10 pM KIF1A(R11Q) and KIF1A(P305L) experiments. (J) Dot plots showing the run length of KIF1A. Each dot shows one datum. Green bars represent median value and interquartile range. Kruskal–Wallis test followed by Dunn’s multiple comparison test. n = 312 (wt), 241 (R254Q), and 243 (P305L) homodimers. ****, Adjusted P value of <0.0001. Note that all KIF1A motility events were included, including those that end when the motor reaches the end of a microtubule; thus, the reported run lengths are an underestimation of the motor’s processivity. See also SI Appendix, Fig. S3.
Fig. 4.
Fig. 4.
Suppressor screening. (A) Macroscopic phenotypes of unc-104(R251Q) and a suppressor mutant unc-104(D177N, R251Q). While unc-104(R251Q) worms do not move well on the bacterial feeder, unc-104(D177N, R251Q) worms move smoothly. Bars, 1 mm. (B) Dot plots showing the result of swim test. The number of body bends in a water drop was counted for 1 min and plotted. Dots represents the number of bends from each worm. Green bars represent median value. Kruskal–Wallis test followed by Dunn’s multiple comparison test. n = 20 worms for each genotype. ****, Adjusted P value of <0.0001. (C and D) Representative kymographs showing the motility of 10 pM human KIF1A(R254Q) protein (C) and KIF1A(D180N, R254Q) protein (D) on microtubules. Vertical and horizontal bars represent 5 s and 5 μm, respectively. (E) Dot plots showing the velocity of KIF1A. Dot shows the actual value from each data point. Green bars represent mean ± SD. Kruskal–Wallis test followed by Dunn’s multiple comparison test. n = 433 (wt), 325 (R254Q), and 368 (D180N, R254Q). ****, Adjusted P value of <0.0001. (F) Dot plots showing the landing rate of KIF1A. The number of KIF1A that bound to microtubules was counted and adjusted by the time window and microtubule length. Green bars represent median value. Kruskal–-Wallis test followed by Dunn’s multiple comparison test. n = 30 (10 pM wt), 29 (10 pM R254Q), and 30 (10 pM D180N, R254Q). ****, Adjusted P value of <0.0001. (G) Dot plots showing the run length of KIF1A. Green bars represent median value and interquartile range. Kruskal–Wallis test followed by Dunn’s multiple comparison test. n = 312 (wt), 241 (R254Q), and 312 (D180N, R254Q) homodimers. ****, Adjusted P value of <0.0001. Note that the reported run lengths are an underestimation of the motor’s processivity. as described in Fig. 3J and that KIF1A(wt) and KIF1A(R254Q) values are the same with Fig. 3. See also SI Appendix, Fig. S4.
Fig. 5.
Fig. 5.
Synaptic vesicle localization of heterozygotes. (AD) Representative images showing synaptic vesicle distribution in 3-d wild-type adult (A), 3-d unc-104(R251Q)/+ adult (B), 6-d wild-type adult (C), and 6-d unc-104(R251Q)/+ adult (D). Synaptic vesicles are visualized by GFP::RAB-3. Arrowheads show mislocalization of synaptic vesicles in the dendrite. Bars, 50 μm. (E) Dot plots showing the number of dendritic puncta at 6 and 9 d. Each dot shows the number of puncta in the dendrite in each worm. Green bars represent median value. Kruskal–Wallis test followed by Dunn’s multiple comparison test. n = 59 (wt), 36 (R9Q/+), 46 (R251Q/+), 39 (P298L/+), and 40 (null/+) (6-d adult worms); 58 (wt), 38 (R9Q/+), 49 (R251Q/+), 40 (P298L/+), and 43 (null/+) (9-d adult worms). ns, adjusted P value of >0.05 and statistically not significant. **, Adjusted P value of <0.01. (F) Dot plots showing the result of swim test at 6 and 9 d. Each dot shows the number of bends in each measurement. Green bars represent median value. Kruskal–Wallis test followed by Dunn’s multiple comparison test. n = 76 (wt), 87 (R9Q/+), 74 (R251Q/+), 65 (P298L/+), and 38 (null/+) (6-d adult worms); 66 (wt), 30 (R9Q/+), 65 (R251Q/+), 67 (P298L/+), and 27 (null/+) (9-d adult worms). ns, adjusted P value of >0.05 and statistically not significant. *, Adjusted P value of <0.05. **, Adjusted P value of <0.01. ****, Adjusted P value of <0.0001. See also SI Appendix, Fig. S5.
Fig. 6.
Fig. 6.
Axonal transport in KAND model heterozygotes (A) Representative kymographs showing axonal transport of synaptic vesicle precursors in wild type and unc-104(R9Q)/+ at 1 d adults. GFP::RAB-3 was used as a marker. Vertical and horizontal bars show 10 s and 10 μm, respectively. (B and C) The velocity of axonal transport. The velocity of anterograde transport (B) and retrograde transport (C) are shown as dot plots. (B) Kruskal–Wallis test followed by Dunn’s multiple comparison test. Green bars show mean ± SD n = 94 (wild type), 90 (R9Q/+), 66 (R251Q/+), 117 (P298L/+) and 84 (null/+) vesicles from at least 5 independent worms. ns, Adjusted P value > 0.05 and no significant statistical difference. ****, Adjusted P value < 0.0001. (C) Kruskal-Wallis test followed by Dunn's multiple comparison test. Green bars show mean ± SD; n = 70 (wild type), 70 (R9Q/+), 68 (R251Q/+), 63 (P298L/+), and 65 (null/+) vesicles from at least 5 independent worms. ns, adjusted P value of >0.05 and no significant statistical difference. (D and E) Frequency of axonal transport. The frequency of anterograde transport (D) and retrograde transport (E) are shown as dot plots. (E) Kruskal–Wallis test followed by Dunn’s multiple comparison test. Each dot represent data from each worm. Green bars represent median value. n = 14 (wt), 16 (R9Q/+), 18 (R251Q/+), and 19 (P298L/+) independent worms. ****, Adjusted P value of <0.0001. (E) Kruskal–Wallis test followed by Dunn’s multiple comparison test. Each dot represent data from each worm. Green bars represent median value. n = 14 (wt), 16 (R9Q/+), 18 (R251Q/+), and 19 (P298L/+) independent worms. **, Adjusted P value of <0.01; ****, Adjusted P value of <0.0001. (F) Directionality of vesicle movement. The number in the bar graph shows the actual percentage. ns, Adjusted P value of >0.05 and statistically not significant. χ2 test. Compared to wt worms. See also SI Appendix, Fig. S6.
Fig. 7.
Fig. 7.
The single-molecule behavior of wild-type/mutant KIF1A heterodimers. (A) Schematic drawing of the recombinant KIF1A heterodimer analyzed. (B) Purified KIF1A(1–393)::LZ::mScarlet/KIF1A(1–393)::LZ heterodimers were separated by SDS-PAGE and detected by Coomassie brilliant blue staining. M represents marker. Numbers on the left indicate the molecular weight (kDa). Magenta and black arrows indicate KIF1A(1–393)::LZ::mScarlet and KIF1A(1–393)::LZ, respectively. (CG) Representative kymographs showing the motility of 10 pM KIF1A (wt) (C), 100 pM KIF1A(R11Q) (D), 10 pM KIF1A(R254Q) (E), 100 pM KIF1A(P305L) (F), and 100 pM KIF1A (wt) (G). Vertical and horizontal bars represent 5 s and 5 μm, respectively. (H) Dot plots showing the velocity of KIF1A. Each dot shows a single datum point. Green bars represent mean ± SD. Kruskal–Wallis test followed by Dunn’s multiple comparison test. n = 308 (wt/wt), 315 (wt/R11Q), 294 (wt/R254Q), and 414 (wt/P305L) heterodimers. ****, Adjusted P value of <0.0001. (I) Dot plots showing the landing rate of KIF1A. The number of KIF1A that binds to microtubules was counted and adjusted by the time window and microtubule length. Each dot shows a single datum point. Green bars represent median value. Kruskal–Wallis test followed by Dunn’s multiple comparison test. n = 29 (10 pM wt/wt), 29 (100 pM wt/R11Q), 28 (10 pM wt/R254Q),and 38 (100 pM wt/P305L) independent observations. **, Adjusted P value of <0.01; ***, adjusted P value of <0.001; ****, adjusted P value of <0.0001. (J) Dot plots showing the run length of KIF1A. Each dot shows a single datum point. Green bars represent median value and interquartile range. Kruskal–Wallis test followed by Dunn’s multiple comparison test. n = 215 (wt/wt), 241 (wt/R11Q), 195 (wt/R254Q), and 266 (wt/P305L) heterodimers. ****, Adjusted P value of <0.0001. Note that the reported run lengths are an underestimation of the motor’s processivity as described in Fig. 3J. See also SI Appendix, Fig. S7.
Fig. 8.
Fig. 8.
Dominant-negative nature of KAND mutations. (AC) Microtubule gliding assays. Schematic drawing of the microtubule gliding assay in different conditions (A). (B) Microtubule gliding assays using single motors. Bars and error bars represent mean and SD, respectively. n = 146 (30 nM wt homodimers), 112 (30 nM R254Q homodimers), 20 (100 nM P305L homodimers), 59 (30 nM wt/R11Q heterodimers), 130 (30 nM wt/R254Q heterodimers), and 43 (30 nM wt/P305L heterodimers) microtubules from at least 3 independent experiments. Note that ND means no microtubule movement was observed in 100 nM KIF1A(R11Q) homodimers. Kruskal–Wallis test followed by Dunn;s multiple comparison test. ****, P < 0.0001. (C) Microtubule gliding assays using mixed motors. Bars and error bars represent mean and SD, respectively. n = 146 (30 nM wt), 102 (30 nM R11Q mixture), 134 (30 nM R254Q mixture), and 108 (30 nM P305L mixture) microtubules. Kruskal–Wallis test followed by Dunn’s multiple comparison test. ****, P < 0.0001. (DG) UNC-104(wt), UNC-104(R9Q), UNC-104(R251Q), and UNC-104(P298L) were overexpressed in the wild-type background, and the localization of synaptic vesicles was observed. (D and E) Representative images showing the localization of synaptic vesicles in UNC-104(wt)-expressing worm (D) and UNC-104(R251Q)-expressing worm (E). Arrowheads show synaptic-vesicle-accumulated puncta that are mislocalized in the dendrite. Bars, 50 μm. (F and G) Dot plots showing the number of ventral axonal and dorsal dendritic puncta at 1 d. Each dot shows the number of puncta in the dorsal axon (F) and ventral dendrite (G) in each worm. Green bars represent median value. n = 30 worms from each strain. Kruskal–Wallis test followed by Dunn’s multiple comparison test. ns, adjusted P value of >0.05 and no significant statistical difference. *, Adjusted P value of <0.05. **, Adjusted P value of <0.01. ****, Adjusted P value of < 0.0001. See also SI Appendix, Fig. S8.
Fig. 9.
Fig. 9.
Model schematic drawing showing how vesicular transport is suppressed in KAND patient axons. Not only mutant homodimers but also wild-type/mutant heterodimers inhibit axonal transport of synaptic vesicle precursors.

References

    1. Hirokawa N., Noda Y., Tanaka Y., Niwa S., Kinesin superfamily motor proteins and intracellular transport. Nat. Rev. Mol. Cell Biol. 10, 682–696 (2009). - PubMed
    1. Hirokawa N., Niwa S., Tanaka Y., Molecular motors in neurons: Transport mechanisms and roles in brain function, development, and disease. Neuron 68, 610–638 (2010). - PubMed
    1. Kardon J. R., Vale R. D., Regulators of the cytoplasmic dynein motor. Nat. Rev. Mol. Cell Biol. 10, 854–865 (2009). - PMC - PubMed
    1. Vale R. D., Reese T. S., Sheetz M. P., Identification of a novel force-generating protein, kinesin, involved in microtubule-based motility. Cell 42, 39–50 (1985). - PMC - PubMed
    1. Tanaka Y., et al. , Targeted disruption of mouse conventional kinesin heavy chain, kif5B, results in abnormal perinuclear clustering of mitochondria. Cell 93, 1147–1158 (1998). - PubMed

Publication types

LinkOut - more resources