. 2022 Aug 9;119(32):e2202371119.
doi: 10.1073/pnas.2202371119. Epub 2022 Aug 2.

Protective anti-gB neutralizing antibodies targeting two vulnerable sites for EBV-cell membrane fusion

Affiliations

Protective anti-gB neutralizing antibodies targeting two vulnerable sites for EBV-cell membrane fusion

Xiao Zhang et al. Proc Natl Acad Sci U S A. .

Abstract

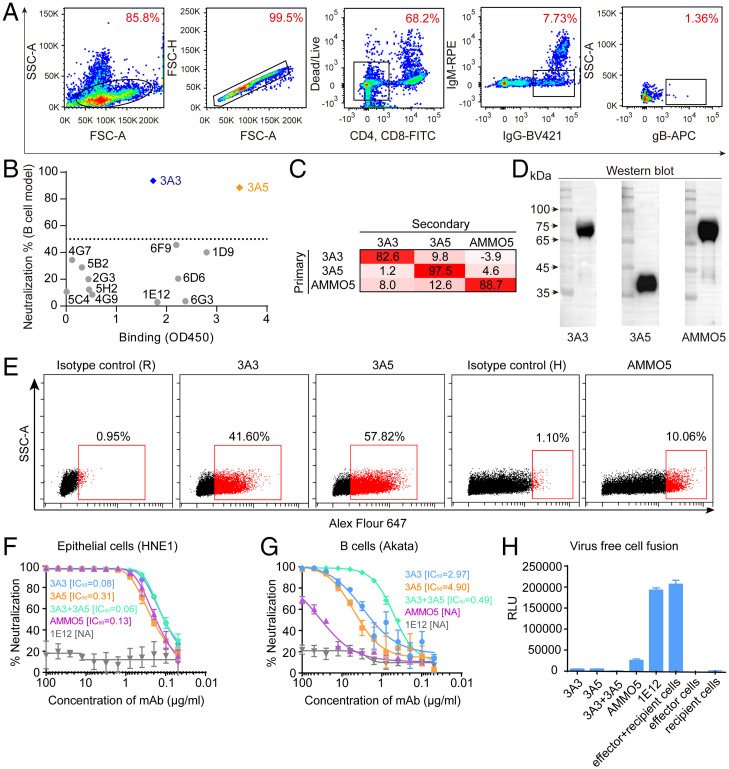
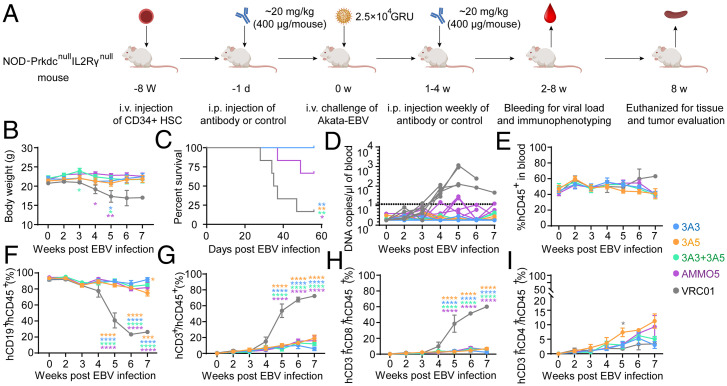
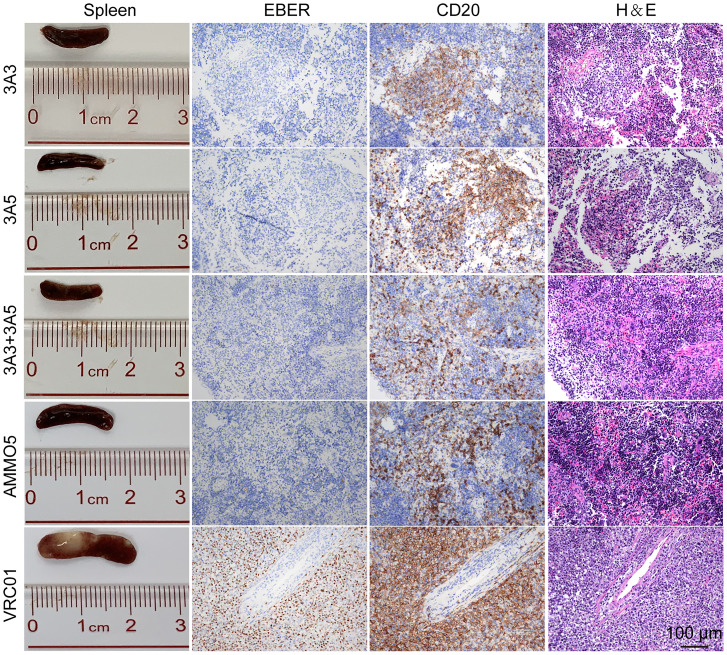
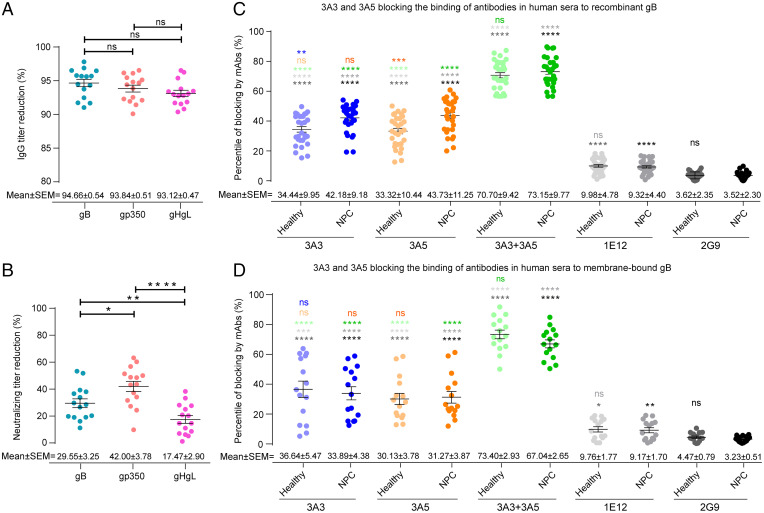
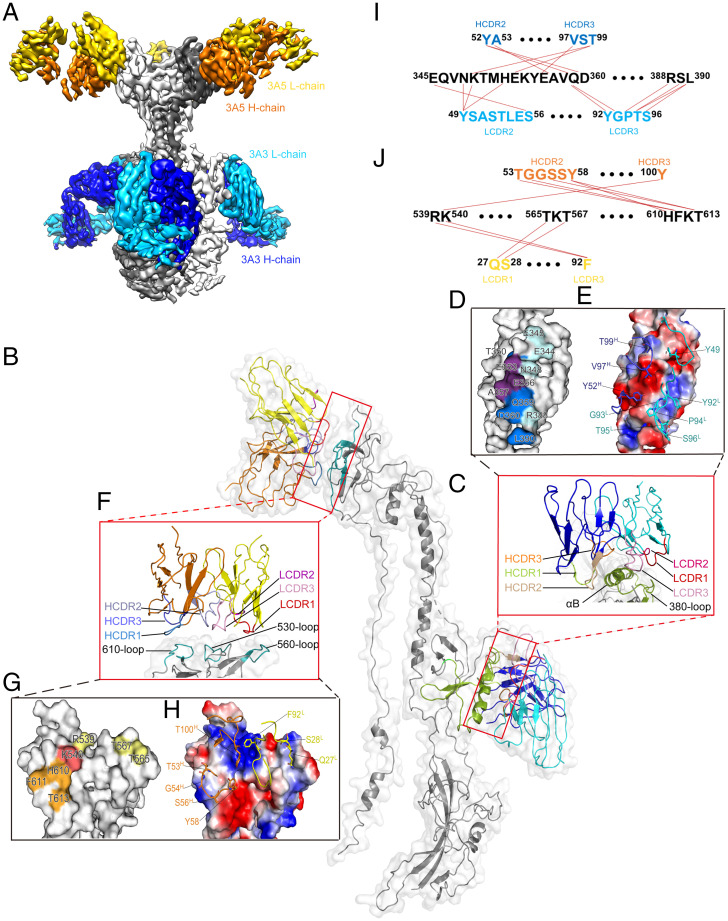
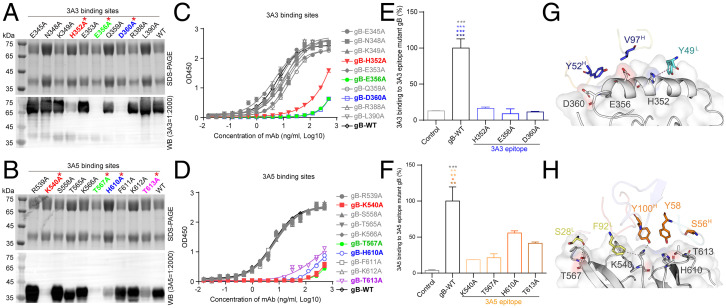
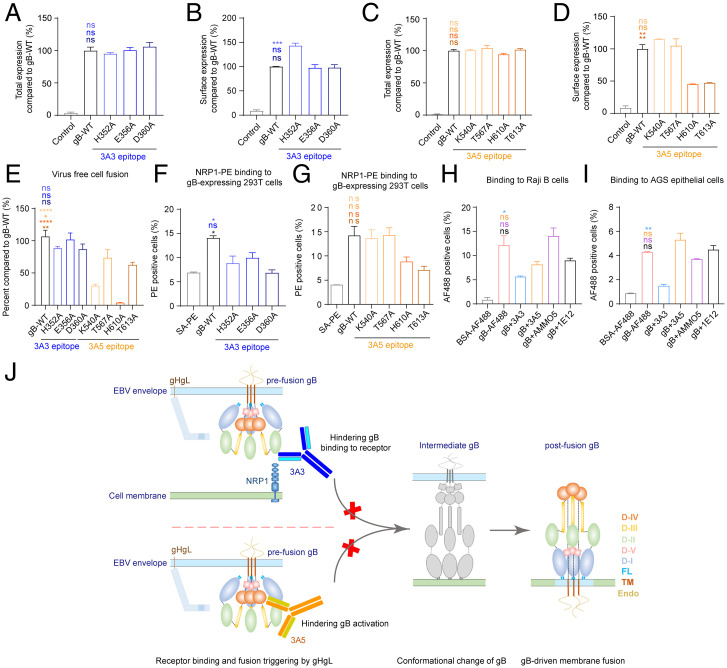
Epstein-Barr virus (EBV) infects more than 90% of the world's adult population and accounts for a significant cancer burden of epithelial and B cell origins. Glycoprotein B (gB) is the primary fusogen essential for EBV entry into host cells. Here, we isolated two EBV gB-specific neutralizing antibodies, 3A3 and 3A5; both effectively neutralized the dual-tropic EBV infection of B and epithelial cells. In humanized mice, both antibodies showed effective protection from EBV-induced lymphoproliferative disorders. Cryoelectron microscopy analyses identified that 3A3 and 3A5 bind to nonoverlapping sites on domains D-II and D-IV, respectively. Structure-based mutagenesis revealed that 3A3 and 3A5 inhibit membrane fusion through different mechanisms involving the interference with gB-cell interaction and gB activation. Importantly, the 3A3 and 3A5 epitopes are major targets of protective gB-specific neutralizing antibodies elicited by natural EBV infection in humans, providing potential targets for antiviral therapies and vaccines.

Keywords: Epstein–Barr virus; glycoprotein B; lymphoproliferative disorder; neutralizing antibody; viral membrane fusion.


Conflict of interest statement

The authors declare no competing interest.

Figures

Fig. 1.
Fig. 1.
Isolation and evaluation of the binding and neutralizing abilities of 3A3 and 3A5. (A) FACS-based staining and gating strategy to sort gB-specific B cells from peripheral blood mononuclear cells derived from a gB-immunized rabbit. (B) Binding and neutralizing activities of 13 mAbs cloned from B cells sorted using the approach in A. The binding activities (x axis; optical density at 450 nm (OD450)) with the recombinant ect-gB were evaluated by ELISA. The neutralizing activities (y axis; percentage neutralization) of 13 mAbs were evaluated by the B cell infection model. The neutralization percentage indicates the neutralizing potency of mAbs blocking the EBV infection of Akata B cells. The formula is neutralization percentage = 1 − the percentage of infected cells with serum or mAb/the percentage of infected cells without serum or mAb × 100%. (C) Cross-competition of mAbs 3A3, 3A5, and AMMO5 was measured by competitive ELISA. The inhibition of the binding of secondary antibody to gB by the primary antibody is shown. In the competitive ELISA, immobilized recombinant gB was presaturated with the primary antibodies, and then, the binding of secondary antibodies, 3A3-HRP (horseradish peroxidase), 3A5-HRP, and AMMO5-HRP, was measured. (D) WB analysis of 3A3, 3A5, and AMMO5 for their activities to ect-gB under reducing sodium dodecyl sulfate-polyacrylamide gel electrophoresis (SDS-PAGE). 3A3 and AMMO5 bound the ∼70-kDa fragment, and 3A5 bound the ∼40-kDa fragment. (E) Detection of 3A3 or 3A5 binding to total gB of EBV-positive Akata B cells postinduction of the viral lytic cycle using flow cytometry. AMMO5 was used as a control. Flow cytometry staining was performed with cell membrane permeabilization. (F and G) Neutralization of Akata-EBV infection of HNE1 epithelial cells (F) and CNE2-EBV infection of Akata B cells (G) by serial dilutions of anti-gB antibodies, 3A3, 3A5, the combination of 3A3 + 3A5, AMMO5, and 1E12 (nonneutralizing antibody, negative control). Half maximal inhibitory concentration (IC50) values were calculated by sigmoid trend fitting. Data points are shown as the mean of two replicates ± SEM. (H) Blockade of cell-cell fusion by anti-gB antibodies. The nonneutralizing anti-gB antibody 1E12 was used as a negative control. HEK-293T effector cells were transfected with expression plasmids encoding gB, gHgL, and T7 polymerase. HEK-293T recipient cells were transfected with the pT7EMCLuc plasmid expressing luciferase under the control of T7 polymerase. Effector and recipient cells were mixed in the presence or absence of antibodies, and luciferase activity was measured. Data points are shown as the mean of two independent replicates ± SEM. APC, allophycocyanin. SSC-A, side scatter area. FSC-A, forward scatter area. RPE, R.Phycoerythrin. FITC, fluorescein Isothiocyanate. NA, not available. RLU, relative light unit.
Fig. 2.
Fig. 2.
3A3 and 3A5 conferred protection against lethal EBV challenge in humanized mice. (A) Experimental time line for antibody administration, EBV challenge, and monitoring for various biological and clinical outcomes. A total of 400 μg of 3A3, 3A5, 3A3 + 3A5, AMMO5, and VRC01 (negative control; n = 6 for each group) were administered to the NPI mice via i.p. injection 24 h prior to i.v. challenge with 25,000 GRU (green raji units) of Akata-EBV and followed by an additional weekly antibody treatment of the same dose for 4 wk. (BD) Body weight (B), survival (C), and EBV DNA copies (D) in the peripheral blood of mice were monitored during the experiment. Each line in D represents an individual mouse, and the dashed line indicates the detection limit. (E-I) The percentage changes of hCD45+ (E), hCD19+ (F), hCD3+ (G), hCD8+ (H), and hCD4+ (I) cells in the peripheral blood during the experiment. Data points and error bars in B and D-I represent the mean values and SEMs of the data from the surviving mice at that time point. Data schematics for 3A3, 3A5, 3A3 + 3A5, AMMO5, and VRC01 are colored blue, yellow, green, purple, and black, respectively. Statistical analyses were performed using one-way ANOVA. The color of the asterisks denotes the group with which there is a significant difference from the VRC01 control group determined by a Sidak multiple comparison test. The yellow asterisk in F indicates a significant difference between the 3A3-treated and 3A5-treated groups determined by a Sidak multiple comparison test. *P ≤ 0.0332; **P ≤ 0.0021; ***P ≤ 0.0002; ****P ≤ 0.0001. HSC, hematopoietic stem cells. Schematic diagram was made with BioRender.com.
Fig. 3.
Fig. 3.
3A3 and 3A5 protected humanized mice from EBV-induced LPDs. Representative macroscopic spleen and spleen tissue stained for H&E, EBER, and hCD20+ at necropsy. Each image is representative of the experimental group. (Scale bar: 100 μm.)
Fig. 4.
Fig. 4.
Evaluation of 3A3- or 3A5-like antibodies in human sera. (A) Reduction in glycoprotein-specific immunoglobulin G (IgG) titers after the specific depletion of antibodies against gB, gp350, or gHgL in sera from 15 healthy adult individuals was evaluated by each glycoprotein-based ELISA. The IgG titers were calculated by the end point dilution method, and OD450 = 0.1 was set as the cutoff value. The percentage of IgG titer reduction was calculated by the equation (1 − IgG titer-depleted/IgG titer-before) × 100%, where IgG titer-depleted is each glycoprotein-specific IgG titer of the serum after the specific antibody depletion and IgG titer-before is each glycoprotein-specific serum IgG titer before depletion. (B) Reduction in neutralizing ability after the specific depletion of over 90% of anti-gB, -gp350, or -gHgL IgG antibodies in sera from 15 healthy adult individuals was evaluated by the EBV infection of Akata B cells. The reduction in the neutralizing titer after the specific antibody depletion was calculated by the equation (1 − IC50-depleted/IC50-before) × 100%, where IC50-depleted is the neutralizing titer of the serum depleted by specific glycoprotein-expressed 293T cells and IC50-before is the neutralizing titer of the serum before depletion. (C) Blocking naturally acquired anti-gB antibodies by 3A3 and 3A5 in human sera from binding to recombinant gB was evaluated by competitive ELISA. Sera from 30 healthy adult individuals and 30 patients who were nasopharyngeal carcinoma (NPC) positive for EBV viral capsid antigen (VCA)-IgG, VCA-IgA, early antigen (EA)-IgA, and Epstein-Barr nuclear antigen 1 (EBNA1)-IgA were used. The anti-gB mAbs 3A3, 3A5, 3A3 + 3A5, and 1E12 and an antiinfluenza HA antibody 2G9 (negative control) were used to block the immobilized recombinant gB. The OD values of each serum were determined by ELISA before and after mAb treatment. The blocking ratio of the mAb against each serum was calculated as 1 − (OD value of the serum binding to recombinant gB treated with mAb/OD value of the serum binding to recombinant gB without mAb treatment) × 100%. (D) Blocking naturally acquired anti-gB antibodies in human sera by 3A3 and 3A5 binding to membrane-bound gB expressed by 293T cells was evaluated by flow cytometry. Sera from 15 healthy adult individuals and 15 patients with NPC, tested in C, were used in the antibody blocking assays with membrane-bound gB. The anti-gB mAbs, 3A3, 3A5, their combination, and 1E12, were incubated with gB-expressed 293T cells prior to the incubation with human sera. The anti-influenza HA mAb 2G9 was used as a negative control. After incubation with human sera, cells without membrane permeabilization were stained with the AF647 goat anti-human IgG antibody to detect serum antibody binding to the cell surface by flow cytometry. The blocking ratio of the mAb against each serum was calculated as 1 − (percentage of AF647-positive cells incubated with mAb/percentage of AF647-positive cells without mAb incubation) × 100%. Error bars represent the SEM for each experimental group. P values from the unpaired Welch’s t tests are indicated (significant difference is indicated by asterisks). ns, no significant difference. *P ≤ 0.0332; **P ≤ 0.0021; ***P ≤ 0.0002; ****P ≤ 0.0001.
Fig. 5.
Fig. 5.
Structure determination of gB:3A3Fab:3A5Fab by cryo-EM. (A) Side view of the 3.9-Å cryo-EM structure of gB:3A3Fab:3A5Fab. gB, 3A3Fab, and 3A5Fab are colored gray, blue, and yellow, respectively. (B) Segmentation of monomeric gB binding with one 3A3Fab and one 3A5Fab. The key elements of D-II and D-IV of gB involved in antigen-antibody interactions are colored green and cyan, respectively. 3A3Fab and 3A5Fab are colored blue and yellow, respectively. (C-E) The interface of gB with 3A3Fab. The CDRs of the VH and VL and the gB’s αB-helix and 380 loop are shown differently (C). The residues involved in the 3A3 interactions are mapped on the gB surface, including E344, E345, N348, T350, E353, E356, A357, Q359, D360, R388, and L390 (D). The key residues localized at the VH and VL are labeled, including Y49L, Y92L, G93L, P94L, T95L, S96L, Y52H, V97H, and T99H (E). (F-H) The interface of gB with 3A5Fab. The CDRs of the VH and VL and the 530 loop, 560 loop, and 610 loop of gB are shown with different colors (F). The key residues involved in the 3A5 interactions are mapped on the gB surface, including R539, K540, T565, T567, H610, F611, and T613 (G). The key residues localized at the VH and VL are labeled, including Q27L, S28L, F92L, T53H, G54H, S56H, Y58H, and T100H (H). (I and J) Molecular interactions between gB and the VH and VL of mAbs 3A3 (I) and 3A5 (J).
Fig. 6.
Fig. 6.
Validation of key residues located at the gB:3A3 and gB:3A5 interfaces. (A and B) Reducing sodium dodecyl sulfate-polyacrylamide gel electrophoresis (SDS-PAGE) and WB of purified recombinant mutant and gB-WT proteins as indicated with anti-gB antibodies 3A3 (A) and 3A5 (B). (C and D) The binding activities of the mutant and gB-WT to 3A3 (C) and 3A5 (D) were determined by ELISA. (E and F) The 293T cells bound with 3A3 (E) or 3A5 (F) were stained with the AF647 goat anti-rabbit IgG secondary antibody and measured by flow cytometry. The 293T cells expressing full-length gB-WT, 3A3, or 3A5 epitope mutants and the control cells transfected with the empty vector are indicated. Antibody staining was performed without cell membrane permeabilization. The level of antibody binding to 293T cells expressing gB-WT and each gB mutant was first normalized to the membrane expression level of gB-WT and each gB mutant, respectively, and then, all values were normalized as a percentage to gB-WT. Statistical analyses were performed using one-way ANOVA. Data in C-F are represented as the mean of two independent replicates ± SEM. (G and H) Key amino acid interactions at the gB:3A3 (E) and gB:3A5 (F) interfaces. The color of the asterisks denotes the group with which there is a significant difference determined by a Sidak multiple comparison test. *P ≤ 0.0332; **P ≤ 0.0021; ***P ≤ 0.0002. Red asterisks represent key residues recognized by 3A3 and 3A5.
Fig. 7.
Fig. 7.
3A3 and 3A5 binding sites at gB D-II and D-IV are critical for cell binding and fusion. (A-D) The total expression and cell surface expression levels of gB-WT and gB 3A3 mutants (A and B) or 3A5 mutants (C and D) produced by transfected 293T cells were measured with mAb 3A5 (A and B) and mAb 3A3 (C and D) by flow cytometry, respectively. Antibody staining was performed with cell membrane permeabilization when the total expression was evaluated in A and C. Antibody staining was performed without cell membrane permeabilization when cell surface expression was evaluated in B and D. All values were normalized as a percentage to gB-WT. (E) Cell-cell fusion efficiency of gB-WT and gB mutants. All values were normalized as a percentage to gB-WT. (F and G) The binding of NRP1 to 293T cells expressing gB-WT, 3A3 epitope mutants (F), or 3A5 epitope mutants (G) of gB was evaluated by flow cytometry without cell membrane permeabilization. Cells stained with SA-PE alone were used as a negative control. (H and I) The binding of gB to Raji B cells (H) and AGS gastric adenocarcinoma epithelial cells (I) in the presence of anti-gB antibodies was evaluated by flow cytometry without cell membrane permeabilization. Bovine serum albumin (BSA)-AF488 and gB-AF488 were used as negative and positive controls, respectively. (J) Proposed schematic diagram of neutralizing mechanisms of 3A3 and 3A5. 3A3 blocks gB binding to its coreceptor NRP1 by directly restricting access to the interface. The binding of 3A5 to D-IV could restrict the movement of the gB trimer during conformational changes from pre- to postfusion by steric hindrance. It is also possible that the binding of 3A3 and 3A5 could bring steric hindrance that inhibits the triggering of gB activation by gHgL. Data are represented as the mean of two independent replicates ± SEMs. Statistical analyses were performed using one-way ANOVA. The color of the asterisks denotes the group with which there is a significant difference determined by a Sidak multiple comparison test. ns, no significant difference. *P ≤ 0.0332; **P ≤ 0.0021; ***P ≤ 0.0002; ****P ≤ 0.0001. SA-PE, streptavidin-phycoerythrin. PE, phycoerythrin. FL, fusion loop. TM, transmembrane domain. Endo, endodomain.

Similar articles

Cited by

References

    1. Shannon-Lowe C., Rickinson A., The global landscape of EBV-associated tumors. Front. Oncol. 9, 713 (2019). - PMC - PubMed
    1. Cohen J. I., Fauci A. S., Varmus H., Nabel G. J., Epstein-Barr virus: An important vaccine target for cancer prevention. Sci. Transl. Med. 3, 107fs7 (2011). - PMC - PubMed
    1. Shindiapina P., Ahmed E. H., Mozhenkova A., Abebe T., Baiocchi R. A., Immunology of EBV-related lymphoproliferative disease in HIV-positive individuals. Front. Oncol. 10, 1723 (2020). - PMC - PubMed
    1. Chen J., Longnecker R., Epithelial cell infection by Epstein-Barr virus. FEMS Microbiol. Rev. 43, 674–683 (2019). - PMC - PubMed
    1. Hutt-Fletcher L. M., EBV glycoproteins: Where are we now? Future Virol. 10, 1155–1162 (2015). - PMC - PubMed

Publication types

MeSH terms

LinkOut - more resources