

Cold-induced metabolic depression in cunner (Tautogolabrus adspersus): A multifaceted cellular event
- PMID: 35917356
- PMCID: PMC9345476
- DOI: 10.1371/journal.pone.0271086
Cold-induced metabolic depression in cunner (Tautogolabrus adspersus): A multifaceted cellular event
Abstract
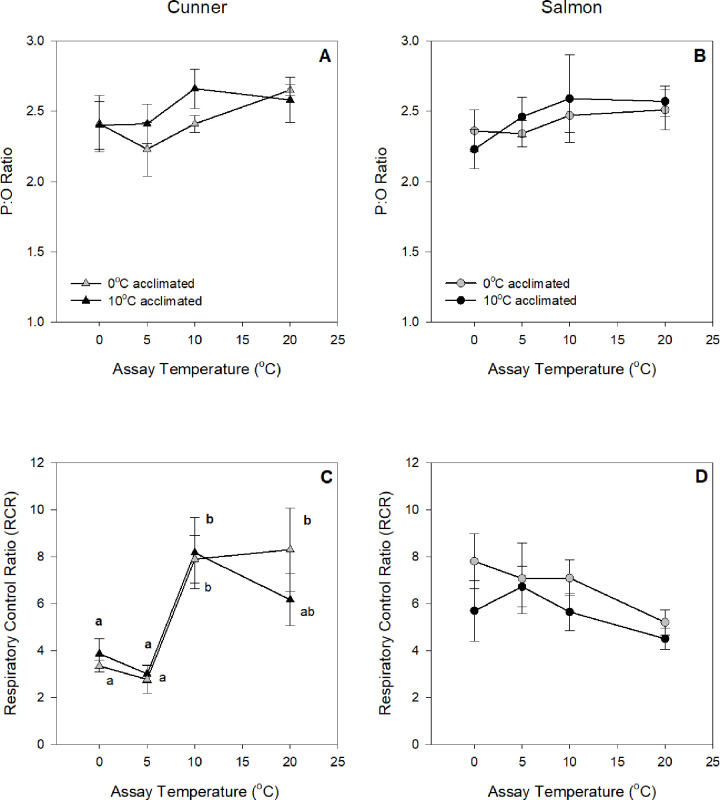
Metabolic depression and dormancy (i.e., stopping/greatly reducing activity and feeding) are strategies used by many animals to survive winter conditions characterized by food shortages and cold temperatures. However, controversy exists on whether the reduced metabolism of some fishes at cold temperatures is due to dormancy alone, or also involves active metabolic depression. Thus, we acclimated winter-dormant cunner [Tautogolabrus adspersus, a north temperate wrasse which in Newfoundland is at the northern limit of its distribution] and winter-active Atlantic salmon (Salmo salar) to winter (0°C; 8h light: 16h dark) and summer (10°C; 16h light: 8 h dark) conditions, and measured the thermal sensitivity of ATP-producing and O2-consuming processes in isolated liver mitochondria and hepatocytes when exposed in vitro to temperatures from 20 to 0°C and 10 to 0°C, respectively. We found that: 1) liver mitochondrial State 3 respiration and hepatocyte O2 consumption in cunner were only ~ one-third and two-thirds of that measured in salmon, respectively, at all measurement temperatures; 2) cunner mitochondria also have proton conductance and leak respiration (State 4) values that are only approximately one-third of those in salmon; 3) the mitochondria of cunner show a dramatic reduction in respiratory control ratio (from ~ 8 to 3), and a much greater drop in State 3 respiration, between 10 and 5°C (Q10 values in 10- and 0°C-acclimated fish of 14.5 and 141.2, respectively), as compared with salmon (3.9 and 9.6, respectively); and 4) lowering temperature from 5 to 0°C resulted in ~ 40 and 30% reductions in hepatocyte O2 consumption due to non-mitochondrial respiration and Na+-K+-ATPase activity, respectively, in cunner, but not in salmon. Collectively, these results highlight the intrinsic capacity for metabolic depression in hepatocytes and mitochondria of cunner, and clearly suggest that several cellular processes play a role in the reduced metabolic rates exhibited by some fishes at cold temperatures.
Conflict of interest statement
The authors have declared that no competing interests exist.
Figures


Similar articles
-
Thermal constraints on exercise and metabolic performance do not explain the use of dormancy as an overwintering strategy in the cunner (Tautogolabrus adspersus).J Exp Biol. 2024 Jan 1;227(1):jeb246741. doi: 10.1242/jeb.246741. Epub 2024 Jan 11. J Exp Biol. 2024. PMID: 38044850 Free PMC article.
-
Metabolic depression in cunner (Tautogolabrus adspersus) is influenced by ontogeny, and enhances thermal tolerance.PLoS One. 2014 Dec 16;9(12):e114765. doi: 10.1371/journal.pone.0114765. eCollection 2014. PLoS One. 2014. PMID: 25514755 Free PMC article.
-
The benefit of being still: energy savings during winter dormancy in fish come from inactivity and the cold, not from metabolic rate depression.Proc Biol Sci. 2018 Sep 5;285(1886):20181593. doi: 10.1098/rspb.2018.1593. Proc Biol Sci. 2018. PMID: 30185640 Free PMC article.
-
Functional significance of metabolic responses to thermal acclimation in fish muscle.Am J Physiol. 1990 Aug;259(2 Pt 2):R245-52. doi: 10.1152/ajpregu.1990.259.2.R245. Am J Physiol. 1990. PMID: 2201217 Review.
-
Temperature acclimation and metabolism in ectotherms with particular reference to teleost fish.Symp Soc Exp Biol. 1987;41:67-93. Symp Soc Exp Biol. 1987. PMID: 3332497 Review.
Cited by
-
Aerobic metabolic scope mapping of an invasive fish species with global warming.Conserv Physiol. 2023 Nov 28;11(1):coad094. doi: 10.1093/conphys/coad094. eCollection 2023. Conserv Physiol. 2023. PMID: 38425367 Free PMC article.
-
Cardiorespiratory physiology and swimming capacity of Atlantic salmon (Salmo salar) at cold temperatures.J Exp Biol. 2023 Sep 1;226(17):jeb245990. doi: 10.1242/jeb.245990. Epub 2023 Sep 6. J Exp Biol. 2023. PMID: 37661722 Free PMC article.
-
The effects of environmental changes on the endocrine regulation of feeding in fishes.Philos Trans R Soc Lond B Biol Sci. 2024 Mar 25;379(1898):20220503. doi: 10.1098/rstb.2022.0503. Epub 2024 Feb 5. Philos Trans R Soc Lond B Biol Sci. 2024. PMID: 38310931 Free PMC article. Review.
References
-
- Ultsch G. Ecology and physiology of hibernation and overwintering among freshwater fishes, turtles, and snakes. Biol Rev. 1989;64:435–516.
Publication types
MeSH terms
LinkOut - more resources
Full Text Sources
