

A three component model for superdiffusive motion effectively describes migration of eukaryotic cells moving freely or under a directional stimulus
- PMID: 35917375
- PMCID: PMC9345344
- DOI: 10.1371/journal.pone.0272259
A three component model for superdiffusive motion effectively describes migration of eukaryotic cells moving freely or under a directional stimulus
Abstract
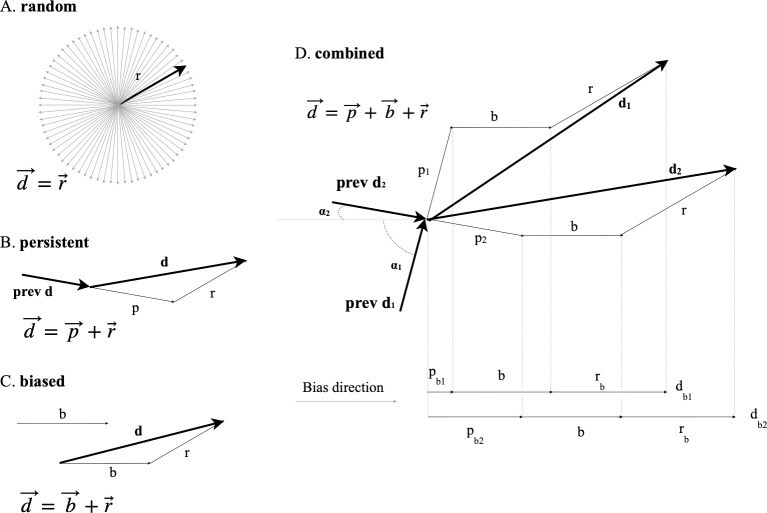
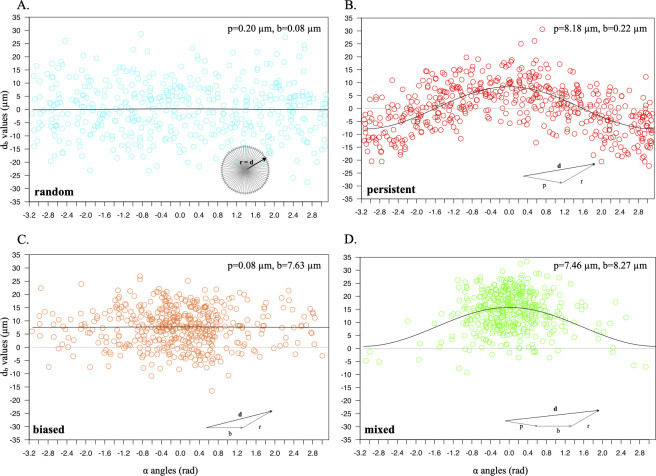
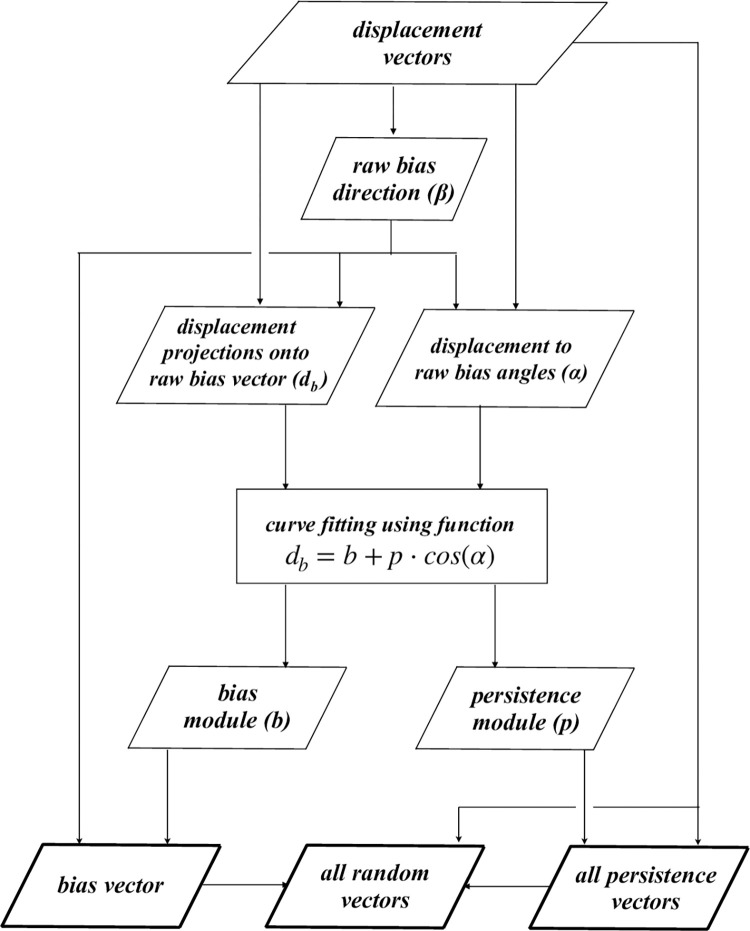
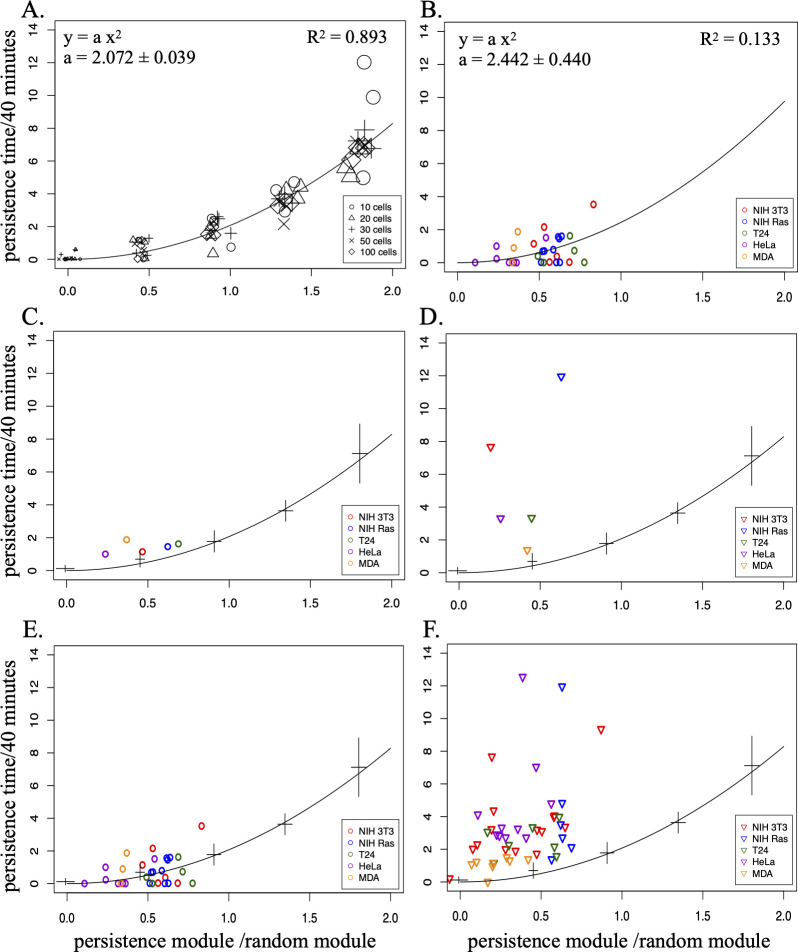
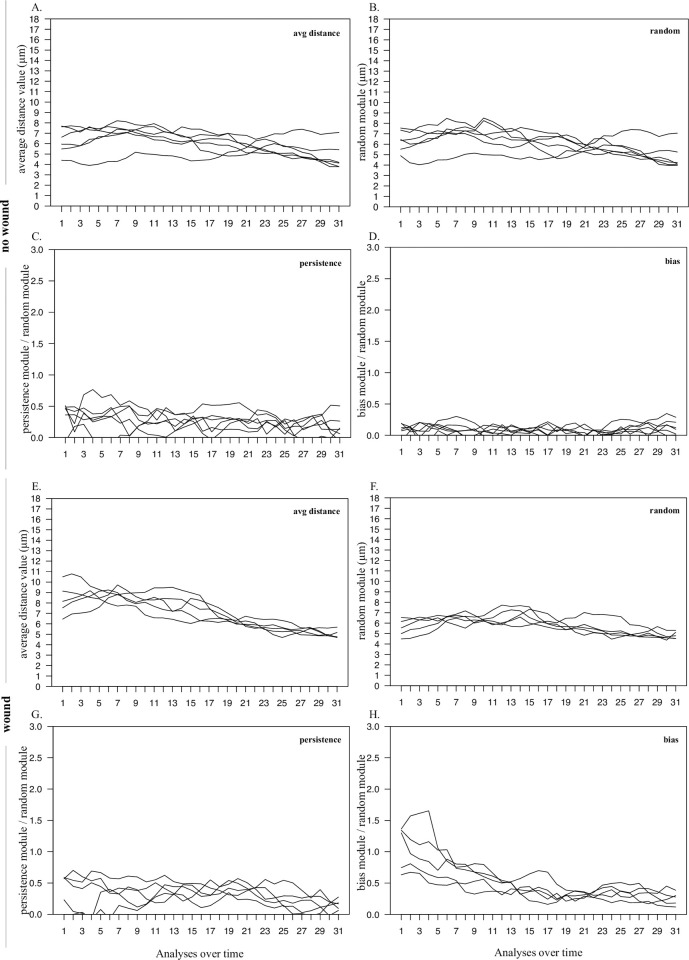
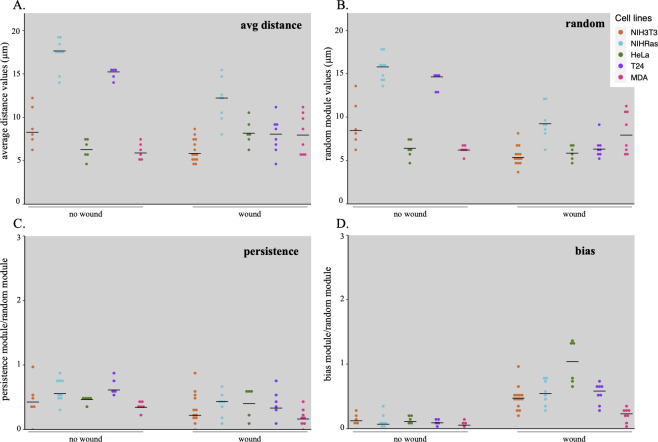
Although the simple diffusion model can effectively describe the movement of eukaryotic cells on a culture surface observed at relatively low sampling frequency, at higher sampling rates more complex models are often necessary to better fit the experimental data. Currently available models can describe motion paths by involving additional parameters, such as linearity or directional persistence in time. However sometimes difficulties arise as it is not easy to effectively evaluate persistence in presence of a directional bias. Here we present a procedure which helps solve this problem, based on a model which describes displacement as the vectorial sum of three components: diffusion, persistence and directional bias. The described model has been tested by analysing the migratory behaviour of simulated cell populations and used to analyse a collection of experimental datasets, obtained by observing cell cultures in time lapse microscopy. Overall, the method produces a good description of migration behaviour as it appears to capture the expected increase in the directional bias in presence of wound without a large concomitant increase in the persistence module, allowing it to remain as a physically meaningful quantity in the presence of a directional stimulus.
Conflict of interest statement
The authors have declared that no competing interests exist.
Figures
Similar articles
-
Analysis and modelling of motility of cell populations with MotoCell.BMC Bioinformatics. 2009 Oct 15;10 Suppl 12(Suppl 12):S12. doi: 10.1186/1471-2105-10-S12-S12. BMC Bioinformatics. 2009. PMID: 19828072 Free PMC article.
-
Migration of individual microvessel endothelial cells: stochastic model and parameter measurement.J Cell Sci. 1991 Jun;99 ( Pt 2):419-30. doi: 10.1242/jcs.99.2.419. J Cell Sci. 1991. PMID: 1885678
-
Cellular velocity, electrical persistence and sensing in developed and vegetative cells during electrotaxis.PLoS One. 2020 Sep 18;15(9):e0239379. doi: 10.1371/journal.pone.0239379. eCollection 2020. PLoS One. 2020. PMID: 32946489 Free PMC article.
-
Assessment of the capacity of human subjects and S-I neurons to distinguish opposing directions of stimulus motion across the skin.Brain Res. 1985 Dec;357(3):187-212. doi: 10.1016/0165-0173(85)90024-4. Brain Res. 1985. PMID: 3913492 Review.
-
Tracking of Endothelial Cell Migration and Stiffness Measurements Reveal the Role of Cytoskeletal Dynamics.Int J Mol Sci. 2022 Jan 5;23(1):568. doi: 10.3390/ijms23010568. Int J Mol Sci. 2022. PMID: 35008993 Free PMC article. Review.
Cited by
-
Cell populations simulated in silico within SimulCell accurately reproduce the behaviour of experimental cell cultures.NPJ Syst Biol Appl. 2025 May 17;11(1):48. doi: 10.1038/s41540-025-00518-w. NPJ Syst Biol Appl. 2025. PMID: 40379622 Free PMC article.
-
Bioconjugation of COL1 protein on liquid-like solid surfaces to study tumor invasion dynamics.Biointerphases. 2023 Mar 10;18(2):021001. doi: 10.1116/6.0002083. Biointerphases. 2023. PMID: 36898958 Free PMC article.
-
ZNF224 enhances the oncogenic function of p21 via p53 and AKT pathways in melanoma.FEBS J. 2025 Aug;292(15):3986-4005. doi: 10.1111/febs.70114. Epub 2025 May 5. FEBS J. 2025. PMID: 40321146 Free PMC article.
-
Methods and computational tools to study eukaryotic cell migration in vitro.Front Cell Dev Biol. 2024 Jun 3;12:1385991. doi: 10.3389/fcell.2024.1385991. eCollection 2024. Front Cell Dev Biol. 2024. PMID: 38887515 Free PMC article. Review.
References
Publication types
MeSH terms
LinkOut - more resources
Full Text Sources
