. 2022 Aug 3;76(3):e133-e141.
doi: 10.1093/cid/ciac613. Online ahead of print.

Omicron-associated changes in SARS-CoV-2 symptoms in the United Kingdom

Affiliations

Omicron-associated changes in SARS-CoV-2 symptoms in the United Kingdom

Karina Doris Vihta et al. Clin Infect Dis. .

Abstract

Background: The SARS-CoV-2 Delta variant has been replaced by the highly transmissible Omicron BA.1 variant, and subsequently by Omicron BA.2. It is important to understand how these changes in dominant variants affect reported symptoms, while also accounting for symptoms arising from other co-circulating respiratory viruses.

Methods: In a nationally representative UK community study, the COVID-19 Infection Survey, we investigated symptoms in PCR-positive infection episodes vs. PCR-negative study visits over calendar time, by age and vaccination status, comparing periods when the Delta, Omicron BA.1 and BA.2 variants were dominant.

Results: Between October-2020 and April-2022, 120,995 SARS-CoV-2 PCR-positive episodes occurred in 115,886 participants, with 70,683 (58%) reporting symptoms. The comparator comprised 4,766,366 PCR-negative study visits (483,894 participants); 203,422 (4%) reporting symptoms. Symptom reporting in PCR-positives varied over time, with a marked reduction in loss of taste/smell as Omicron BA.1 dominated, maintained with BA.2 (44%/45% 17 October 2021, 16%/13% 2 January 2022, 15%/12% 27 March 2022). Cough, fever, shortness of breath, myalgia, fatigue/weakness and headache also decreased after Omicron BA.1 dominated, but sore throat increased, the latter to a greater degree than concurrent increases in PCR-negatives. Fatigue/weakness increased again after BA.2 dominated, although to a similar degree to concurrent increases in PCR-negatives. Symptoms were consistently more common in adults aged 18-65 years than in children or older adults.

Conclusions: Increases in sore throat (also common in the general community), and a marked reduction in loss of taste/smell, make Omicron harder to detect with symptom-based testing algorithms, with implications for institutional and national testing policies.

Keywords: Omicron; SARS-CoV-2; symptoms.


Conflict of interest statement

Potential conflicts of interest. T. H. reports grants to the institution for the present work from the Engineering and Physical Sciences Research Council, Alan Turing Institute for Data Science and Artificial Intelligence, and the Royal Society and received payment to the institution from part time secondment to the UK Health Security Agency. D. A. C. declares academic grants to Oxford University from GlaxoSmithKline, Wellcome Trust, and UK Research and Innovation and personal fees from Oxford University Innovation, Biobeats, and Sensyne Health, outside the submitted work. P. C. M. reports research contract and funding from the Francis Crick Institute, outside the submitted work, and scientific collaboration with GlaxoSmithKline, with receipt of funding support. D. W. E. declares lecture fees from Gilead, outside the submitted work. All other authors report no potential conflicts of interest. All authors have submitted the ICMJE Form for Disclosure of Potential Conflicts of Interest. Conflicts that the editors consider relevant to the content of the manuscript have been disclosed.

Figures

Figure 1.
Figure 1.
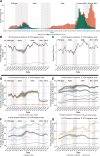
Variants (A) and symptoms (BG) in participants testing positive or negative for severe acute respiratory syndrome coronavirus 2 (SARS-CoV-2) over time in the United Kingdom. A, Numbers of polymerase chain reaction (PCR)–positive infection episodes that were S-gene negative (Alpha compatible, 20 December 2020 to 5 June 2021; Omicron BA.1 compatible, 19 December 2021 to 26 February 2022) or S-gene positive (Delta compatible, 6 June to 18 December 2021; Omicron BA.2 compatible, 27 February 2022 onward). Vertical lines indicate when new variants became dominant based on gene positivity patterns (>50% of PCR-positive infection episodes, excluding those that were S-gene unknown): wild type before 20 December 2020, then Alpha before 5 June 2021, Delta before 19 December 2021, and Omicron BA.1 before 27 February 2022; Omicron BA.2 became the dominant variant afterward; while grey bands indicate periods between the first time when new variants represented >10% and >90% of PCR-positive infection episodes based on gene positivity patterns, excluding those that were S-gene unknown. B, C, Probability of reporting symptoms and the number of symptoms (of the 12 elicited throughout the study period) among all PCR-positive infection episodes and all PCR-negative comparator visits. D–G, Probability of specific symptoms in symptomatic PCR-positive infection episodes and symptomatic PCR-negative comparator study visits, after adjustment for age, sex, and ethnicity (presented at the reference categories of age 45 years, male sex, and white race).
Figure 2.
Figure 2.
Percentage of polymerase chain reaction (PCR)–positive infection episodes reporting symptoms by variant and by vaccination status (restricting to those aged ≥18 years), showing reporting of any evidence of symptoms as well as specific symptoms in symptomatic PCR-positive infection episodes from 29 September 2021 onward (not adjusted for other factors; see Figure 4 for adjusted effect of age). Unvaccinated indicates before first vaccination at index positive test or never vaccinated; first vaccine, 21 days after first vaccination to 13 days after second; second vaccine, 14 days after second vaccination to 13 days after third; third vaccine, 14 days after third vaccination to 13 days after fourth (fourth vaccine data are not shown because these included <100 infections with evidence of symptoms; Supplementary Table 2). The unvaccinated and first vaccine groups represent only 3% of infections; these participants are potentially more likely to have been previously infected (because infection may have affected subsequent vaccine uptake), and previous infection is associated with fewer reported symptoms (Figure 3).
Figure 3.
Figure 3.
Percentage of polymerase chain reaction (PCR)–positive infection episodes reporting symptoms by variant and infection/reinfection, based on reporting of any evidence of symptoms, as well as specific symptoms in symptomatic PCR-positive infection episodes from 29 September 2021 onward (not adjusted for other factors; see Figure 4 for adjusted effect of age).
Figure 4.
Figure 4.
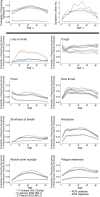
By age, estimated percentage of polymerase chain reaction (PCR)–positive infection episodes and comparator PCR-negative study visits reporting symptoms and mean number of symptoms at the peaks of Delta, Omicron BA.1, and Omicron BA.2 waves. Model estimates are shown for reporting of any evidence of symptoms as well as specific symptoms in symptomatic PCR-positive infection episodes and comparator PCR-negative study visits on 17 October 2021 (Delta), 2 January 2022 (when Omicron BA.1-compatible infections represented the highest proportion of PCR-positive infections), and 27 March 2022 (when Omicron BA.2 was the dominant variant). Panels in the first row show the probability of reporting symptoms and the number of symptoms (of the 12 elicited throughout the study period) in all PCR-positive infection episodes and all PCR-negative comparator visits from 29 September 2021 onward, estimated at 3 reference categories, 17 October 2021, 2 January 2022, and 27 March 2022. The remaining panels show the probability of reporting specific symptoms in symptomatic PCR-positive infection episodes and in symptomatic PCR-negative comparator study visits at these reference categories. All are adjusted for calendar date, age (allowing for effect modification by calendar date by including an interaction between calendar date and age), sex (reference category: male), and ethnicity (reference category: white). See Supplementary Figure 3 for other symptoms.

References

    1. Kozlov M. Omicron’s feeble attack on the lungs could make it less dangerous. 2022. Available at: https://www.nature.com/articles/d41586-022-00007-8. Accessed 10 January 2022. - PubMed
    1. Halfmann PJ, Iida S, Iwatsuki-Horimoto K, et al. SARS-CoV-2 Omicron virus causes attenuated disease in mice and hamsters. Nature 2022; 603:687–92. - PMC - PubMed
    1. Willett BJ, Grove J, Maclean OA, et al. The hyper-transmissible SARS-CoV-2 Omicron variant exhibits significant antigenic change, vaccine escape and a switch in cell entry mechanism. medRxiv [Preprint: not peer reviewed]. 26 January 2022. Available from: https://www.medrxiv.org/content/10.1101/2022.01.03.21268111v2. - DOI
    1. Meng B, Ferreira IATM, Abdullahi A, et al. SARS-CoV-2 Omicron spike mediated immune escape and tropism shift. bioRxiv [Preprint: not peer reviewed]. 22 December 2021. Available from: https://www.biorxiv.org/content/10.1101/2021.12.17.473248v2. - DOI
    1. Bentley EG, Kirby A, Sharma P, et al. SARS-CoV-2 Omicron-B.1.1.529 variant leads to less severe disease than Pango B and Delta variants strains in a mouse model of severe COVID-19. bioRxiv [Preprint: not peer reviewed]. 30 December 2021. Available from: https://www.biorxiv.org/content/10.1101/2021.12.26.474085v2. - DOI