. 2023 Feb 28;7(4):469-481.
doi: 10.1182/bloodadvances.2022007875.

SUMOylation inhibition overcomes proteasome inhibitor resistance in multiple myeloma

Affiliations

SUMOylation inhibition overcomes proteasome inhibitor resistance in multiple myeloma

Guus J J E Heynen et al. Blood Adv. .

Abstract

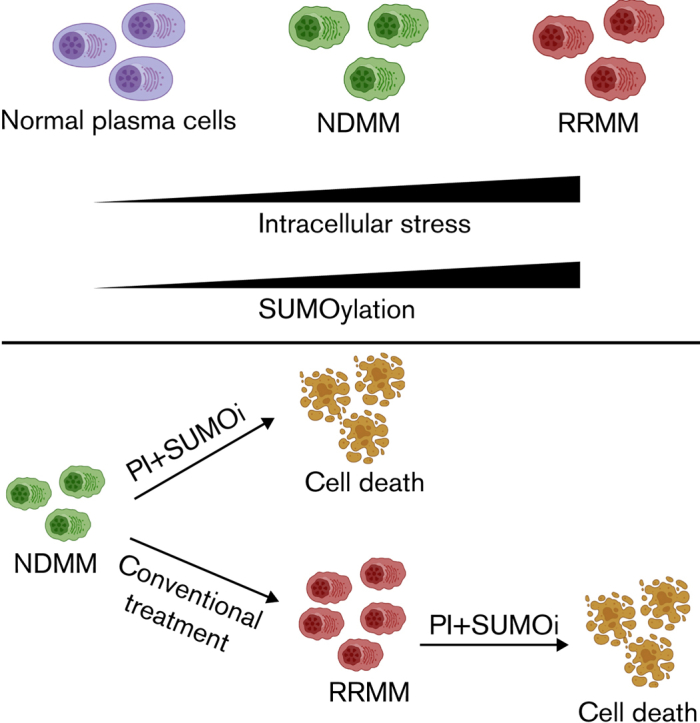
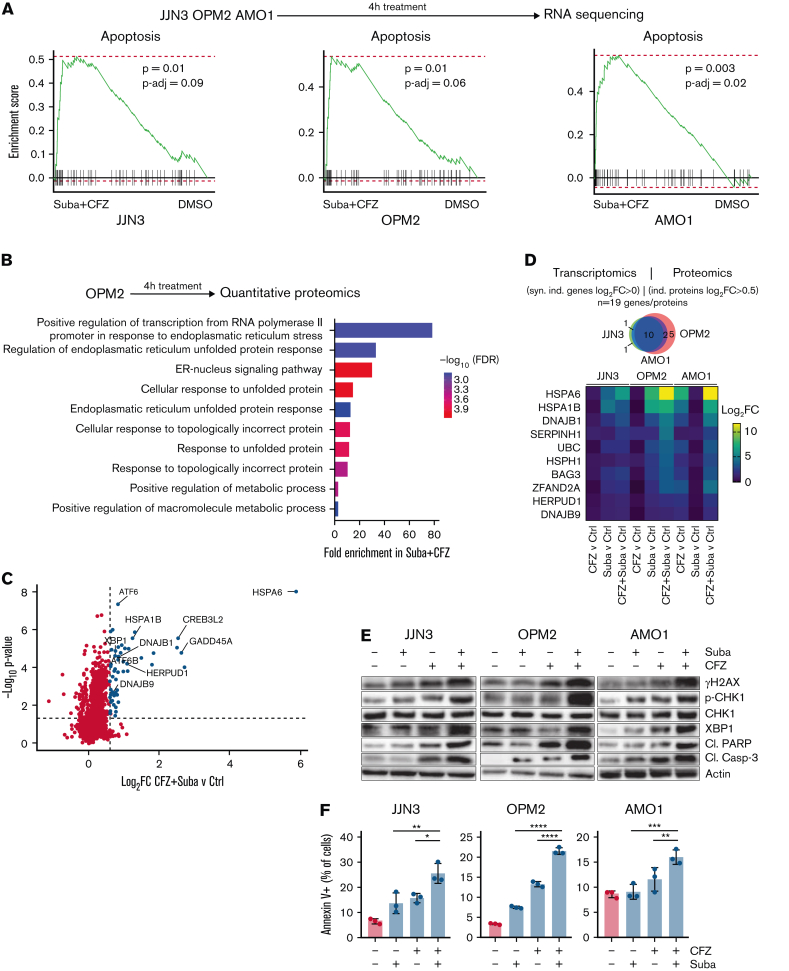
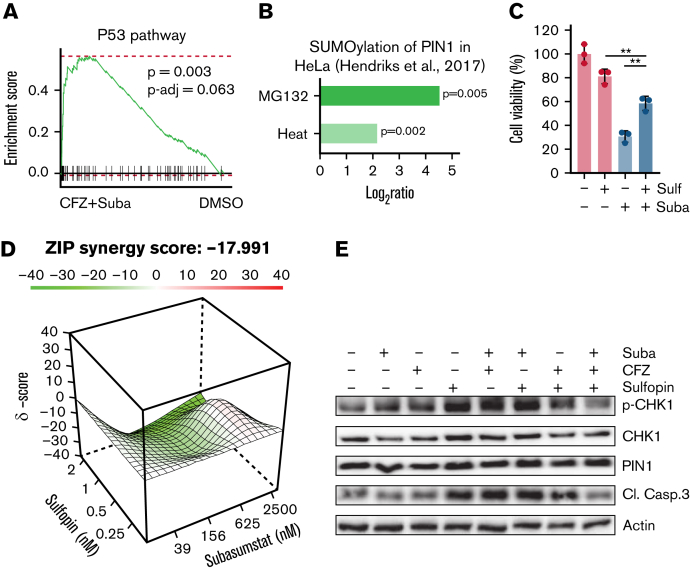
Proteasome inhibition is a highly effective treatment for multiple myeloma (MM). However, virtually all patients develop proteasome inhibitor resistance, which is associated with a poor prognosis. Hyperactive small ubiquitin-like modifier (SUMO) signaling is involved in both cancer pathogenesis and cancer progression. A state of increased SUMOylation has been associated with aggressive cancer biology. We found that relapsed/refractory MM is characterized by a SUMO-high state, and high expression of the SUMO E1-activating enzyme (SAE1/UBA2) is associated with poor overall survival. Consistently, continuous treatment of MM cell lines with carfilzomib (CFZ) enhanced SUMO pathway activity. Treatment of MM cell lines with the SUMO E1-activating enzyme inhibitor subasumstat (TAK-981) showed synergy with CFZ in both CFZ-sensitive and CFZ-resistant MM cell lines, irrespective of the TP53 state. Combination therapy was effective in primary MM cells and in 2 murine MM xenograft models. Mechanistically, combination treatment with subasumstat and CFZ enhanced genotoxic and proteotoxic stress, and induced apoptosis was associated with activity of the prolyl isomerase PIN1. In summary, our findings reveal activated SUMOylation as a therapeutic target in MM and point to combined SUMO/proteasome inhibition as a novel and potent strategy for the treatment of proteasome inhibitor-resistant MM.


Conflict of interest statement

Conflict-of-interest disclosure: U.K. received speaker honorary/advisory fees from Roche, Janssen-Cilag, Takeda, BMS, Gilead, Hexal, Pfizer, AstraZeneca, PentixaPharm, Amgen, Novartis, and MSD; and clinical study support from Celgene, Takeda, BMS, Roche, AstraZeneca, Novartis, MSD, Janssen-Cilag, and Pfizer. F. Bassermann received honoraria and research funding from BMS/Celgene. J. Krönke received speaker honorary and advisory fees from BMS/Celgene and Takeda. The remaining authors declare no competing financial interests.

Figures

None
Graphical abstract
Figure 1.
Figure 1.
SUMO pathway is activated in MM and associated with poor prognosis. (A) Heatmap and hierarchical clustering of the SUMO core components SAE1, UBA2UBE2I, SUMO1, SUMO2, and SUMO3 derived from transcriptome data from n = 768 patients with MM of MMRF-CoMMpass data; the data were clustered as indicated into SUMOhigh and SUMOlow groups. (B) Kaplan-Meier curves for probability of survival of SUMOhigh and SUMOlow groups as described in panel A. Curve comparison by log-rank test with indicated P value. (C) Immunoblot depicting expression of SUMO2/3 and SUMO1 in healthy CD138+ cells and CD138+ MM cells, which have been isolated from human specimen by magnetic-activated cell sorting. β-Actin served as loading control. (D) Top: a cohort of n = 13 patients with MM, biopsied at diagnosis, subsequently treated, and biopsied again after disease relapse. Biopsied material was subsequently used for transcriptome profiling. Bottom: Gene set enrichment analysis using the fgsea package reveals enrichment of indicated Reactome SUMOylation signatures of relapsed vs newly diagnosed patients with MM. (E) Top: schematic depiction of the CFZ resistance RNA interference (RNAi) resistance screen performed by Acosta-Alvear et al. Bottom: Enrichment indicated SUMOylation signatures upregulated in CFZ-resistant compared with CFZ-sensitive U266 cells, determined by fgsea package using the Reactome knowledgebase. (F) Top: schematic depiction of the applied strategy to cultivate CFZ-resistance MM cells. CFZ-sensitive cells were cultured in CFZ-containing medium, slowly increasing the concentration (1-2 weeks) of CFZ until cells became resistant (total duration >12 weeks). Bottom: immunoblot showing expression of SUMO2/3 and SUMO1 in AMO1 and JJN3 CFZ-resistant cells (R) compared with AMO1 and JJN3 parental (P) cells. P cells were treated with 1 μM subasumstat and/or 12 nM CFZ for 4 hours; dimethyl sulfoxide served as vehicle control (-). Resistant cells were cultured in the presence of 12 nM CFZ and cotreated with 1 μM subasumstat as indicated. Cotreatment with subasumstat depletes SUMOylation. Adjusted P values (false discovery rate), ∗P < .05, ∗∗P < .01, ∗∗∗P < .001 (panels D-E). mRNA, messenger RNA; NES, normalized enrichment score; P-adj, adjusted P value; Suba, subasumstat.
Figure 2.
Figure 2.
Subasumstat induces cell death in MM cell lines. (A) Treatment of five MM cell lines with 250 nM subasumstat inhibits 2/3 SUMOylation and increases the pool of free SUMO2/3 compared with dimethyl sulfoxide (DMSO)-treated control cells. (B) Expression of indicated core SUMOylation machinery genes in a panel of MM cell lines (data derived from depmap.org). TP53 status is indicated for each cell line. (C) Subasumstat monotreatment on a panel of five MM cell lines. Cells were treated for 3 days with different concentrations of subasumstat; subsequently, viability was measured. Results of 3 independent measurements are shown. (D) Top: OPM2 cells were treated for 16 hours with DMSO or subasumstat and analyzed by quantitative proteomics. Bottom: fgsea plots of quantitative proteomics data. DNA repair and apoptosis proteins are significantly upregulated in subasumstat-treated OPM2 cells over DMSO-treated control cells. P-adj, adjusted P value; Suba, subasumstat.
Figure 3.
Figure 3.
Combined SUMO and proteasome inhibition acts synergistically in MM cell lines. (A) Combination of subasumstat with the proteasome inhibitors bortezomib (BTZ) and CFZ has a synergistic effect on the viability of THE indicated MM cells. Synergy score has been determined by SynergyFinder using the Zero Interaction Potency method (ZIP). The presented ZIP synergy scores are the average of n = 3 independent biological experiments with n = 3 technical replicates. Cells were treated with single and combination treatments using a 4 × 6 matrix. (B) Landscape plots depicting the synergistic area of concentrations for subasumstat and CFZ combination treatment in JJN3, OPM2, and AMO1 cells. Cells were treated for 72 hours with the indicated concentrations (4 × 6 matrix) of subasumstat and CFZ, and cell viability was measured by CellTiterGlo. Subsequently, cell viability data were used to generate landscape plots using SynergyFinder. (C) Bar diagrams showing the effect on cell viability after 72 hours of treatment with CFZ, subasumstat, and the combination thereof in JJN3 (2 nM CFZ, 200 nM subasumstat), OPM2 (2 nM CFZ, 200 nM subasumstat), and AMO1 (4 nM CFZ, 200 nM subasumstat) cells. Statistical testing was determined by one-way analysis of variance. (D) Bar diagram showing the effect on cell viability after 72 hours of treatment with 6 nM (JJN3) or 12 nM (AMO1) CFZ, 200 nM (JJN3) or 1 μM (AMO1) subasumstat, and the combination thereof in parental (P) and CFZ-resistant (R) cells. Statistical testing was determined by one-way analysis of variance. ∗P ≤ .05, ∗∗P ≤ .01, ∗∗∗∗P ≤ .0001. Suba, subasumstat.
Figure 4.
Figure 4.
Subasumstat and CFZ combination increases cellular stress response and apoptosis. (A) Top: OPM2, JJN3, and AMO1 cells were treated for 4 hours with dimethyl sulfoxide (DMSO), 250 nM subasumstat, 5 nM CFZ, or the combination thereof and subsequently analyzed by RNA-sequencing (n = 3 biological replicates). Bottom: Gene set enrichment analysis using the fgsea package of the combination treatment (4 hours) vs DMSO control shows enriched apoptosis signatures of the Hallmark set from the molecular signature database. fgsea P values and adjusted P values (P-adj; false discovery rate [FDR]) are indicated. (B) Top: OPM2 cells were treated for 4 hours with DMSO, 250 nM subasumstat, 5 nM CFZ, or the combination thereof and analyzed by quantitative proteomics. Bottom: Enriched Gene Ontology signatures in CFZ vs DMSO-treated OPM2 cells are displayed. (C) Graphical representation of quantitative proteomics data of OPM2 cells that are treated for 4 hours with a combination of subasumstat and CFZ over DMSO-treated control (Ctrl) cells. Proteins are ranked in a volcano plot according to their statistical P value (y-axis) and their relative abundance ratio (log2 fold change [log2FC], x-axis). (D) Top: Significantly synergistically induced genes from transcriptomic data (log2FC > 0, panel A) and proteins significantly induced in the combination treatment of subasumstat and CFZ (log2FC > 0.5; indicated in panel C) were extracted, and matching genes and proteins (n = 19) were subsequently analyzed in all 3 indicated cell lines. Bottom: Heatmap of the fold change of treatment vs control of the identified indicated messenger RNA expression in the cell lines JJN3, OPM2, and AMO1. (E) Immunoblots on JJN3, OPM2, and AMO1 cell lysates treated for 4 hours with 250 nM subasumstat, 5 nM CFZ, or the combination thereof. Protein expression of gH2AX (S139), p-CHK1 (S345), and pan-CHK1 to determine DDR, XBP1 (unfolded protein response), and the apoptosis markers cleaved poly(ADP-ribose) polymerase (Cl. PARP) and cleaved caspase-3 (Cl. Casp-3) have been analyzed. β-Actin served as loading control. (F) Fluorescence-activated cell sorting analysis of JJN3, OPM2, and AMO1 cells stained with Annexin V and 4′,6-diamidino-2-phenylindole to measure apoptosis after treatment for 48 hours with 250 nM subasumstat, 5 nM CFZ, or the combination thereof. P values were determined by one-way analysis of variance. ∗P ≤ .05, ∗∗P ≤ .01, ∗∗∗P ≤ .001, ∗∗∗∗P ≤ .0001. ER, endoplasmic reticulum. Suba, subasumstat.
Figure 5.
Figure 5.
Induction of cell death upon combined SUMO/proteasome inhibition is associated with PIN1. (A) OPM2 cells were treated for 4 hours with dimethyl sulfoxide (DMSO), 250 nM subasumstat, 5 nM CFZ, or the combination thereof and subsequently analyzed by RNA-sequencing. GSEA analysis by the fgsea package of the combination treatment (4 hours) vs DMSO control shows enriched p53 signatures of the Hallmark set from the molecular signature database. fgsea P values and adjusted P values (P-adj; false discovery rate) are indicated. (B) PIN1 SUMOylation upon 8 hours of 10 μM MG132 treatment or 1 hour of heat shock vs control with indicated P values. Data were retrieved from the qPTM database (http://qptm.omicsbio.info/) from the study. (C) Determination of viability of OPM2 cells, treated with 2.5 μM subasumstat or 1 μM sulfopin or combination of both for 72 hours. Cell viability was measured by CellTiterGlo. (D) Landscape plots depicting the antagonistic/additive or synergistic area of concentrations for subasumstat in combination with sulfopin treatment in OPM2 cells. Cells were treated for 72 hours with the indicated concentrations (4 × 6 matrix) of subasumstat and sulfopin and cell viability was measured by CellTiterGlo. Subsequently, cell viability data were used to generate landscape plots using SynergyFinder. (E) Immunoblots on OPM2 cell lysates treated for 4 hours with 250 nM subasumstat, 5 nM CFZ, 2 μM sulfopin, or the combination thereof. Protein expression of indicated proteins was detected using specific antibodies as indicated in the Material and methods section. Actin served as loading control. CL. Casp.3, cleaved caspase-3; Suba, subasumstat; Sulf, sulfopin; ZIP, Zero Interaction Potency method.
Figure 6.
Figure 6.
Efficacy of combined SUMO and proteasome inhibition in vivo and in primary MM cells. (A) Average tumor volume over time in nude mice injected with 1 × 107 JJN3 or OPM2 cells. After tumor engraftment, mice were treated with either vehicle, subasumstat (25 mg/kg), CFZ (2 mg/kg), or the combination thereof for 7 days. P values were determined by unpaired t test. (B) Histogram showing the number of mice that lost >10% body weight (but <20%, which was the exclusion criterion) for each treatment group during the in vivo xenograft experiment. (C) Bar diagram of Annexin V staining of 5 primary MM patient samples treated with dimethyl sulfoxide, 250 nM subasumstat, 5 nM CFZ, or the combination thereof. ∗P ≤ .05, ∗∗P ≤ .01. d0, day 0; Suba, subasumstat.

References

    1. Palumbo A, Anderson K. Multiple myeloma. N Engl J Med. 2011;364(11):1046–1060. - PubMed
    1. Kumar SK, Rajkumar V, Kyle RA, et al. Multiple myeloma. Nat Rev Dis Primers. 2017;3(1) - PubMed
    1. Heider M, Nickel K, Högner M, Bassermann F. Multiple myeloma: molecular pathogenesis and disease evolution. Oncol Res Treat. 2021;44(12):672–681. - PMC - PubMed
    1. Kumar SK, Rajkumar SV, Dispenzieri A, et al. Improved survival in multiple myeloma and the impact of novel therapies. Blood. 2008;111(5):2516–2520. - PMC - PubMed
    1. Rajkumar SV, Kumar S. Multiple myeloma current treatment algorithms. Blood Cancer J. 2020;10(9):94. - PMC - PubMed

Publication types

MeSH terms

Substances