

Tyrosine Kinase Inhibition Alters Intratumoral CD8+ T-cell Subtype Composition and Activity
- PMID: 35917579
- PMCID: PMC10309533
- DOI: 10.1158/2326-6066.CIR-21-1039
Tyrosine Kinase Inhibition Alters Intratumoral CD8+ T-cell Subtype Composition and Activity
Abstract
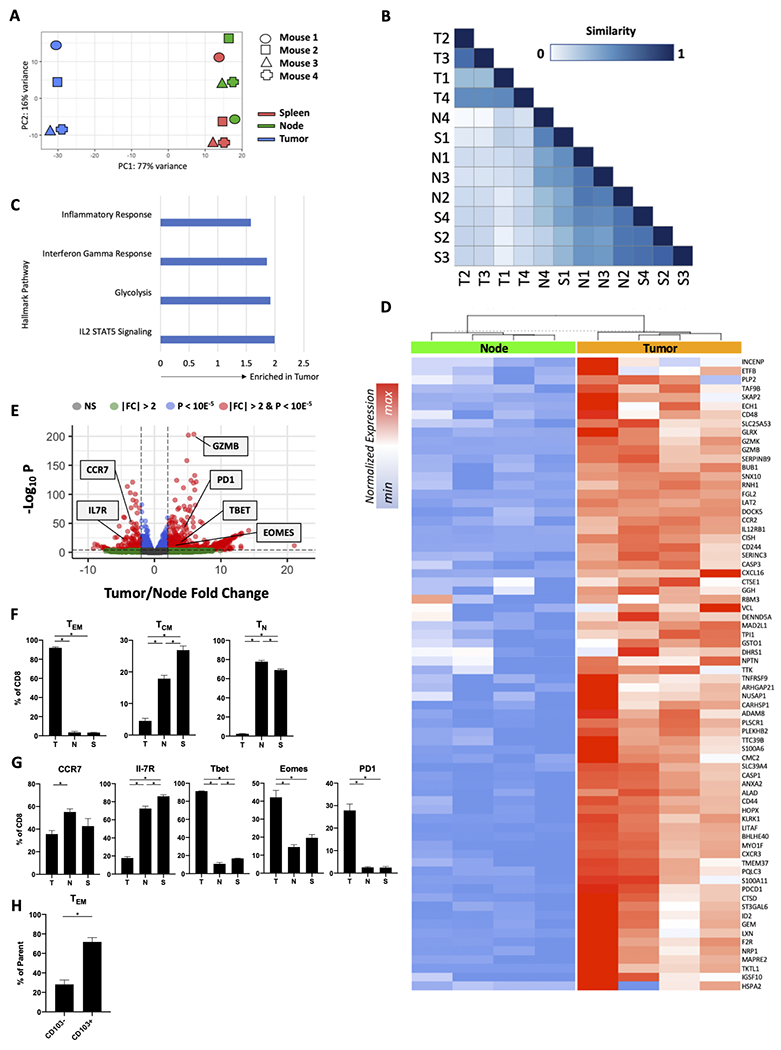
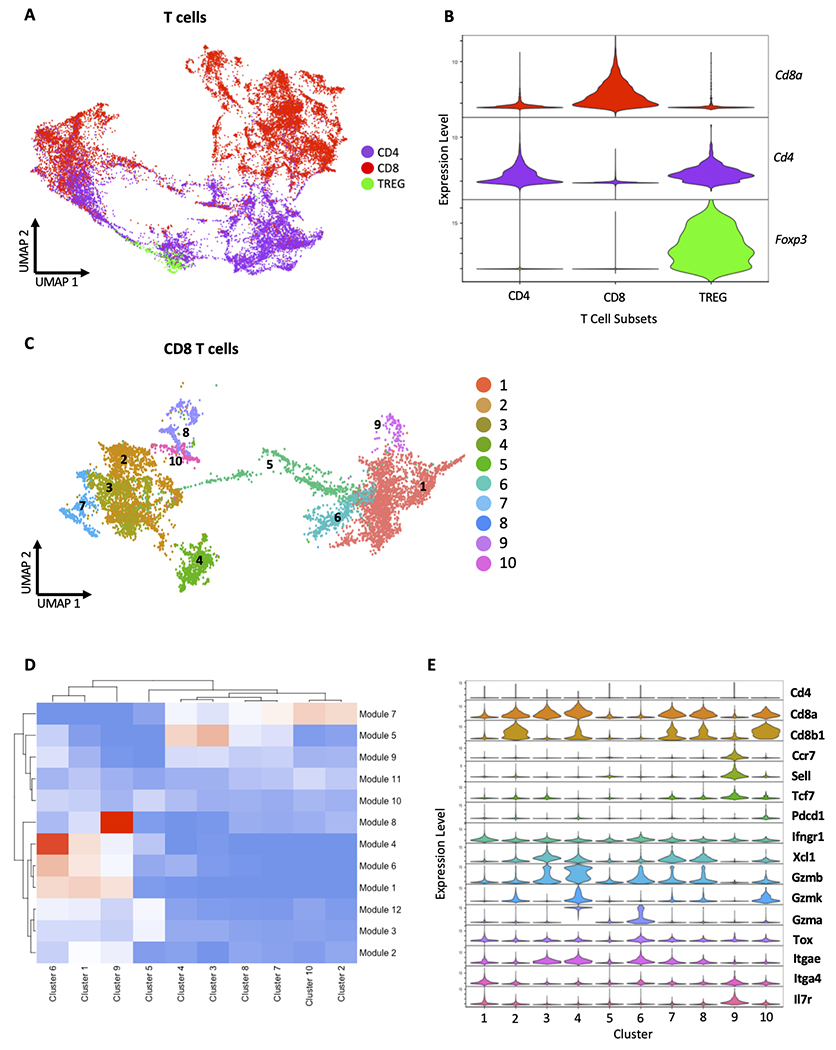
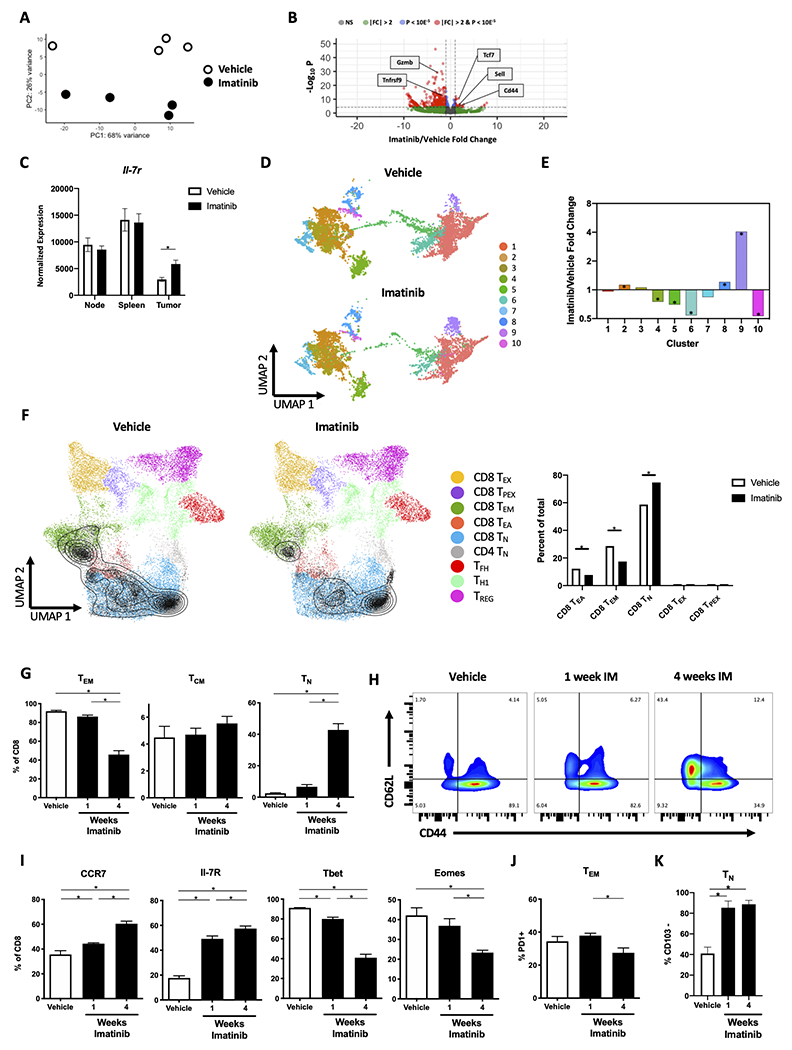
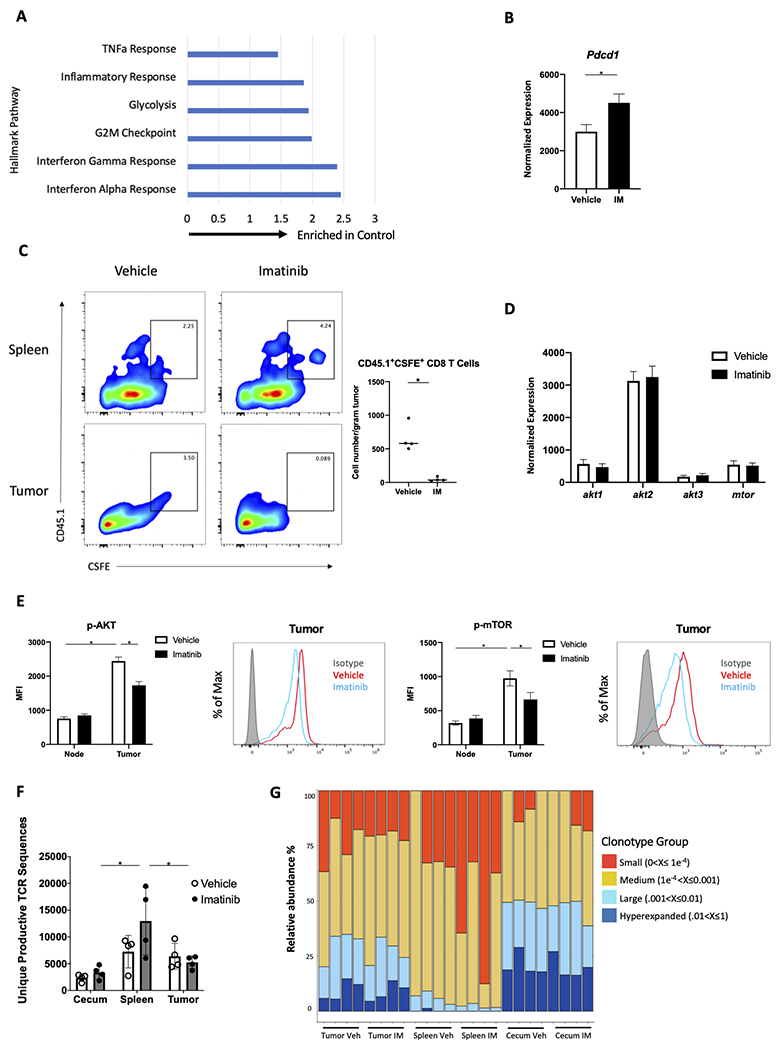
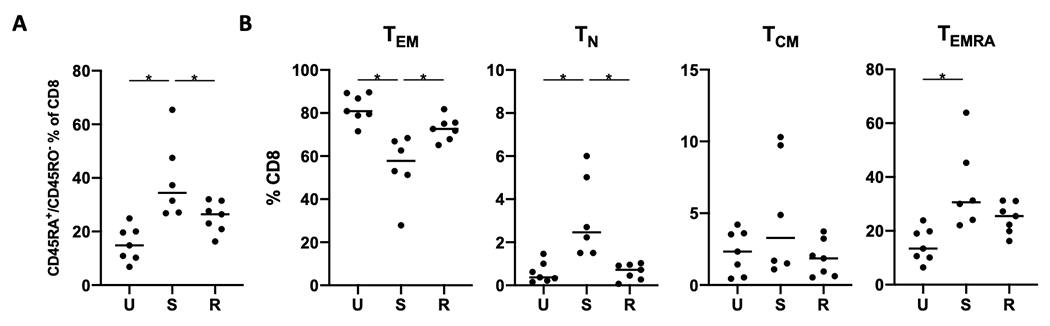
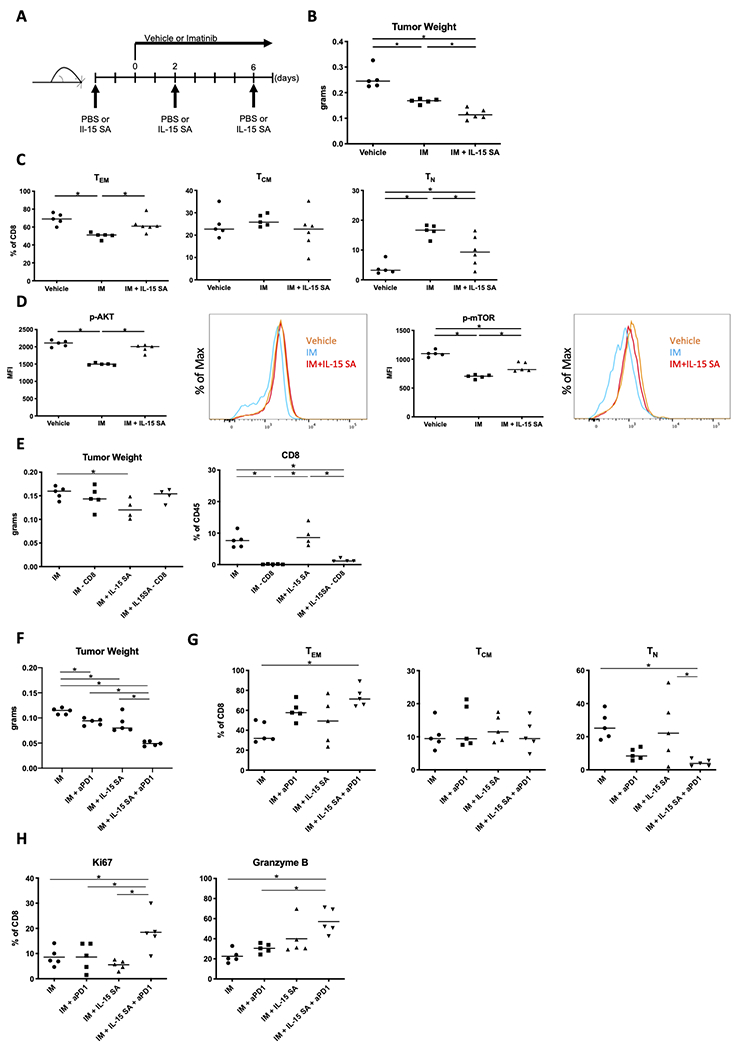
Targeted therapy with a tyrosine kinase inhibitor (TKI) such as imatinib is effective in treating gastrointestinal stromal tumor (GIST), but it is rarely curative. Despite the presence of a robust immune CD8+ T-cell infiltrate, combining a TKI with immune-checkpoint blockade (ICB) in advanced GIST has achieved only modest effects. To identify limitations imposed by imatinib on the antitumor immune response, we performed bulk RNA sequencing (RNA-seq), single-cell RNA-seq, and flow cytometry to phenotype CD8+ T-cell subsets in a genetically engineered mouse model of GIST. Imatinib reduced the frequency of effector CD8+ T cells and increased the frequency of naïve CD8+ T cells within mouse GIST, which coincided with altered tumor chemokine production, CD8+ T-cell recruitment, and reduced CD8+ T-cell intracellular PI3K signaling. Imatinib also failed to induce intratumoral T-cell receptor (TCR) clonal expansion. Consistent with these findings, human GISTs sensitive to imatinib harbored fewer effector CD8+ T cells but more naïve CD8+ T cells. Combining an IL15 superagonist (IL15SA) with imatinib restored intratumoral effector CD8+ T-cell function and CD8+ T-cell intracellular PI3K signaling, resulting in greater tumor destruction. Combination therapy with IL15SA and ICB resulted in the greatest tumor killing and maintained an effector CD8+ T-cell population in the presence of imatinib. Our findings highlight the impact of oncogene inhibition on intratumoral CD8+ T cells and support the use of agonistic T-cell therapy during TKI and/or ICB administration.
©2022 American Association for Cancer Research.
Figures
Similar articles
-
Tyrosine Kinase Inhibition Activates Intratumoral γδ T Cells in Gastrointestinal Stromal Tumor.Cancer Immunol Res. 2024 Jan 3;12(1):107-119. doi: 10.1158/2326-6066.CIR-23-0061. Cancer Immunol Res. 2024. PMID: 37922405 Free PMC article.
-
Macrophages and CD8+ T Cells Mediate the Antitumor Efficacy of Combined CD40 Ligation and Imatinib Therapy in Gastrointestinal Stromal Tumors.Cancer Immunol Res. 2018 Apr;6(4):434-447. doi: 10.1158/2326-6066.CIR-17-0345. Epub 2018 Feb 21. Cancer Immunol Res. 2018. PMID: 29467128 Free PMC article.
-
Combination of Imatinib Mesylate and AKT Inhibitor Provides Synergistic Effects in Preclinical Study of Gastrointestinal Stromal Tumor.Clin Cancer Res. 2017 Jan 1;23(1):171-180. doi: 10.1158/1078-0432.CCR-16-0529. Epub 2016 Jul 1. Clin Cancer Res. 2017. PMID: 27370604 Free PMC article.
-
Tyrosine kinase inhibitors in the treatment of unresectable or metastatic gastrointestinal stromal tumors.Expert Opin Pharmacother. 2014 Oct;15(14):1979-89. doi: 10.1517/14656566.2014.937707. Epub 2014 Jul 3. Expert Opin Pharmacother. 2014. PMID: 24990162 Review.
-
Imatinib mesylate: in the treatment of gastrointestinal stromal tumours.Drugs. 2003;63(5):513-22; discussion 523-4. doi: 10.2165/00003495-200363050-00005. Drugs. 2003. PMID: 12600228 Review.
Cited by
-
Multiple intratumoral sources of kit ligand promote gastrointestinal stromal tumor.Oncogene. 2023 Aug;42(34):2578-2588. doi: 10.1038/s41388-023-02777-5. Epub 2023 Jul 19. Oncogene. 2023. PMID: 37468679
-
Soft tissue sarcomas at the single-cell and spatial resolution: new markers and targets.Cancer Gene Ther. 2025 Jan;32(1):11-21. doi: 10.1038/s41417-024-00856-7. Epub 2024 Nov 24. Cancer Gene Ther. 2025. PMID: 39582085 Review.
-
Advances in immunology and immunotherapy for mesenchymal gastrointestinal cancers.Mol Cancer. 2023 Apr 18;22(1):71. doi: 10.1186/s12943-023-01770-6. Mol Cancer. 2023. PMID: 37072770 Free PMC article. Review.
-
Molecular characteristics and immune microenvironment of gastrointestinal stromal tumours: targets for therapeutic strategies.Front Oncol. 2024 Jul 12;14:1405727. doi: 10.3389/fonc.2024.1405727. eCollection 2024. Front Oncol. 2024. PMID: 39070147 Free PMC article. Review.
-
Enhancing immunotherapy efficacy in colorectal cancer: targeting the FGR-AKT-SP1-DKK1 axis with DCC-2036 (Rebastinib).Cell Death Dis. 2025 Jan 9;16(1):8. doi: 10.1038/s41419-024-07263-8. Cell Death Dis. 2025. PMID: 39788945 Free PMC article.
References
-
- Mastrangelo G, Coindre JM, Ducimetière F, Dei Tos AP, Fadda E, Blay JY, et al. Incidence of soft tissue sarcoma and beyond: a population-based prospective study in 3 European regions. Cancer. 2012;118(21):5339–48. - PubMed
-
- Blanke CD, Demetri GD, von Mehren M, Heinrich MC, Eisenberg B, Fletcher JA, et al. Long-term results from a randomized phase II trial of standard- versus higher-dose imatinib mesylate for patients with unresectable or metastatic gastrointestinal stromal tumors expressing KIT. J Clin Oncol. 2008;26(4):620–5. - PubMed
-
- Demetri GD, von Mehren M, Blanke CD, Van den Abbeele AD, Eisenberg B, Roberts PJ, et al. Efficacy and safety of imatinib mesylate in advanced gastrointestinal stromal tumors. N Engl J Med. 2002;347(7):472–80. - PubMed
-
- Gold JS, van der Zwan SM, Gonen M, Maki RG, Singer S, Brennan MF, et al. Outcome of metastatic GIST in the era before tyrosine kinase inhibitors. Ann Surg Oncol. 2007;14(1):134–42. - PubMed
Publication types
MeSH terms
Substances
Grants and funding
LinkOut - more resources
Full Text Sources
Research Materials
