. 2023 Mar 14;25(3):533-543.
doi: 10.1093/neuonc/noac189.

Artificial intelligence (AI)-based decision support improves reproducibility of tumor response assessment in neuro-oncology: An international multi-reader study

Affiliations

Artificial intelligence (AI)-based decision support improves reproducibility of tumor response assessment in neuro-oncology: An international multi-reader study

Philipp Vollmuth et al. Neuro Oncol. .

Abstract

Background: To assess whether artificial intelligence (AI)-based decision support allows more reproducible and standardized assessment of treatment response on MRI in neuro-oncology as compared to manual 2-dimensional measurements of tumor burden using the Response Assessment in Neuro-Oncology (RANO) criteria.

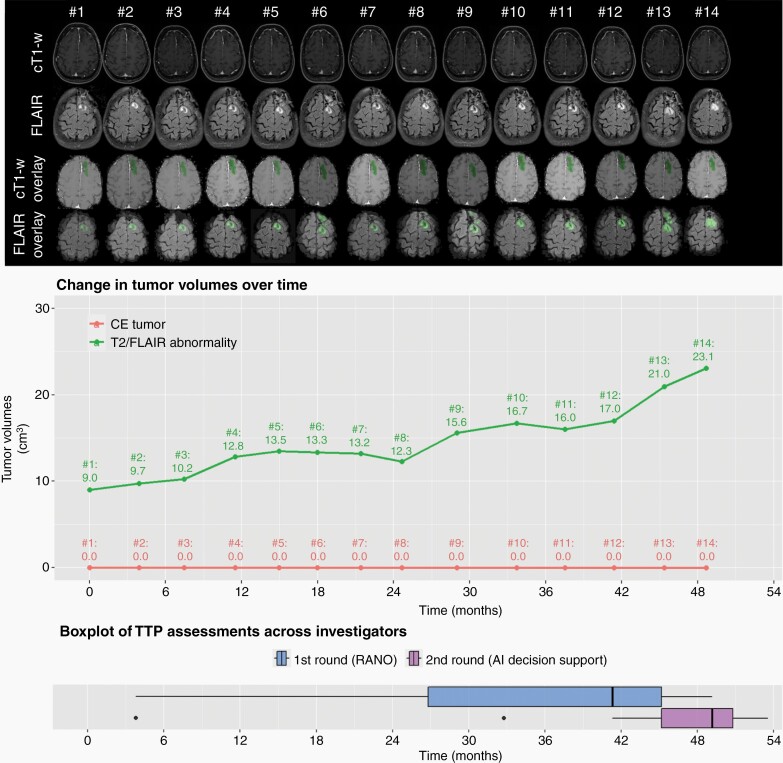
Methods: A series of 30 patients (15 lower-grade gliomas, 15 glioblastoma) with availability of consecutive MRI scans was selected. The time to progression (TTP) on MRI was separately evaluated for each patient by 15 investigators over two rounds. In the first round the TTP was evaluated based on the RANO criteria, whereas in the second round the TTP was evaluated by incorporating additional information from AI-enhanced MRI sequences depicting the longitudinal changes in tumor volumes. The agreement of the TTP measurements between investigators was evaluated using concordance correlation coefficients (CCC) with confidence intervals (CI) and P-values obtained using bootstrap resampling.

Results: The CCC of TTP-measurements between investigators was 0.77 (95% CI = 0.69,0.88) with RANO alone and increased to 0.91 (95% CI = 0.82,0.95) with AI-based decision support (P = .005). This effect was significantly greater (P = .008) for patients with lower-grade gliomas (CCC = 0.70 [95% CI = 0.56,0.85] without vs. 0.90 [95% CI = 0.76,0.95] with AI-based decision support) as compared to glioblastoma (CCC = 0.83 [95% CI = 0.75,0.92] without vs. 0.86 [95% CI = 0.78,0.93] with AI-based decision support). Investigators with less years of experience judged the AI-based decision as more helpful (P = .02).

Conclusions: AI-based decision support has the potential to yield more reproducible and standardized assessment of treatment response in neuro-oncology as compared to manual 2-dimensional measurements of tumor burden, particularly in patients with lower-grade gliomas. A fully-functional version of this AI-based processing pipeline is provided as open-source (https://github.com/NeuroAI-HD/HD-GLIO-XNAT).

Keywords: Artificial intelligence (AI)-based decision support; RANO; tumor response assessment; tumor volumetry.


Figures

Fig. 1
Fig. 1
Use of automated AI-based volumetric quantification of tumor burden to overcome the interrater variability of RANO measurements of tumor diameters towards a more standardized & reproducible assessment of treatment efficacy in neuro-oncology.
Fig. 2
Fig. 2
Concordance correlation coefficients (CCC) of tumor response assessment between investigators in the first round of the study without AI-based decision support and the second round of the study with AI-based decision support. The central line of the boxplot denotes the median and the edges of the boxplot denote the first and the third quartile of the bootstrap distribution of the CCC. The lines extending from the boxes (whiskers) indicating variability outside the upper and lower quartiles. The outliers are denoted by black dots at the end of the whisker lines.
Fig. 3
Fig. 3
Standard deviation (SD) of tumor response assessment between investigators in the first round of the study without AI-based decision support and the second round with AI-based decision support. The difference in the SD between the first and the second round is shown in blue.
Fig. 4
Fig. 4
Illustrative case (patient #17, oligodendroglioma WHO°III) depicting the change in tumor burden over time on cT1-w and FLAIR sequences (1st and 2nd row). The cT1-w overlay and FLAIR overlay sequences (3rd and 4th row) as well as the corresponding tumor volume plot were provided in the second round of the assessment and visualize the contrast-enhancing tumor volumes and T2-w/FLAIR abnormality volumes which were automatically generated by the AI-based decision support for each timepoint. The last row visualizes the time to progression (TTP) measurements from the 15 investigators based on RANO alone (first round; blue colored boxplot) vs. additional AI-based decision support (second round; purple colored boxplot). The boxplots demonstrate higher agreement of the TTP measurements from the 15 investigators with additional AI-based decision support.
Fig. 5
Fig. 5
Illustrative case (patient #18, astrocytoma WHO°III) depicting the change in tumor burden over time on cT1-w and FLAIR sequences (1st and 2nd row). The cT1-w overlay and FLAIR overlay sequences (3rd and 4th row) as well as the corresponding tumor volume plot were provided in the second round of the assessment and visualize the contrast-enhancing tumor volumes and T2-w/FLAIR abnormality volumes which were automatically generated by the AI-based decision support for each timepoint. The last row visualizes the time to progression (TTP) measurements from the 15 investigators based on RANO alone (first round; blue colored boxplot) vs. additional AI-based decision support (second round; purple colored boxplot). The boxplots demonstrate higher agreement of the TTP measurements from the 15 investigators with additional AI-based decision support.
Fig. 6
Fig. 6
(A) Correlation between the percentage of investigators judging AI-based decision support as helpful for assessing the TTP in individual patients and the standard deviation of the corresponding TTP measurements in round 2 (RANO + AI). (B) Correlation between the percentage of patients where investigators judged AI-based decision as helpful for assessing the TTP and the corresponding experience of the investigators with neuro-oncology imaging.

References

    1. O’Connor JP, Aboagye EO, Adams JE, et al. . Imaging biomarker roadmap for cancer studies. Nat Rev Clin Oncol. 2017; 14(3):169–186. - PMC - PubMed
    1. Wen PY, Chang SM, Van den Bent MJ, et al. . Response assessment in neuro-oncology clinical trials. J Clin Oncol. 2017; 35(21):2439–2449. - PMC - PubMed
    1. Wen PY, Macdonald DR, Reardon DA, et al. . Updated response assessment criteria for high-grade gliomas: response assessment in neuro-oncology working group. J Clin Oncol. 2010; 28(11):1963–1972. - PubMed
    1. van den Bent MJ, Wefel JS, Schiff D, et al. . Response assessment in neuro-oncology (a report of the RANO group): assessment of outcome in trials of diffuse low-grade gliomas. Lancet Oncol. 2011; 12(6):583–593. - PubMed
    1. Chang K, Beers AL, Bai HX, et al. . Automatic assessment of glioma burden: a deep learning algorithm for fully automated volumetric and bidimensional measurement. Neuro Oncol. 2019; 21(11):1412–1422. - PMC - PubMed

Publication types