. 2022 Nov;33(11):2040-2058.
doi: 10.1681/ASN.2022050601. Epub 2022 Aug 2.

Early Molecular Events Mediating Loss of Aquaporin-2 during Ureteral Obstruction in Rats

Affiliations

Early Molecular Events Mediating Loss of Aquaporin-2 during Ureteral Obstruction in Rats

Chih-Chien Sung et al. J Am Soc Nephrol. 2022 Nov.

Abstract

Background: Ureteral obstruction is marked by disappearance of the vasopressin-dependent water channel aquaporin-2 (AQP2) in the renal collecting duct and polyuria upon reversal. Most studies of unilateral ureteral obstruction (UUO) models have examined late time points, obscuring the early signals that trigger loss of AQP2.

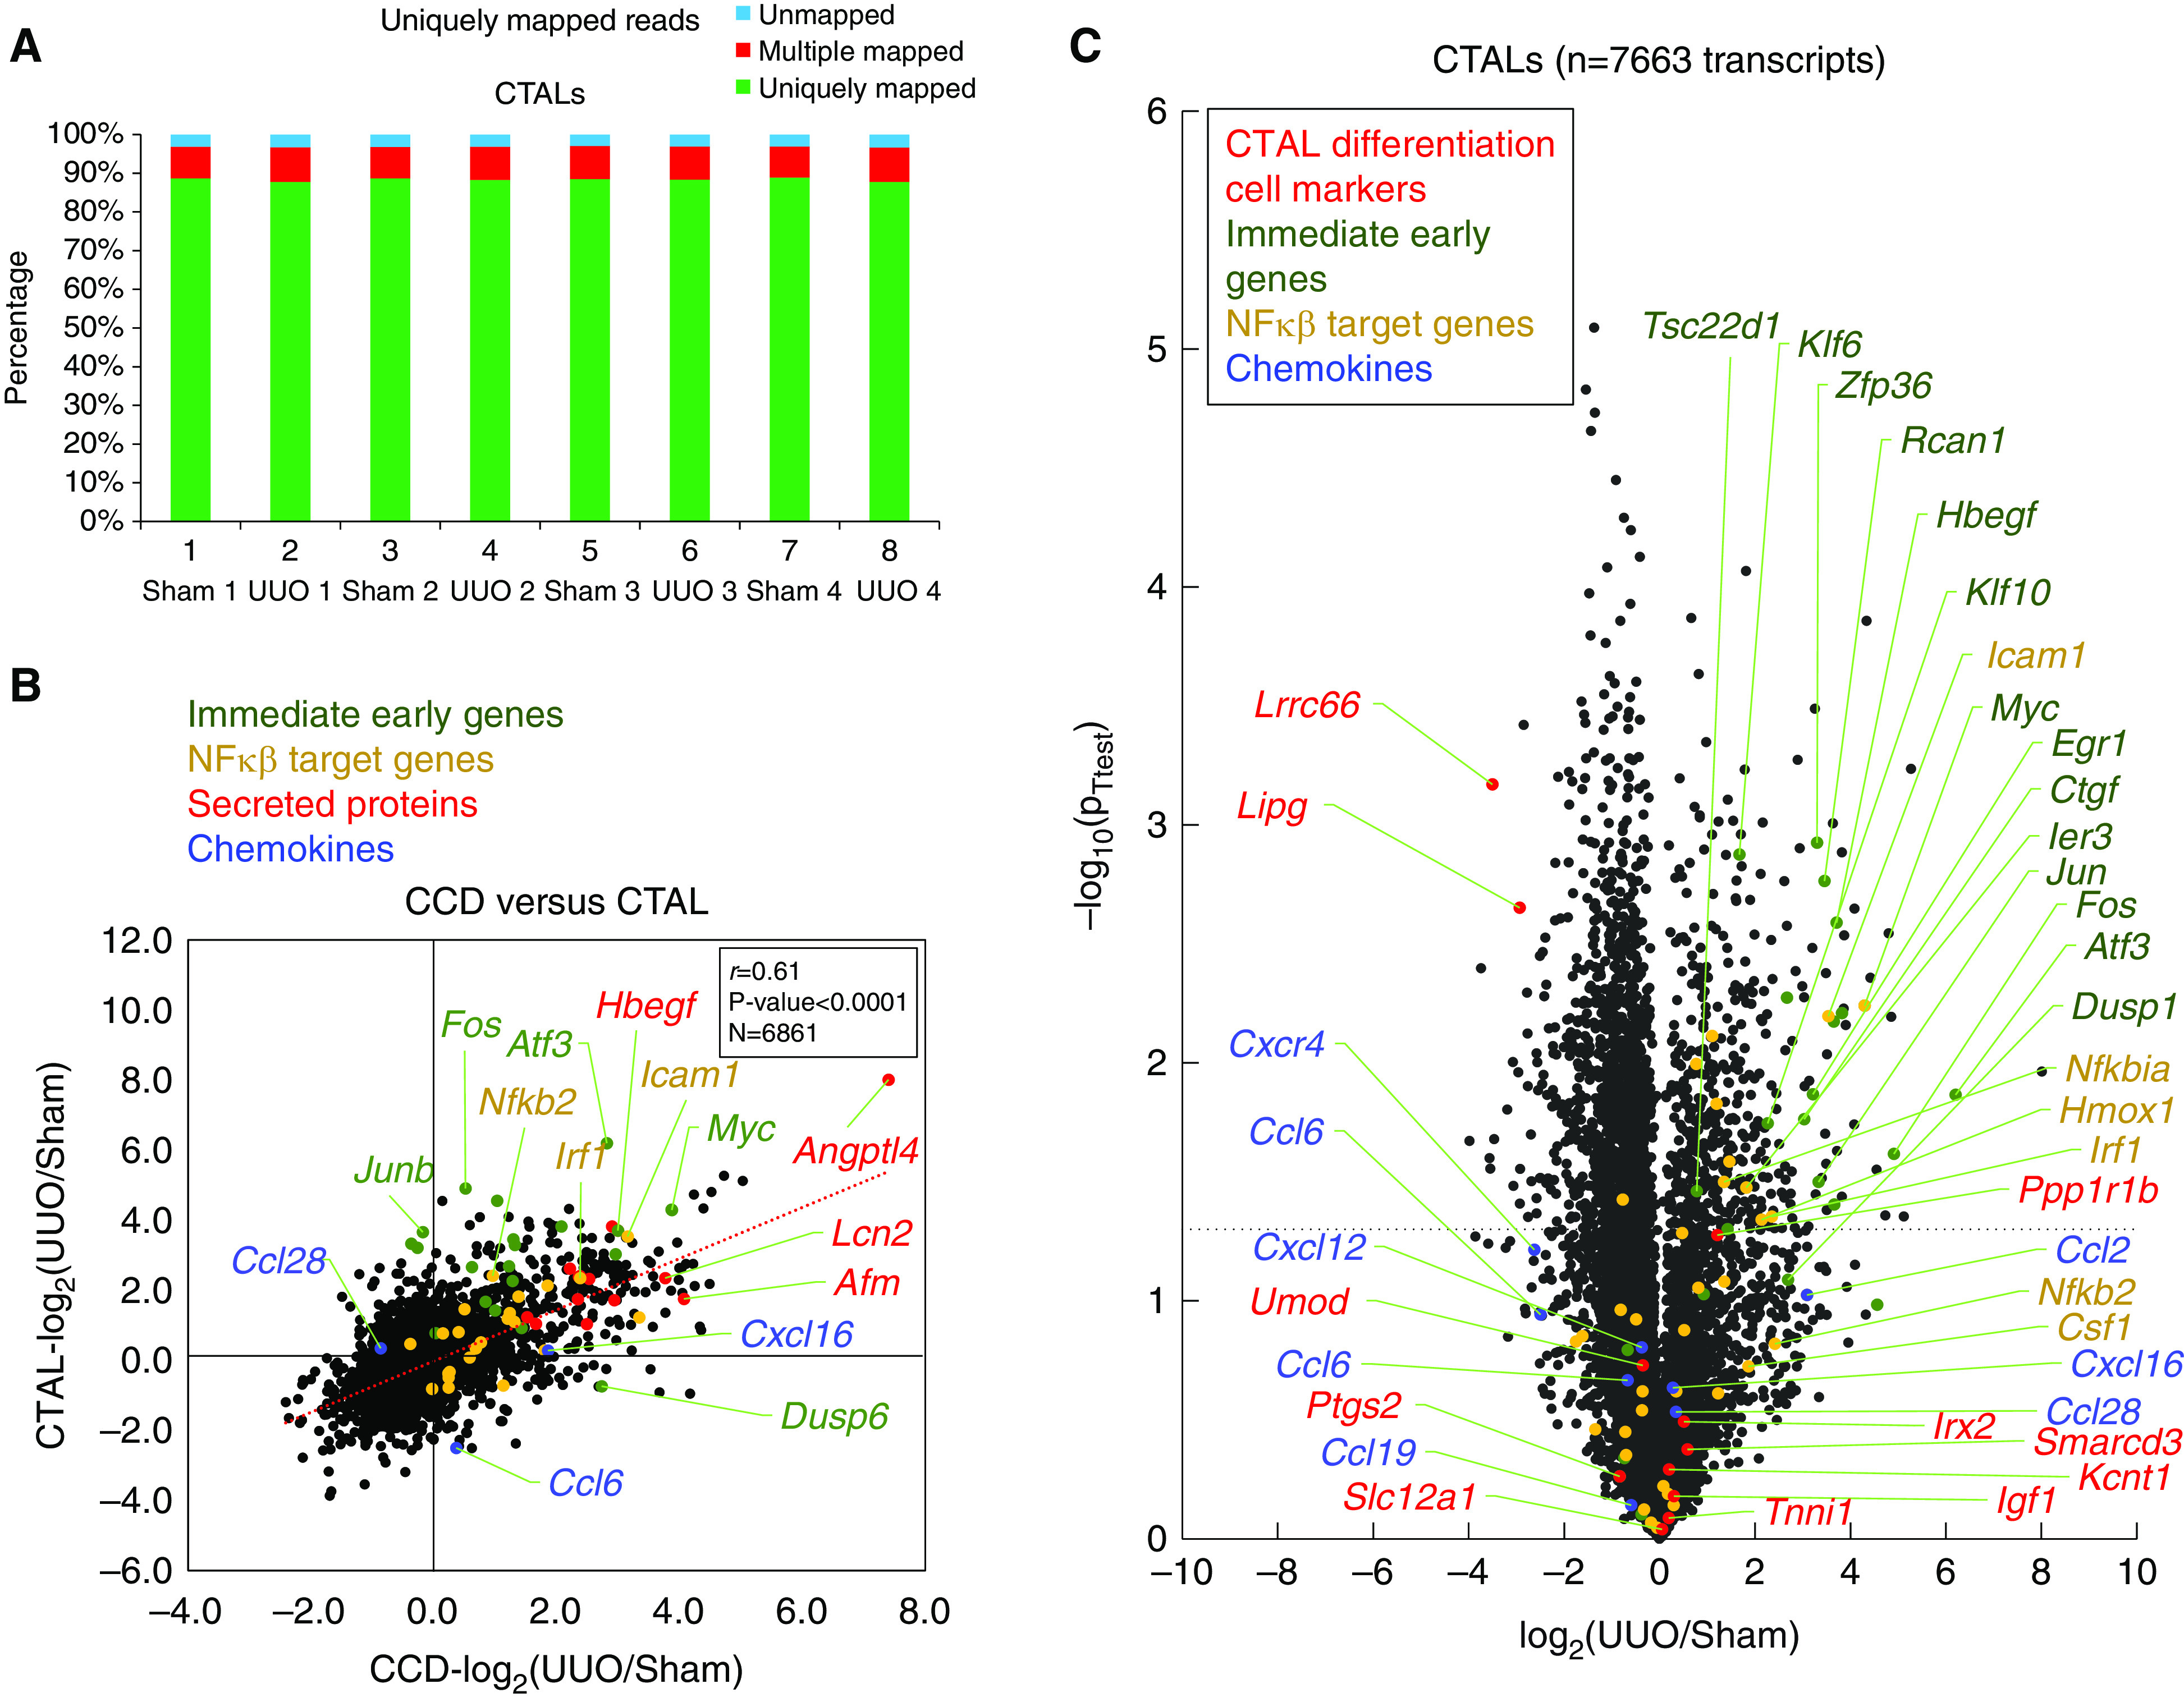
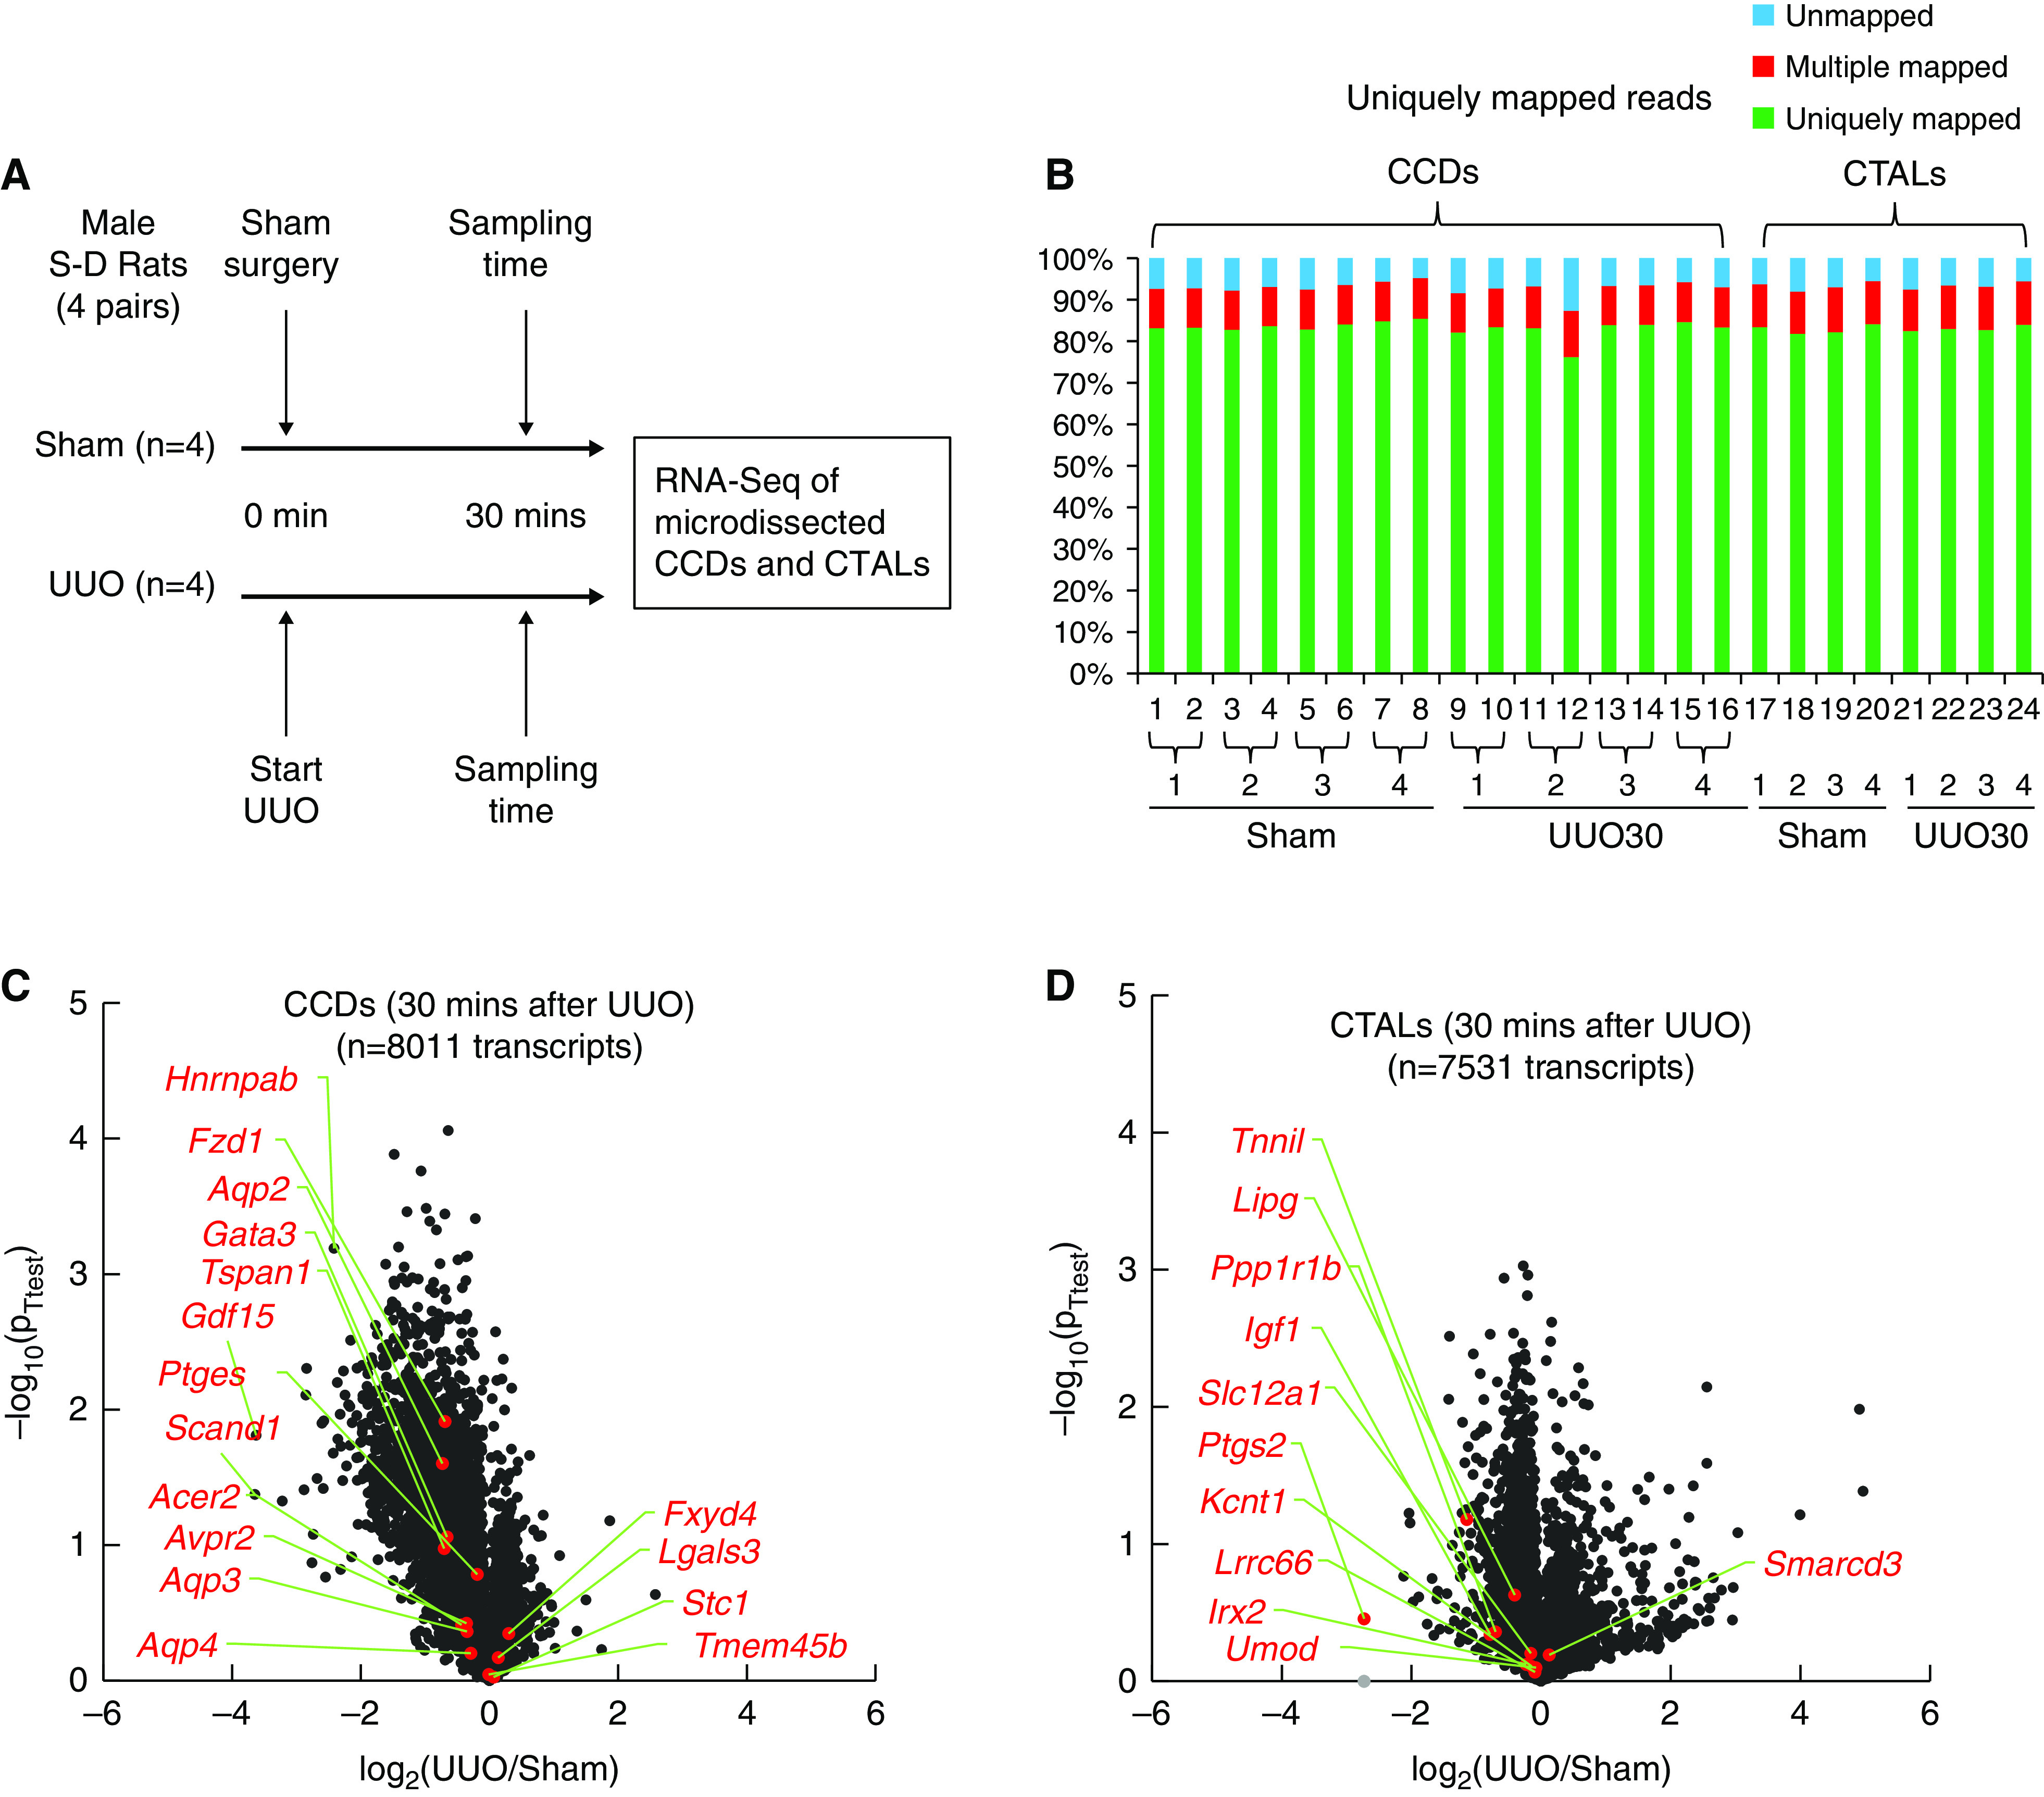
Methods: We performed RNA-Seq on microdissected rat cortical collecting ducts (CCDs) to identify early signaling pathways after establishment of UUO.

Results: Vasopressin V2 receptor (AVPR2) mRNA was decreased 3 hours after UUO, identifying one cause of AQP2 loss. Collecting duct principal cell differentiation markers were lost, including many not regulated by vasopressin. Immediate early genes in CCDs were widely induced 3 hours after UUO, including Myc, Atf3, and Fos (confirmed at the protein level). Simultaneously, expression of NF-κB signaling response genes known to repress Aqp2 increased. RNA-Seq for CCDs at an even earlier time point (30 minutes) showed widespread mRNA loss, indicating a "stunned" profile. Immunocytochemical labeling of markers of mRNA-degrading P-bodies DDX6 and 4E-T indicated an increase in P-body formation within 30 minutes.

Conclusions: Immediately after establishment of UUO, collecting ducts manifest a stunned state with broad disappearance of mRNAs. Within 3 hours, there is upregulation of immediate early and inflammatory genes and disappearance of the V2 vasopressin receptor, resulting in loss of AQP2 (confirmed by lipopolysaccharide administration). The inflammatory response seen rapidly after UUO establishment may be relevant to both UUO-induced polyuria and long-term development of fibrosis in UUO kidneys.

Keywords: P-body; RNA-Seq; aquaporin-2; collecting ducts; lipopolysaccharide; ureteral obstruction.


Figures

None
Graphical abstract
Figure 1.
Figure 1.
Rats with UUO display downregulation of AQP2 in the ipsilateral kidney. (A) Experimental design. UUO or sham surgery was followed by measurements at the indicated time points. (B) Immunoblot for AQP2 in the whole kidney at 0, 6, 12, and 24 hours after UUO (n=4 per time point). (C) Quantification of band densities (n=4 per time point, P values as indicated, one-way ANOVA with post hoc Dunn’s multiple comparison test). (D) Serum aldosterone concentration and (E) plasma renin activity (PRA) were measured at different time points after UUO (n=4 per time point, P values as indicated, one-way ANOVA with post hoc Dunn’s multiple comparison test). Error bars indicate SD; Gly-AQP2, glycosylated AQP2; non–Gly-AQP2, nonglycosylated AQP2; S-D, Sprague–Dawley.
Figure 2.
Figure 2.
Time course of changes in cell type-specific transcripts after UUO (bulk kidney RNA-Seq). (A) Experimental design. UUO or sham surgery was followed by bulk kidney RNA-Seq at 0-, 3-, 6-, and 12-hour time points (one pair per time point). (B) Percentage of uniquely mapped reads among whole kidney samples. (C) Transcript abundance changes of tubule segment-specific markers from bulk kidney RNA-Seq.
Figure 3.
Figure 3.
Transcript abundances in microdissected CCDs 3 hours after UUO. (A) Experimental design. CCDs and CTALs were microdissected followed by RNA-Seq, 3 hours after UUO (n=4) or sham surgery (n=4). (B) Percentage of uniquely mapped reads among CCDs samples (two samples from each rat). (C) Volcano plot for CCDs highlighting genes of interest, including CCD differentiation markers (red), immediate early genes (green), NF-κB target genes (yellow) and chemokines (blue). P values as indicated, paired t test.
Figure 4.
Figure 4.
Gene set analysis for regulatory pathways three hours after UUO. The 3-hour post-UUO RNA-Seq data (log2[UUO/sham] values) were plotted for members of curated gene sets. Error bars indicate 95% confidence interval allowing comparison with no change (zero value, vertical dashed line). The gene sets are listed in Supplemental Spreadsheet 2.
Figure 5.
Figure 5.
Representative immediate early genes in whole kidney sections after UUO. (A) Representative immunohistochemistry for c-Myc, Atf3, and c-Fos in kidney cortex at indicated time points after UUO (male S-D rats, n=3 per time point), scale bar=50 μm. (B) Quantification of positively stained area in (A) (P values as indicated, ANOVA with post hoc Dunn’s multiple comparison test; error bars indicate SD). (C) Representative immunofluorescence (IF) of c-Myc, Atf3, c-Fos (in cyan), and AQP2 (in red) at indicated time points after UUO (male S-D rats, n=1 per time point), scale bar=10 μm.
Figure 6.
Figure 6.
Transcript abundances in microdissected CTALs 3 hours after UUO. CTALs were microdissected, followed by RNA-Seq, 3 hours after UUO (n=4) or sham surgery (n=4). (A) Percentage of uniquely mapped reads among CTAL samples. (B) Scatter plot showing correlation between RNA-Seq data in CTALs versus CCDs in log2(UUO/sham) (Pearson correlation). (C) Volcano plot for CTALs highlighting genes of interest, including CTAL differentiation markers (red), immediate early genes (green), NF-κB target genes (yellow), and chemokines (blue). P values as indicated, paired t test.
Figure 7.
Figure 7.
Transcript abundances in microdissected CCDs and CTALs 30 minutes after UUO. (A) Experimental design. CCDs (two samples from each rat) and CTALs (one sample from each rat) were microdissected followed by RNA-Seq, 30 minutes after UUO (n=4) or sham surgery (n=4). (B) Percentage of uniquely mapped reads in microdissected tubules. Volcano plots for CCDs (C) and CTALs (D) indicating genes of interest. P values as indicated, paired t test.
Figure 8.
Figure 8.
Increased P-body scaffold proteins DDX6 and 4E-T in CCDs 30 minutes after UUO. (A) Experimental design. Sections were harvested for immunofluorescence 30 minutes after establishment of UUO (n=3) or sham surgery (n=3). P-bodies (green) marked by DDX6 (B) and 4E-T (C) formed in CCDs (for both AQP2 is shown in red) at 30 minutes after UUO. Scale bar=5 μm. (D) Quantification of immunofluorescence shown in (B) and (C). P values as indicated, paired t test. Error bars indicate SD.
Figure 9.
Figure 9.
Activation of NF-κB signaling and Aqp2 repression in microdissected CCDs 3 hours after LPS administration. (A) Experimental design. CCDs were microdissected followed by RNA-Seq, 3 hours post LPS (n=3) or vehicle (n=3) intraperitoneal (i.p.) injection. At 6 hours, kidney cortex from another three pairs of rats were harvested for quantitative RT-PCR (RT-qPCR) and immunoblotting. (B) Amplification plots of Aqp2 and Atp1a1 from RT-qPCR of cortex samples 6 hours after LPS (LPS, red) or 0.9% saline (vehicle, blue) (LPS, n=3; vehicle, n=3; 3 technical replicates for each sample). ΔRn, Δ Rn value. (C) Relative quantification data in panel B. P values as indicated, paired t test. Error bars indicate SD. (D) Immunoblot for AQP2 in the cortex 6 hours after LPS or 0.9% saline i.p. (LPS, n=3; vehicle, n=3); quantification of band density of blot is shown. (E) Percentage of uniquely mapped reads among microdissected CCD samples (LPS, n=3; vehicle, n=3; three samples for each rat). (F) Volcano plot for CCDs highlighting genes of interest, including NF-κB target genes (yellow), chemokines (blue), CCD cell markers (red), and immediate early genes (green). P values as indicated, paired t test. (G) Scatter plot showing correlation between RNA-Seq data in CCDs in log2(LPS/vehicles) versus CCDs in log2(UUO/sham) (Pearson correlation).

References

    1. Knepper MA, Kwon TH, Nielsen S: Molecular physiology of water balance. N Engl J Med 372: 1349–1358, 2015 - PMC - PubMed
    1. Nielsen S, Frøkiaer J, Marples D, Kwon TH, Agre P, Knepper MA: Aquaporins in the kidney: From molecules to medicine. Physiol Rev 82: 205–244, 2002 - PubMed
    1. Nielsen J, Hoffert JD, Knepper MA, Agre P, Nielsen S, Fenton RA: Proteomic analysis of lithium-induced nephrogenic diabetes insipidus: Mechanisms for aquaporin 2 down-regulation and cellular proliferation. Proc Natl Acad Sci U S A 105: 3634–3639, 2008 - PMC - PubMed
    1. Trepiccione F, Pisitkun T, Hoffert JD, Poulsen SB, Capasso G, Nielsen S, et al. : Early targets of lithium in rat kidney inner medullary collecting duct include p38 and ERK1/2. Kidney Int 86: 757–767, 2014 - PubMed
    1. Sung CC, Chen L, Limbutara K, Jung HJ, Gilmer GG, Yang CR, et al. : RNA-Seq and protein mass spectrometry in microdissected kidney tubules reveal signaling processes initiating lithium-induced nephrogenic diabetes insipidus. Kidney Int 96: 363–377, 2019 - PMC - PubMed

Publication types