. 2022 Aug 2;13(1):4296.
doi: 10.1038/s41467-022-31750-1.

Transcriptomic diversity in human medullary thymic epithelial cells

Affiliations

Transcriptomic diversity in human medullary thymic epithelial cells

Jason A Carter et al. Nat Commun. .

Abstract

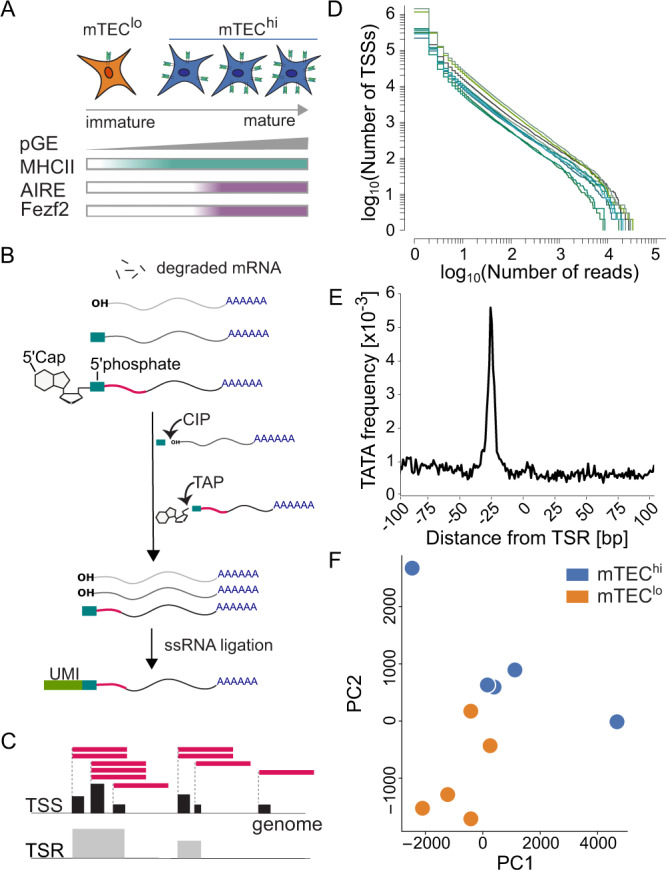
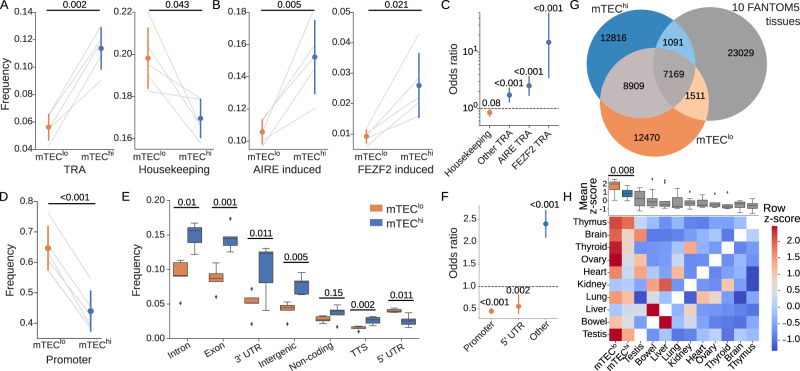
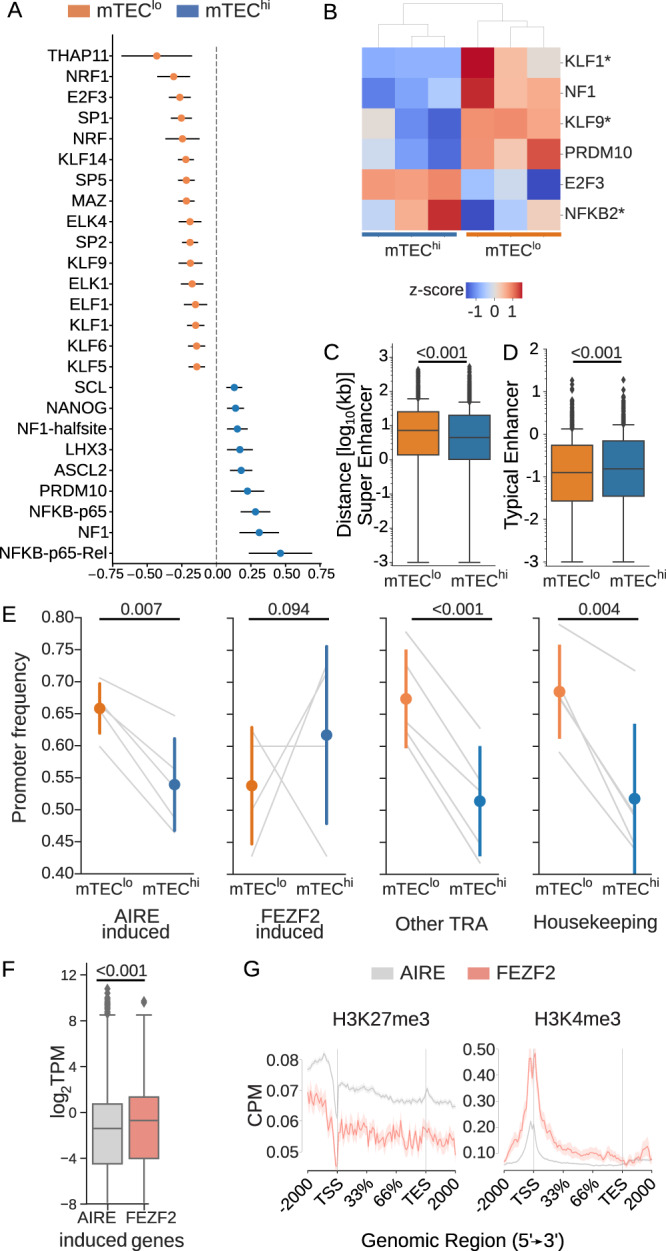
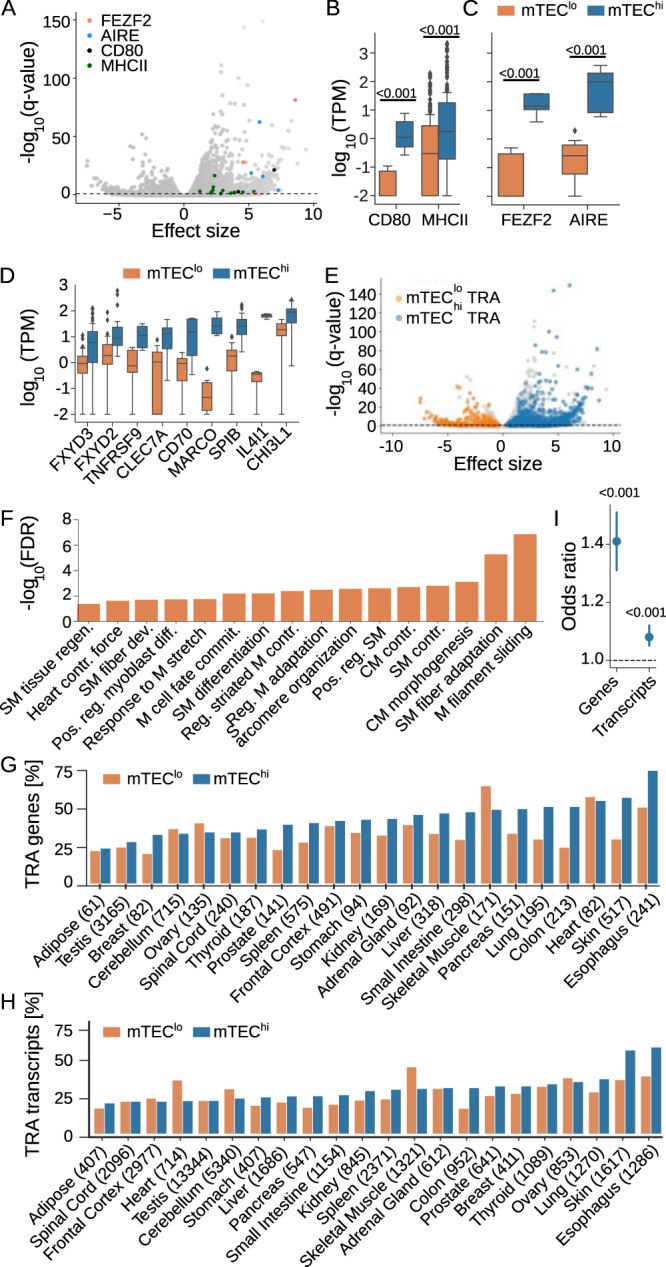
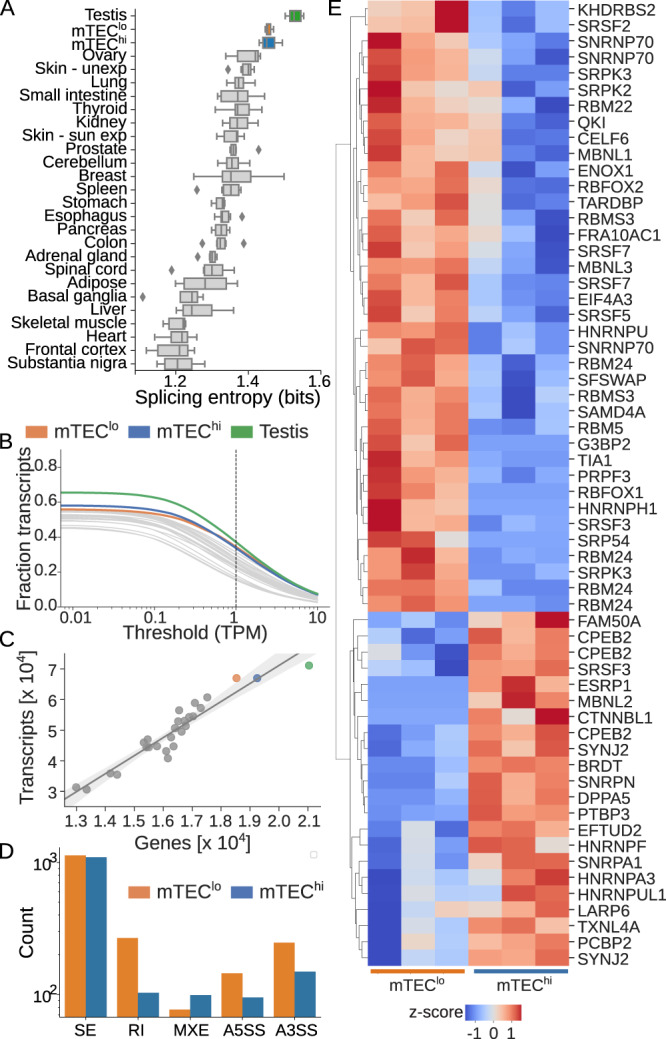
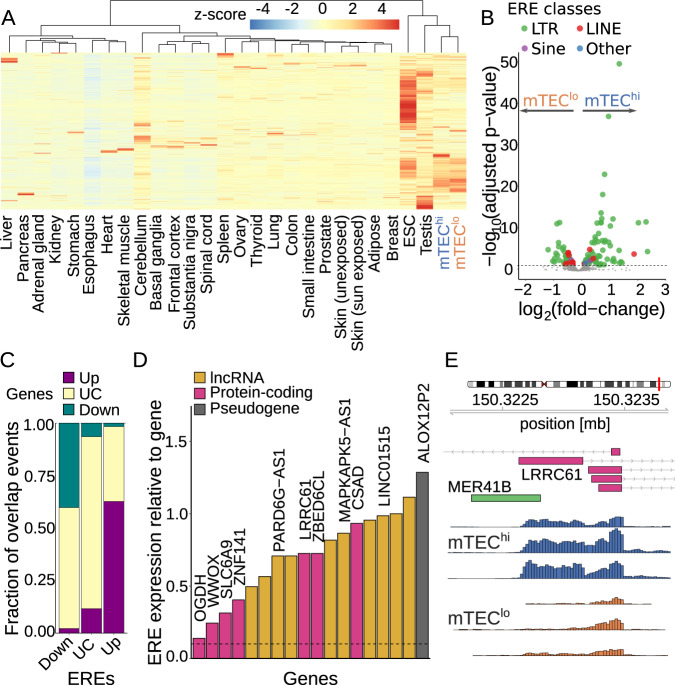
The induction of central T cell tolerance in the thymus depends on the presentation of peripheral self-epitopes by medullary thymic epithelial cells (mTECs). This promiscuous gene expression (pGE) drives mTEC transcriptomic diversity, with non-canonical transcript initiation, alternative splicing, and expression of endogenous retroelements (EREs) representing important but incompletely understood contributors. Here we map the expression of genome-wide transcripts in immature and mature human mTECs using high-throughput 5' cap and RNA sequencing. Both mTEC populations show high splicing entropy, potentially driven by the expression of peripheral splicing factors. During mTEC maturation, rates of global transcript mis-initiation increase and EREs enriched in long terminal repeat retrotransposons are up-regulated, the latter often found in proximity to differentially expressed genes. As a resource, we provide an interactive public interface for exploring mTEC transcriptomic diversity. Our findings therefore help construct a map of transcriptomic diversity in the healthy human thymus and may ultimately facilitate the identification of those epitopes which contribute to autoimmunity and immune recognition of tumor antigens.


Conflict of interest statement

The authors declare no competing interests.

Figures

Fig. 1
Fig. 1. Overview of mTEC transcription start regions identified by 5’Cap sequencing.
A Medullary thymic epithelial cells (mTECs) undergo a maturation process that is characterized by the levels of promiscuous gene expression (pGE), MHCII expression, and expression of transcription factors AIRE and FEZF2. B Schematic overview of the 5'Cap sequencing method. As previously described, transcripts with a 5'Cap were isolated using calf intestinal phosphatase (CIP) and tobacco acid pyrophosphatase (TAP) prior to single-stranded RNA (ssRNA) ligation, incorporation of unique molecular identifiers (UMIs), and further library preparation. C Following next-generation sequencing, reads were aligned and the number of transcription start sites (TSSs) detected using 5'Cap sequencing were counted at each genomic position. Nearby TSSs were clustered into transcription start regions (TSRs). Distribution of TSSs identified using 5'Cap sequencing followed D a power-law distribution (colors represent samples) and E enrichment of TATA motifs for TSRs were concordant with those identified in the RefTSS database. F Principal component (PC) analysis shows clustering of mTEChi (n = 5) and mTEClo samples (n = 5). Source data for E and F are provided in the Source Data file.
Fig. 2
Fig. 2. The mTEChi population has increased rates of transcript mis-initiation.
Comparison of the frequency with which transcription start regions (TSRs) are associated with A tissue-restricted antigens (TRAs), housekeeping genes, B autoimmune regulator (AIRE)- and FEZF2-dependent genes between paired (gray lines) human mTEClo (orange) and mTEChi (blue) samples. C mTEChi vs. mTEClo odds ratio comparing the frequency of FEZF2- and AIRE-induced TRAs, other TRAs not associated with FEZF2 or AIRE, and housekeeping genes. D Fraction of mTEC-population-specific TSRs mapping to known promoter regions. E Distribution of genomic location annotations for TSRs unique to either the mTEChi or mTEClo populations. Boxplots show median values with interquartile ranges and extrema (whiskers at 1.5× IQR). Outliers beyond 1.5× IQR are shown as dots. TTS transcription termination site, UTR untranslated region. F mTEChi vs. mTEClo odds ratio for TSRs falling into 5' UTR, known promoter regions, and all other annotated regions. G Overlap between TSRs found in at least one mTEChi, mTEClo, and/or normal FANTOM5 peripheral tissue sample. H Leave-one-out analysis comparing TSR usage across mTEChi, mTEClo, and 10 pooled peripheral tissue samples from the FANTOM5 consortium. In brief, one sample type was excluded and the set of TSRs unique to one tissue type among the remaining samples was calculated. The fraction of TSRs expressed in the excluded sample was then reported for each set of otherwise tissue-specific TSRs as a row z-score. The top barplot shows the column mean z-score across all tissue types. Error bars show either standard deviation (A, B, D) or 95% confidence intervals (C, F). Odds ratio values (C, F) greater than 1 represent increased use in mTEChi TSRs; bars color-coded by population with increased odds. Values above horizontal bars indicate p values derived by two-sided paired t-test (A, B, D, E, H) or two-sided Fisher's exact test (C, F); all panels: n = 5 paired mTEC samples. Source data for all panels are provided in the Source Data file.
Fig. 3
Fig. 3. AIRE may predominately contribute to transcript mis-initiation.
A Log2 odds ratio (OR) point estimate for transcription factor motifs enriched (p ≤ 0.05 by Fisher's exact test after Bonferroni correction) within 200 bp of either mTEChi- or mTEClo-specific TSRs. OR values greater than 0 represent increased use surrounding mTEChi-specific TSRs; color-coded by population with increased odds. B Of those known transcription factor motifs enriched around mTEChi- or mTEClo-specific TSRs (A), only six genes were found to be differentially expressed (Wald test, Benjamini–Hochberg adjusted q ≤ 0.05) by RNA sequencing. Only 3 of these 6 transcripts (indicated by an asterisk) were enriched in the mTEC population expected from the motif enrichment around the TSRs. C Distance in kilobases (kb) to nearest known super enhancer or D typical enhancer in SEdb. E mTEChi-specific TSRs were more commonly located outside of known promoter regions for AIRE-induced genes, but not for FEZF2-induced genes. TRAs not induced by either AIRE or FEZF2 and housekeeping genes also show mTEChi-specific TSRs enriched outside promoters. F Distribution of transcript-level expression values in mTEChi cells demonstrates a higher average expression of FEZF2-induced genes relative to AIRE-induced genes. TPM transcripts per million. G Mouse Chromatin ImmunoPrecipitation sequencing (ChIP-Seq) data (n = 4) demonstrates higher mean (central line) counts per million mapped reads (CPM) of H3K4me3 (histone marker of transcriptional activation, top) for FEZF2 genes. Conversely, higher CPM of H3K27me3 (transcriptional repression, bottom) was observed for AIRE-induced genes. Error bars or bands show either 95% confidence intervals (A, G) or standard deviation (E); boxplots show median (central line) with interquartile range (IQR, box) and extrema (whiskers at 1.5× IQR). Outliers beyond 1.5× IQR are shown as dots (C, D, G). Values above horizontal bars indicate p values derived by the two-sided Mann–Whitney U test (C, D, F) or by the two-sided paired t-test (E). AF: n = 5 paired mTEC samples. Source data for AF are provided in the Source Data file.
Fig. 4
Fig. 4. Differential expression of tissue-restricted antigens across mTEC populations.
A Enrichment of the mature mTEC marker CD80 and MHCII transcripts, as well as AIRE and FEZF2 transcripts in the mTEChi population (Wald test, effect size ≥0). B Comparison of average expression across all transcripts for CD80, MHCII, C FEZF2, and AIRE. D mTEChi marker genes identified previously were similarly enriched in our mTEChi population: FXYD3, FXYD2, TNFRSF9, SP1B (p < 0.001), CD70 (p = 0.01), MARCO (p = 0.005), IL4L1 (p = 0.1) and CH13L1 (p = 0.004); by two-sided Mann–Whitney U test. E Enrichment of 1747 and 374 tissue-restricted antigen (TRA) transcripts in the mTEChi and mTEClo populations, respectively (Wald test, effect size ≥0). F Gene ontology analysis of those TRAs enriched in the mTEClo population revealed a strong preference for muscle-related functions. SM skeletal muscle, CM cardiac muscle, M muscle, Regen regeneration, Pos. reg. positive regulation, Contr contraction, diff differentiation, Commit commitment. G Percentage of tissue-specific TRA genes and H transcripts expressed in the mTEClo and mTEChi populations; absolute numbers in parentheses. I Odds ratio of mTEChi:mTEClo TRA expression on gene and transcript level. The relative expression of TRA transcripts was more similar between the two populations. Error bars show 95% confidence intervals. Boxplots show median (central line) with interquartile range (IQR, box) and extrema (whiskers at 1.5× IQR). Outliers beyond 1.5× IQR are shown as dots (B, D). Values above horizontal bars indicate p values derived by the two-sided Mann–Whitney U test (B, C) or Fisher's exact test (I); all panels: n = 5 paired mTEC samples. Source data for all panels are provided in the Source Data file.
Fig. 5
Fig. 5. Alternative splicing in mTECs is mediated by differential expression of peripheral splicing factors.
A Splicing entropy calculated for mTEChi and mTEClo as well as 25 healthy peripheral tissue samples from GTEx. Boxplots show median (central line) with interquartile range (IQR, box) and extrema (whiskers at 1.5× IQR). Outliers beyond 1.5× IQR are shown as dots. B Fraction of transcriptome expressed at varying transcript per million (TPM) thresholds for mTEC and peripheral tissue samples. C Linear regression fitting the number of expressed transcripts as a function of the number of expressed genes in healthy GTEx samples predicts number of transcripts in mTEChi and mTEClo samples. The gray shaded area marks the 95% confidence interval. D Differential splicing between the mTEChi and mTEClo populations as predicted by rMATS divided by skipped exons (SE), retained introns (RI), alternative 5' and 3' splice sites (A5SS, A3SS), and mutually exclusive exons (MXE). E Clustermap showing row z-scored expression of known peripheral tissue splicing factor transcripts significantly (q ≤ 0.05 by Wald test) enriched in either the mTEClo (count = 38) or mTEChi (count = 22) population. All panels: n = 5 paired mTEC samples, n = 6 samples per GTEx tissue. Source data for A, CE are provided in the Source Data file.
Fig. 6
Fig. 6. Changes in ERE expression during mTEC maturation.
A Expression (in z-scored TPM counts) for 613 ERE subfamilies identified with SalmonTE in mTECs, embryonic stem cells (ESCs), and 25 GTEx tissues. B Differential expression (Wald test) of 818 ERE subfamilies detected by TEtranscripts during mTEC maturation, colored by class. C Overlap of expression status between genes and EREs with a TSS within the gene body ±1000 bp. The gene expression status is color-coded by the differential expression between mTEChi and mTEClo: Up upregulated, Down downregulated, UC unchanged; corresponding categorization for ERE expression on x-axis. D Contribution of ERE expression to the expression of an annotated gene for each ERE-initiated chimeric transcript unique to the mTEChi population detected by LIONS. Transcripts are colored by gene biotype; lncRNA long non-coding RNA. Genes with annotated gene names are highlighted. E MTEChi-specific initiation event from the MER41B promoter (LTR) into the protein-coding gene LRRC61. Expression tracks show counts per million in the mTEC populations. All panels: n = 5 paired mTEC samples, n = 6 samples per GTEx tissue. Source data for AD are provided in the Source Data file.

Similar articles

Cited by

References

    1. Klein L, Kyewski B, Allen P, Hogquist K. Positive and negative selection of the T cell repertoire: what thymocytes see (and don’t see) Nat. Rev. Immunol. 2014;14:377–391. doi: 10.1038/nri3667. - DOI - PMC - PubMed
    1. Derbinski J, Schulte A, Kyewski B, Klein L. Promiscuous gene expression in medullary thymic epithelial cells mirrors the peripheral self. Nat. Immunol. 2001;2:1032–1039. doi: 10.1038/ni723. - DOI - PubMed
    1. Anderson MS, et al. Projection of an immunological self shadow within the thymus by the aire protein. Science. 2002;298:1395–401. doi: 10.1126/science.1075958. - DOI - PubMed
    1. DeVoss J, Hou Y, Johannes K, Lu W, Liou G. Spontaneous autoimmunity prevented by thymic expression of a single self-antigen. J. Exp. Med. 2006;203:2727–2735. doi: 10.1084/jem.20061864. - DOI - PMC - PubMed
    1. Gavanescu I, Kessler B, Ploegh H, Benoist C, Mathis D. Loss of AIRE-dependent thymic expression of a peripheral tissue antigen renders it a target of autoimmunity. Proc. Natl Aacd. Sci. USA. 2007;104:4583–4587. doi: 10.1073/pnas.0700259104. - DOI - PMC - PubMed

Publication types