. 2022 Aug 2;13(8):671.
doi: 10.1038/s41419-022-05123-x.

BET bromodomain inhibition rescues PD-1-mediated T-cell exhaustion in acute myeloid leukemia

Affiliations

BET bromodomain inhibition rescues PD-1-mediated T-cell exhaustion in acute myeloid leukemia

Mengjun Zhong et al. Cell Death Dis. .

Erratum in

Abstract

Sustained expression of programmed cell death receptor-1 (PD-1) is correlated with the exhaustion of T cells, and blockade of the PD-1 pathway is an effective immunotherapeutic strategy for treating various cancers. However, response rates are limited, and many patients do not achieve durable responses. Thus, it is important to seek additional strategies that can improve anticancer immunity. Here, we report that the bromodomain and extraterminal domain (BET) inhibitor JQ1 inhibits PD-1 expression in Jurkat T cells, primary T cells, and T-cell exhaustion models. Furthermore, JQ1 dramatically impaired the expression of PD-1 and T-cell immunoglobulin mucin-domain-containing-3 (Tim-3) and promoted the secretion of cytokines in T cells from patients with acute myeloid leukemia (AML). In line with that, BET inhibitor-treated CD19-CAR T and CD123-CAR T cells have enhanced anti-leukemia potency and resistant to exhaustion. Mechanistically, BRD4 binds to the NFAT2 and PDCD1 (encoding PD-1) promoters, and NFAT2 binds to the PDCD1 and HAVCR2 (encoding Tim-3) promoters. JQ1-treated T cells showed downregulated NFAT2, PD-1, and Tim-3 expression. In addition, BET inhibitor suppressed programmed death-ligand 1 (PD-L1) expression and cell growth in AML cell lines and in primary AML cells. We also demonstrated that JQ1 treatment led to inhibition of leukemia progression, reduced T-cell PD-1/Tim-3 expression, and prolonged survival in MLL-AF9 AML mouse model and Nalm6 (B-cell acute lymphoblastic leukemia cell)-bearing mouse leukemia model. Taken together, BET inhibition improved anti-leukemia immunity by regulating PD-1/PD-L1 expression, and also directly suppressed AML cells, which provides novel insights on the multiple effects of BET inhibition for cancer therapy.


Conflict of interest statement

The authors declare no competing interests.

Figures
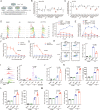
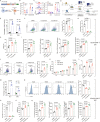
Fig. 1
Fig. 1. Molecular compound screening identifies JQ1 that suppresses PD-1 expression of Jurkat cell and T cell.
A Flow diagram of the experimental design. B Plot of the ratio of PD-1 expression on Jurkat cells treated with the indicated compounds as detailed in Supplemental Table 5 (n = 3). C Plot of the ratio of PD-1 expression on Jurkat cells stimulated with 150 ng/mL PHA and the same compounds as that shown in Supplemental Table 5 (n = 3). D Jurkat cells were treated with 0.5 μM JQ1 with and without PHA (150 ng/mL) stimulation, and PD-1 expression was determined by FACS at the indicated time points (n = 4). E Jurkat cells were treated with 0.5 μM JQ1 with and without PHA (150 ng/mL) stimulation, and PD-1 expression was determined by qRT-PCR at the indicated time points (n = 3). F Jurkat cells were treated with indicated doses of JQ1 for 24 h in the presence or absence of PHA (150 ng/mL), PD-1 expression was determined by qRT-PCR (n = 5). G Jurkat cells were treated with indicated doses of JQ1 for 24 h in the presence or absence of PHA (150 ng/mL), PD-1 expression was determined by FACS (n = 4). H CD8 + T cells from healthy donors were treated with 0.5 μM JQ1 for 24 h with and without P/I (PMA: 20 ng/L, ionomycin: 0.5 μM) stimulation, and PD-1 expression was determined by FACS (n = 3). I CD4 + T cells from healthy donors were treated with 0.5 μM JQ1 for 24 h in the presence and absence of PHA (500 ng/ml), P/I (PMA: 20 ng/L, ionomycin: 0.5 μM), or anti-CD3/CD28 (anti-CD3: 200 ng/ml, anti-CD28: 200 ng/ml), and PD-1 expression was determined by FACS (n = 4). J CD8 + T cells from healthy donors were treated with 0.5 μM JQ1 for 24 h with and without P/I (PMA: 20 ng/L, ionomycin: 0.5 μM) stimulation, and CD69 expression was determined by FACS (n = 3). K CD4 + T cells and CD8 + T cells were treated with 0.5 μM JQ1 for 24 h, and the secretions of IL-2 were evaluated by ELISA (n = 4). L CD4 + T cells and CD8 + T cells were treated with 0.5 μM JQ1 for 24 h, and the secretions of IFN-γ were evaluated by ELISA (n = 4). M CD4 + T cells and CD8 + T cells were treated with 0.5 μM JQ1 for 24 h, and the secretions of TNF-α were evaluated by ELISA (n = 4). Data in (BM) were expressed as mean ± SD. n = 3 or more independent biological replicates, presented as individual points. P value < 0.05 was considered to be significant (DG: two-way ANOVA, B, C, HM: one-way ANOVA with Bonferroni post hoc test).
Fig. 2
Fig. 2. BRD4 inhibition suppresses the expression of PD-1 and Tim-3.
A Jurkat cells stimulated with or without PHA (150 ng/mL) were treated with the BET inhibitors PFI-1 (5 μM) and ABBV-744 (2 μM) for 24 h, then PD-1 expression was determined by flow cytometry (n = 3). B Jurkat cells stimulated with or without PHA (150 ng/mL) were treated with the BET inhibitors PFI-1 (5 μM) and ABBV-744 (2 μM) for 24 h, then PD-1 expression was determined by qRT-PCR (n = 3). C Similar to Jurkat cells, CD8 + T cells were administrated with PFI-1 (5 μM), and ABBV-744 (2 μM) for 24 h stimulated with or without P/I, and PD-1 expression was determined by FACS (n = 3). D After Jurkat cells were stimulated with and without 150 ng/mL PHA after BRD4 knockdown by siRNA, BRD4 expression was examined by qRT-PCR (n = 3). E After Jurkat cells were stimulated with and without 150 ng/mL PHA after BRD4 knockdown by siRNA, PD-1 expression was determined by FACS (n = 3). F Jurkat cells were transfected by BRD4 overexpression lentivirus, then BRD4 expression was examined by qRT-PCR (n = 4) and western blot. G PD-1 expression of Jurkat cells was detected by FACS after BRD4 overexpression lentivirus was transfected (n = 4). H Jurkat cells were treated with 0.5 μM JQ1 for 24 h in the presence and absence of PHA (150 ng/mL), then the expression of Tim-3 was examined by FACS (n = 3). Data in (AH) are expressed as mean ± SD. n = 3 or more independent biological replicates, presented as individual points. For western blot, similar results were obtained for three independent biological experiments. P value < 0.05 was considered to be significant (AE, H: one-way ANOVA with Bonferroni post hoc test; F, G: two-tailed unpaired Student’s t tests).
Fig. 3
Fig. 3. BRD4 inhibition reverses T-cell exhaustion.
A Structural diagram of HA-28z CAR and HA-28z CAR-induced T-cell exhaustion. B HA-28z CAR Jurkat cells were treated with 0.5 μM JQ1 for 24 h, and PD-1 expression was determined by FACS (n = 5). C HA-28z CAR T cells positively selected by CD3 microbeads from peripheral blood mononuclear cells (PBMC) were treated with 0.05 μM and 0.15 μM JQ1 for 48 h, and PD-1 expression was determined by flow cytometry (n = 4). D Experimental design: CAR T cells were co-cultured with GFP/luciferase-expressing AML or B-ALL cells for 72 h, after eradication of leukemia cells, residual CAR T cells were collected and treated with JQ1 for another 72 h, then JQ1 was removed by centrifugation. Next, the CAR T cells in each group were counted and seeded at the same amount followed by a second co-culture with leukemia cells or CCK-8 assay. E The percentage of PD-1 and Tim-3 on CD19-CAR T cells after co-cultured with Nalm6-GL cells for 72 h were detected by flow cytometry (n = 4). F, G After being administrated with JQ1 for 72 h, the percentage of PD-1 and Tim-3 on exhausted CD19-CAR T cells were detected by flow cytometry (n = 4). H After being treated with indicated doses of JQ1 for 72 h, exhausted CD19-CAR T cells were co-cultured with Nalm6-GL cells in an E:T ratio of 1:1 for 48 h, and the remaining Nalm6-GL cells were assayed for luminescence (n = 4). I The cytokines in the supernatant of CD19-CAR T cells co-cultured with Nalm6-GL cells after JQ1 administration were detected by ELISA (n = 4). J FACS was used to monitor the percentage of CD19-CAR T cells after JQ1 administration for 72 h (n = 3). K CD19-CAR T cells were sorted, and co-cultured with Nalm6-GL for 72 h, then CD19-CAR T cells were treated with 0.15 μM or 0.25 μM JQ1, and the viability of CD19-CAR T cells was detected by CCK-8 (n = 3). L After co-cultured with Nalm6-GL cells for 72 h, CD19-CAR T cells were again co-cultured with Nalm6-GL cells in the presence of anti-PD-1 for 48 h, or were again co-cultured with Nalm6-GL cells after the treatment of 0.25 μM JQ1 for 72 h, and the remaining Nalm6-GL cells were assayed for luminescence (n = 3). M The percentage of PD-1 and Tim-3 on CD123-CAR T cells after co-cultured with MV411-GL cells for 72 h were detected by flow cytometry (n = 3). N, O After being administrated with JQ1 for 72 h, the percentage of PD-1 and Tim-3 on exhausted CD123-CAR T cells were detected by flow cytometry (n = 3). P After being treated with indicated doses of JQ1 for 72 h, exhausted CD123-CAR T cells were co-cultured with MV411-GL cells in an E:T ratio of 1:1 for 48 h, and the remaining MV411-GL cells were assayed for luminescence (n = 3). Q The cytokines in the supernatant of CD123-CAR T cells co-cultured with MV411-GL cells after JQ1 administration were detected by ELISA (n = 3). Data are expressed as mean ± SD. n = 3 or more independent biological replicates, presented as individual points. P value < 0.05 was considered to be significant (BO: one-way ANOVA with Dunnett post hoc test; L: one-way ANOVA with Bonferroni post hoc test).
Fig. 4
Fig. 4. BET inhibition reverses the exhausted phenotype of T cells from AML patients.
A Flow diagram of the experimental design. B CD4 + T cells (first row) and CD8 + T cells (second row) from bone marrow (BM) of newly diagnosed AML patients were treated with 0.5 μM JQ1 for 24 h, and the percentages of PD-1-positive (first column), Tim-3-positive (second column) and PD-1 and Tim-3 double-positive (third column) cells were determined by FACS. C CD3 + T cells from patients were treated with 0.5 μM JQ1 for 24 h, and the percentages of IL-2, IFN-γ, and TNF-α from CD3 + T cells were evaluated by intracellular flow cytometry. D CD3 + T cells from AML patients (n = 4 samples) were treated with 0.5 μM JQ1 for 24 h, and the percentages of the CD4 + (upper), and CD8 + (lower) subpopulations were shown with differences in the phenotypic distribution of naive (CCR7 + CD45RA + , second column), TCM (CCR7 + CD45RA − , third column), TEM (CCR7 − CD45RA − , fourth column), and TEMRA (CCR7 − CD45RA + , right) T-cell subsets. E © Concatenated files representing AML samples in the DMSO group (upper) and JQ1 (lower) groups projected in tSEN plots after gating on lymphocyte cells. Distribution of naive, TCM, TEM, and TEMRA CD4 + T cells were shown as dark red, dark yellow, dark green, and dark purple, respectively, and the distribution of naive, TCM, TEM, and TEMRA CD8 + T cells were shown as light red, light yellow, light green, and light purple, respectively. F CD3 + T cells from AML patients (n = 4 samples) were treated with 0.5 μM JQ1 for 24 h, and the percentages of PD-1 positive (upper row) and Tim-3 positive (lower row) cells in naive (left), TCM (second column), TEM (third column), and TEMRA (right) CD4 + T cells were determined by FACS. Data are expressed as mean ± SD. P value < 0.05 was considered to be significant (two-tailed paired Student’s t tests).
Fig. 5
Fig. 5. BRD4 inhibition suppresses the expression of PD-1 and Tim-3 via NFAT2.
A The top 12 enriched terms of the Kyoto Encyclopedia of Genes and Genomes (KEGG) enrichment pathway analyses were shown in the bubble plot (DMSO + PHA VS DMSO). The KEGG pathways was identified by R package “clusterProfiler”, and P < 0.05 was considered statistically significant. B Scatter plot of top 15 enriched KEGG pathways were shown in the bubble plot (DMSO + PHA VS JQ1 + PHA). C A heatmap of the expression of genes involved in the TCR signaling pathway in Jurkat cells was analyzed by RNA-seq. D CD8 + T cells were cultured with 100 ng/ml FK506 for 24 h in the presence and absence of P/I (PMA: 20 ng/L, ionomycin: 0.5 μM), NFAT2 expression was determined by qRT-PCR (n = 4). E PD-1 expression of CD8 + T cells treated with 100 ng/ml FK506 for 24 h in the presence and absence of P/I was determined by FACS (n = 4). F PD-1 expression of CD8 + T cells treated with 100 ng/ml FK506 for 24 h in the presence and absence of P/I was determined by qRT-PCR (n = 4). G Jurkat cells were stimulated with and without PHA (150 ng/mL) after NFAT2 knockdown, then qRT-PCR was used to examine the expression of NFAT2 (n = 4). H PD-1 expression of Jurkat cells stimulated with and without PHA (150 ng/mL) after NFAT2 knockdown was determined by FACS (n = 3). I PD-1 expression of Jurkat cells stimulated with and without PHA (150 ng/mL) after NFAT2 knockdown was determined by qRT-PCR (n = 3). J Jurkat cells were treated with 0.5 μM JQ1 for 24 h in the presence and absence of PHA (150 ng/mL), and NFAT2 expression was detected by immunofluorescence. K Jurkat cells were treated with 0.5 μM JQ1 for 24 h in the presence and absence of PHA (150 ng/mL), and NFAT2 expression was detected by western blot. L NFAT2 expression was examined by western blot after overexpressing BRD4 in Jurkat cells. Shown are the representative images of three separate experiments. M Jurkat cells were treated with 0.5 μM JQ1 for 24 h in the presence and absence of PHA (150 ng/mL), the expression of JUN was examined by qRT-PCR (n = 3). N JUN expression was detected by qRT-PCR after BRD4 overexpression in Jurkat cells (n = 3). O Chromatin samples from Jurkat cells stimulated with 150 ng/ml PHA for 24 h were immunoprecipitated with anti-BRD4 antibody, and enrichment of BRD4 at the promoter regions of NFAT2 and PDCD1 was measured by qRT-PCR (n = 3). P The chromatin samples were stimulated with 150 ng/ml PHA for 24 h and immunoprecipitated with an anti-NFAT2 antibody, enrichment of NFAT2 at the promoter regions of PDCD1 and HAVCR2 was measured by qRT-PCR (n = 3). Data are expressed as mean ± SD. n = 3 or more independent biological replicates, presented as individual points. P value < 0.05 was considered to be significant (D, FI, M, O, P: one-way ANOVA with Bonferroni post hoc test; N: two-tailed unpaired Student’s t tests).
Fig. 6
Fig. 6. BET inhibitor suppresses PD-L1 expression and cell growth and promotes cell apoptosis in AML.
A THP1 cells were treated with 0.5 μM JQ1 for 24 h in the absence and presence of 20 ng/ml IFN-γ, PD-L1 expression was determined by FACS (n = 3). B NB4 cells were treated with 0.5 μM JQ1 for 24 h in the absence and presence of 20 ng/ml IFN-γ, PD-L1 expression was determined by FACS (n = 3). C THP1 cells were treated with 0.5 μM JQ1 for 72 h, the proliferation assay was evaluated by CCK-8 assay at the indicated time point (n = 3). D NB4 cells were treated with 0.5 μM JQ1 for 72 h, the proliferation assay was evaluated by CCK-8 assay at the indicated time point (n = 3). E THP1 cells (upper) and NB4 cells (lower) were treated with 0.5 μM JQ1 for 24 h, and apoptosis was determined by FACS (n = 3). F The CD3− cells isolated from the bone marrow of newly diagnosed AML patients using human CD3 microbeads were administrated with 0.5 μM JQ1 and 2 μM ABBV-744 for 48 h, then the proliferation was assayed by CCK-8 experiment at the indicated time points (n = 13 samples). G The apoptosis of CD3− cells isolated from the bone marrow of newly diagnosed AML patients was detected by FACS (n = 12 samples). H PD-L1 expression of CD3− cells isolated from the bone marrow of newly diagnosed AML patients were detected by FACS (n = 13 samples). Data were expressed as mean ± SD. n = 3 or more independent biological replicates, presented as individual points. P value < 0.05 was considered to be significant (A–D, FH: one-way ANOVA with Bonferroni post hoc test; E: two-tailed unpaired Student’s t tests).
Fig. 7
Fig. 7. BET inhibitor suppresses PD-1 and Tim-3 expression, and prolongs survival in murine AML and B-ALL leukemia model.
A Structural diagram of in vivo experiment treated with JQ1 (n = 6 mice per group in this experiment, n = 3 mice per group in the repeated experiment, n (total) = 9 mice). B The percentages of GFP + leukemia cells in peripheral blood were detected by FACS every 2 days after DMSO or JQ1 administration (n = 6 mice per group). C The expression of PD-1 on CD3 + T cells in peripheral blood was detected by FACS every 2 days after DMSO or JQ1 administration (n = 6 mice per group). D The expression of Tim-3 on CD3 + T cells in peripheral blood was detected by FACS every 2 days after DMSO or JQ1 administration (n = 6 mice per group). E The expression of PD-L1 on GFP + T cells in peripheral blood was detected by FACS every 2 days after DMSO or JQ1 administration (n = 6 mice per group). F Kaplan–Meier curve after MLL-AF9 leukemia cells transplantation (n = 6 mice per group, statistical significance calculated using a log-rank test). G Weight change of each mouse in DMSO or JQ1-treated group (n = 6 mice per group). H Structural diagram of in vivo experiment treated with anti-CD3 and JQ1 (n (total) = 5 mice per group). I Kaplan–Meier curve after MLL-AF9 leukemia cells transplantation (n = 5 mice per group). J Treatment schedule and experimental design. B-NDG mice were injected with 1 × l05 Nalm6 cells on day 0, followed by 5 × l06 GFP-T or DMSO-CAR19-T or JQ1-CAR19-T on day 6. Bioluminescence imaging was performed weekly after T-cell administration (n = 5 mice per group in this experiment, n = 6 mice per group in the repeated experiment, n (total) = 11 mice). K The dorsal BLI signal is displayed for individual mice in each treatment group (n = 5 mice per group). L D4-28 bioluminescence imaging of tumor growth (n = 5 mice per group). M Weight change of each mouse in each treatment group (n = 5 mice per group). N Kaplan–Meier survival plot for mice receiving GFP-T or CAR T cells pretreated with DMSO or JQ1 (n = 5 mice per group). O Schematic representation of the mechanism underlying BRD4 inhibition leading to improve T-cell efficacy. Left: BRD4 and NFAT2 involve in the transcription of PDCD1 and HAVCR2. Right: BRD4 inhibitor JQ1 blocks the binding of BRD4 to NFAT2 promoter to prevent the transcription of NFAT2, which inhibits the transcription of PDCD1 and HAVCR2. Besides, JQ1 blocks the binding of BRD4 to the PDCD1 promoter, thus directly inhibiting the expression of PD-1. In short, BRD4 inhibitor inhibits the expression of PD-1 and Tim-3, and increases the secretion of cytokines may partly through NFAT2 signaling pathway. Data are expressed as mean ± SD. n = 3 or more independent biological replicates, presented as individual points. P value < 0.05 was considered to be significant (BD: one-way ANOVA with Bonferroni post hoc test; G, K, M: two-way ANOVA; E: two-tailed unpaired Student’s t tests; F, I, N: log-rank teat).

Similar articles

Cited by

References

    1. Wherry EJ. T cell exhaustion. Nat Immunol. 2011;12:492–9. - PubMed
    1. Wherry EJ, Kurachi M. Molecular and cellular insights into T cell exhaustion. Nat Rev Immunol. 2015;15:486–99. - PMC - PubMed
    1. Turnis ME, Andrews LP, Vignali DAA. Inhibitory receptors as targets for cancer immunotherapy. Eur J Immunol. 2015;45:1892–905. - PMC - PubMed
    1. Tan J, Chen S, Lu Y, Yao D, Xu L, Zhang Y, et al. Higher PD-1 expression concurrent with exhausted CD8+ T cells in patients with de novo acute myeloid leukemia. Chin J Cancer Res = Chung-kuo yen cheng yen chiu. 2017;29:463–70. - PMC - PubMed
    1. Ma J, Zheng B, Goswami S, Meng L, Zhang D, Cao C, et al. PD1(Hi) CD8(+) T cells correlate with exhausted signature and poor clinical outcome in hepatocellular carcinoma. J Immunother Cancer. 2019;7:331. - PMC - PubMed

Publication types

MeSH terms