. 2022 Aug 2;12(1):13290.
doi: 10.1038/s41598-022-15854-8.

Construction of a novel signature and prediction of the immune landscape in gastric cancer based on necroptosis-related genes

Affiliations

Construction of a novel signature and prediction of the immune landscape in gastric cancer based on necroptosis-related genes

Zhengtian Li et al. Sci Rep. .

Abstract

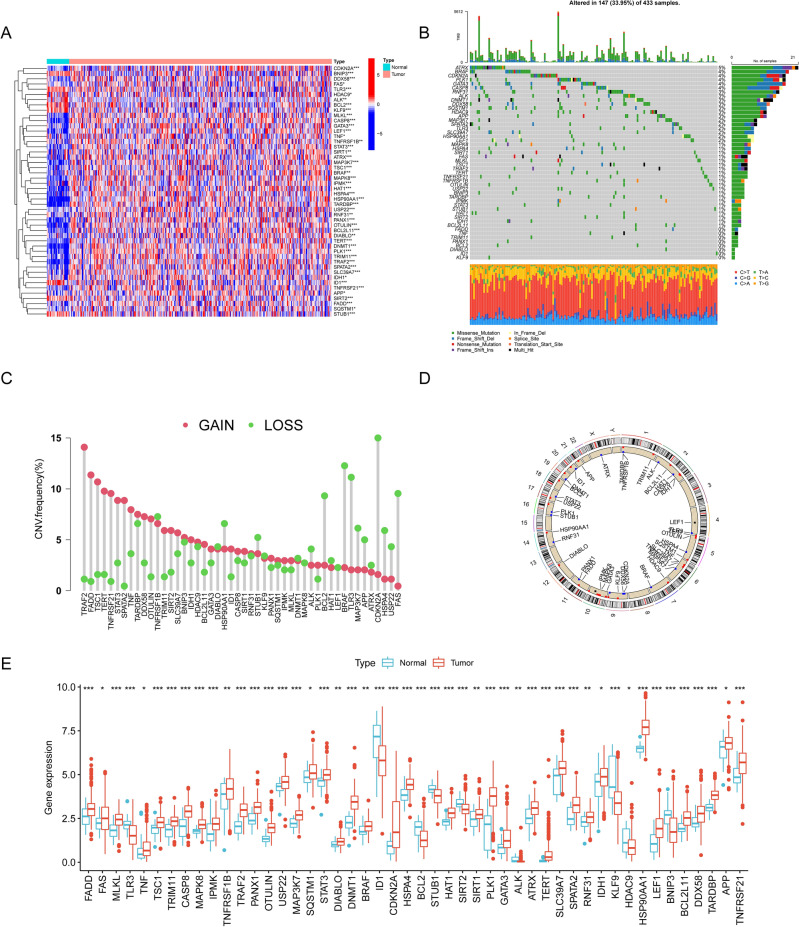
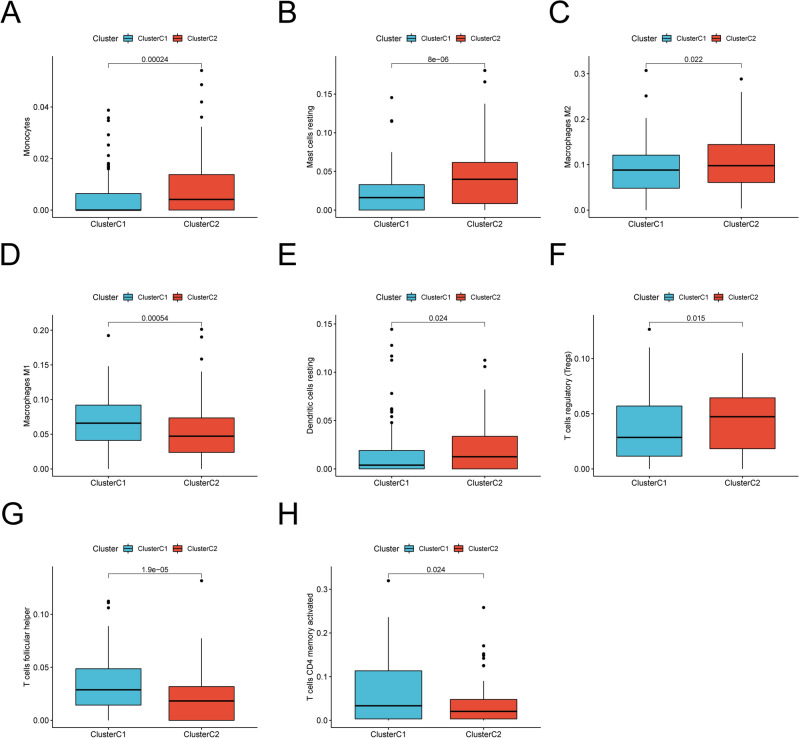
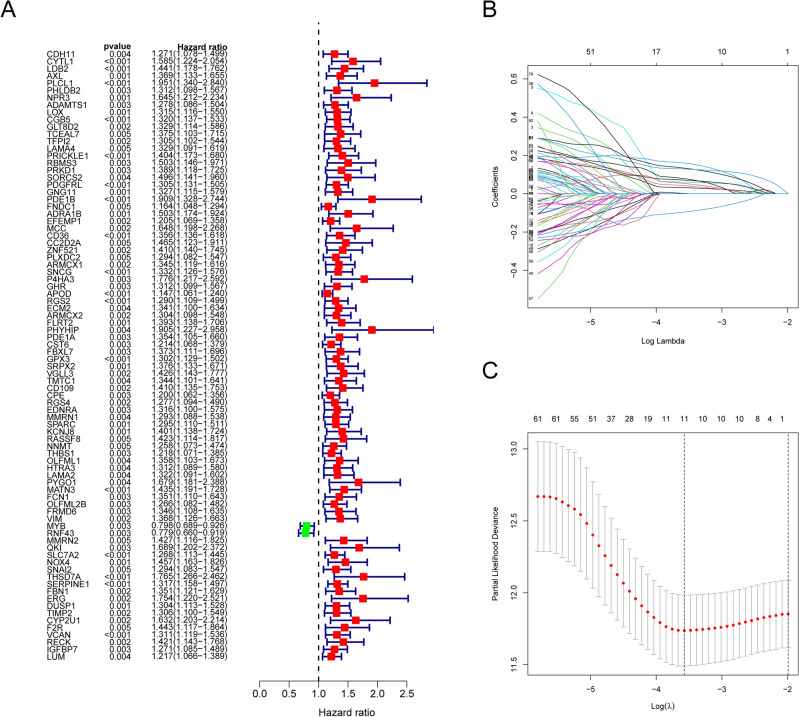
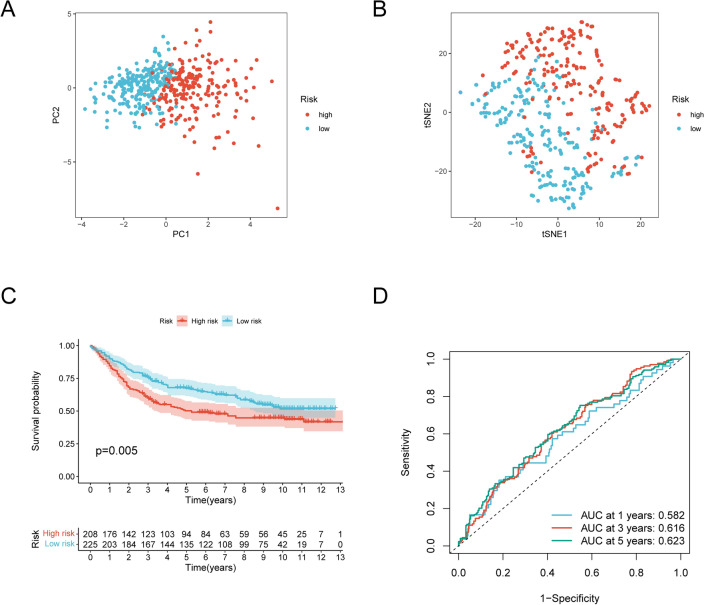
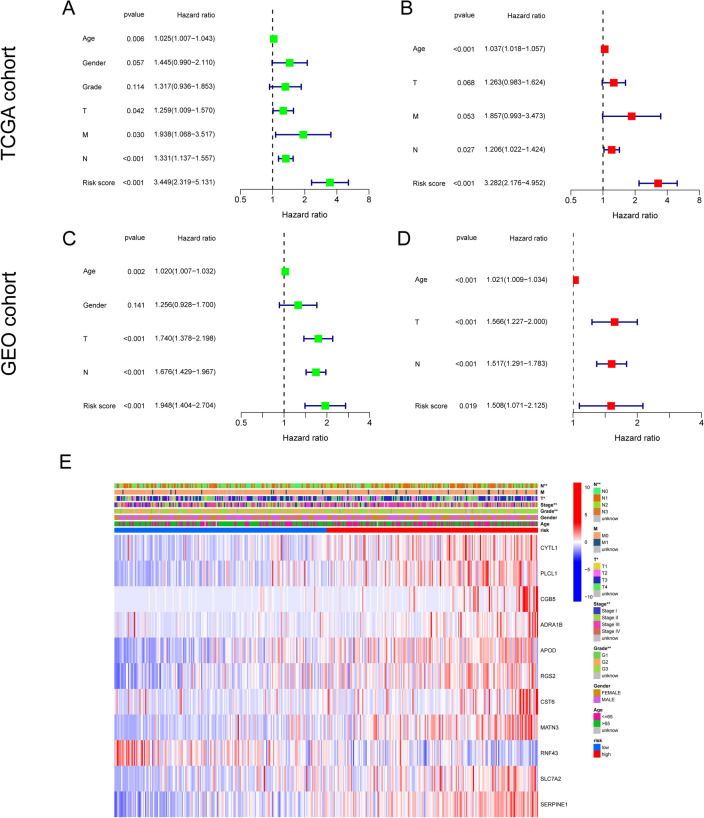
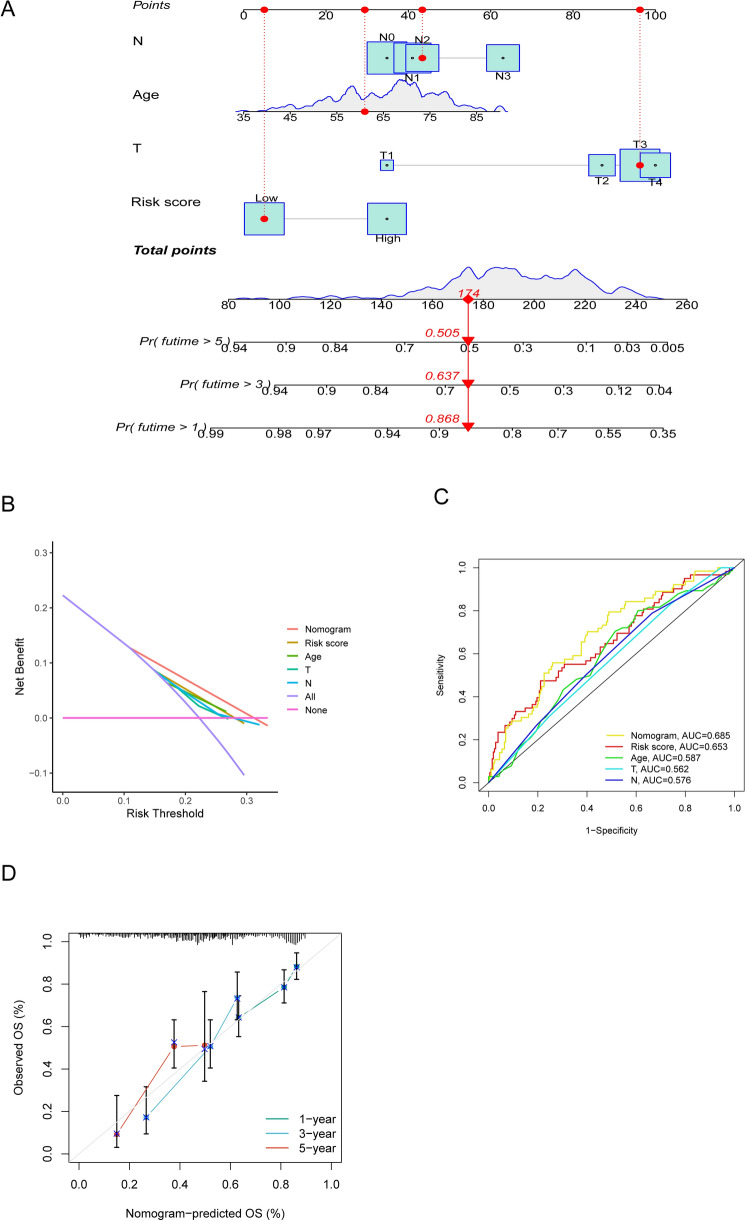
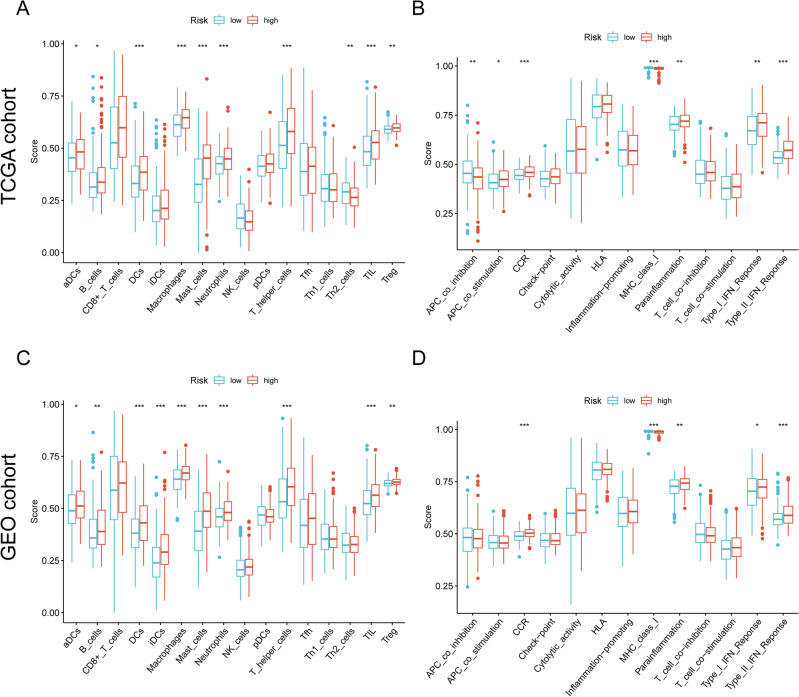
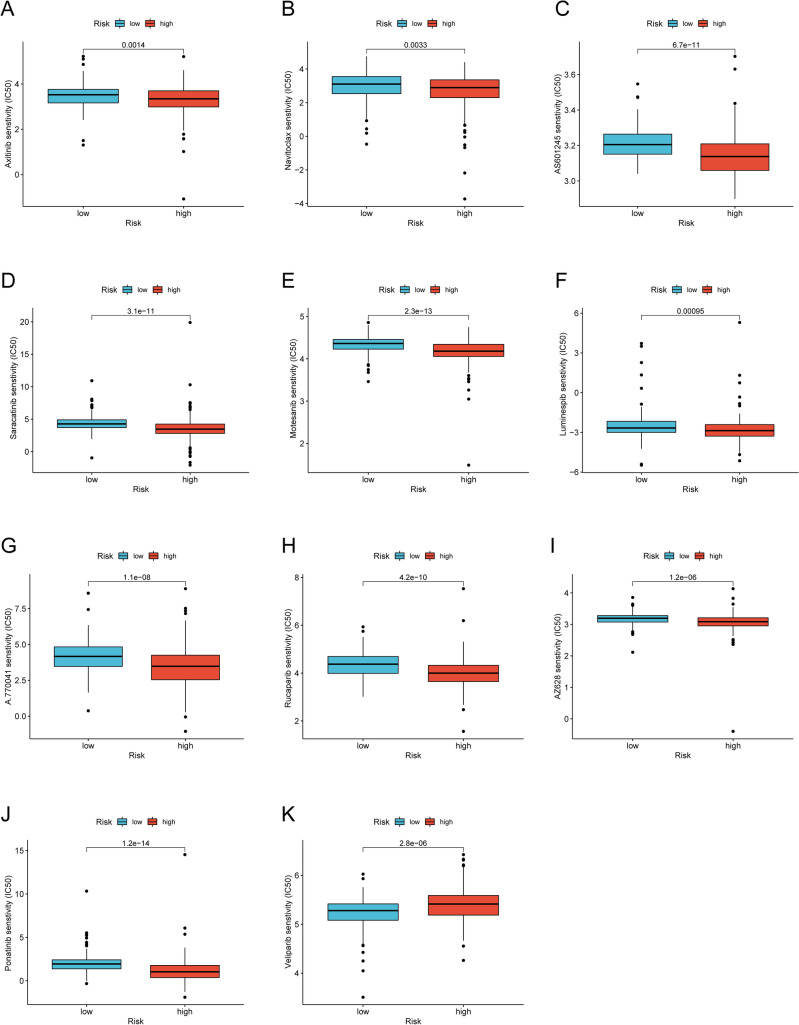
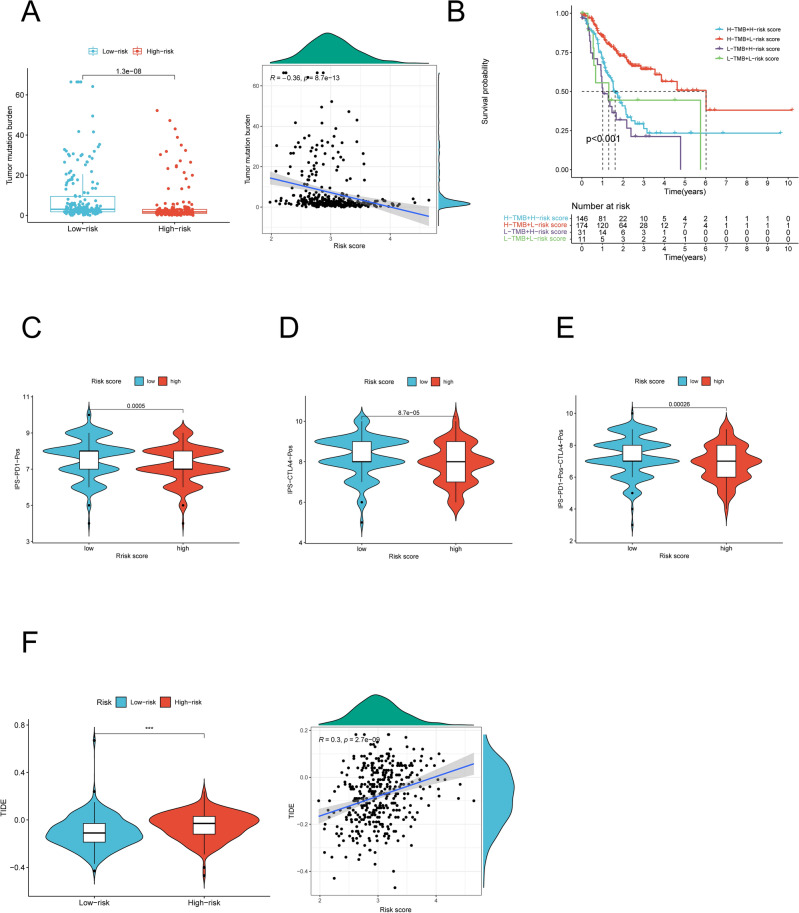
Necroptosis, a type of programmed cell death, has become a potential therapeutic target for solid tumors. Nevertheless, the potential roles of necroptosis-related genes (NRGs) in gastric cancer (GC) remain unknown. The objective of the present study was to create a necroptosis-related prognostic signature that can provide more accurate assessment of prognosis in GC. Using The Cancer Genome Atlas (TCGA) and Gene Expression Omnibus (GEO) data, we identified differentially expressed NRGs. Univariate analysis and Lasso regression were performed to determine the prognostic signature. Risk scores were calculated and all GC patients were divided into high- and low-risk score group according to the median risk score value. The robustness of this signature was externally validated with data from GSE84437 cohort (n = 431). Survival analysis revealed high-risk score patients had a worse prognosis. Results evidenced that the signature was an independent prognosis factor for survival. Single-sample sequence set enrichment analysis (ssGSEA) exhibited different enrichment of immune cells and immune-related pathways in the two risk groups. Furthermore, a predictive nomogram was generated and showed excellent predictive performance based on discrimination and calibration. In addition, the risk score positively correlated with tumor mutational burden and was associated with sensitivity to multiple anti-cancer drugs. Overall, our work demonstrates a close relationship between necroptosis and the prognosis of GC. The signature we constructed with potential clinical application value, can be used for prognosis prediction and being a potential therapeutic responses indicator in GC patients.


Conflict of interest statement

The authors declare no competing interests.

Figures

Figure 1
Figure 1
The landscape of genetic alterations of DENRGs in GC. (A) Heatmap of DENRGs expression between the normal and tumor samples. Blue represents normal gastric tissue, pink represents tumor tissue; upregulated genes were defined as red, and downregulated genes as blue. (B) Mutation characteristics of DENRGs in the TCGA-GC cohort. The TMB is presented in the barplot at the top of the image; the mutation frequency of each DENRGs is indicated on the barplot right. The barplot on the right represents different mutation types proportions. (C) CNV variants frequency of the DENRGs in the TCGA-GC cohort. Red: amplification frequency. Green: loss frequency. The column represented the alteration frequency. (D) The locations of CNV alteration of DENRGs on 23 chromosomes. (E) Expression of DENRGs between normal gastric tissue and tumor tissue. Blue: normal gastric tissue. Red: tumor tissue. DENRGs, differentially expressed necroptosis-related genes. (*p < 0.05; **p < 0.01; ***p < 0.001).
Figure 2
Figure 2
Tumor molecular subtypes related by differentially expressed necroptosis-related genes. (A) Consensus clustering of GC patients for k = 2 in the meta-cohort (TCGA-GC and GSE84437). (B) Unsupervised clustering heatmap of top 100 DEGs in GC. Clusters, age, gender, grade and stage were used as patient annotations. Red represents high DEGs expression and blue low DEGs expression. *p < 0.05; **p < 0.01; ***p < 0.001. (C) Kaplan–Meier curves (Log-rank test, P = 0.004) for OS of two necroptosis-related molecular subtypes. Blue line represents cluster C1 (n = 208), yellow line represents cluster C2 (n = 163). DEGs, differentially expressed genes between various molecular subtypes; OS, overall survival.
Figure 3
Figure 3
TME immune cell infiltration levels between two molecular subtypes. The abundance of Monocytes (A), resting Mast cells (B), M2 macrophages (C), M1 macrophages (D), resting Dendritic cells (E), T cells regulatory (Tregs) (F), T cells follicular helper (G) and activated T cells CD4 memory (H) between the two subtypes (all p < 0.05). Blue represents cluster C1, red represents cluster C2. The median value is represented as the thick line, and the interquartile range is represented as the box bottom and top. Scattered dots represent outliers.
Figure 4
Figure 4
Functional enrichment analysis of the DEGs. (A) Top 10 enriched GO terms of the DEGs (B) Top 10 enriched KEGG pathways of the DEGs. The box color represents the number of enriched genes. Red represents a large number of genes enriched; blue is the opposite. DEGs differentially expressed genes, BP biological process, CC cellular component, MF molecular function. (all adjusted p < 0.05).
Figure 5
Figure 5
The development of NRGsig in the TCGA-GC cohort. (A) The prognostic-related genes determined by univariate Cox-regression analysis. Red represents risk genes; green represents protective genes. (B) LASSO regression of prognostic-related genes. (C) Cross‐validation for tuning the parameter selection.
Figure 6
Figure 6
Prognosis value of necroptosis-related prognostic signature in the TCGA-GC cohort. (A) Principal component analysis plot. (B) T-distributed neighbor embedding plot. (C) Kaplan–Meier curves (Log-rank test, P < 0.001) for OS of high- and low-risk groups. (D) The AUC of the prediction of 1, 3, 5‐year survival rate of GC. OS, overall survival.
Figure 7
Figure 7
Validation of the necroptosis-related prognostic signature in the GSE84437 cohort. (A) Principal component analysis plot. (B) T-distributed neighbor embedding plot. (C) Kaplan–Meier curves (Log-rank test, P = 0.005) for OS of high- and low-risk groups. (D) The AUC of the prediction of 1, 3, 5‐year survival rate of GC. OS, overall survival.
Figure 8
Figure 8
Independent prognosis analysis. (A, B) Univariate Cox regression analysis in the TCGA-GC cohort. (C, D) Multivariate Cox regression analysis in the GSE84437 cohort. (E) Heatmap depicting the clinicopathological characteristics and optimal genes expression between the high- and low-risk groups. Risk, age, gender, grade and stage were used as patient annotations. Red represents high expression and blue low expression. *p < 0.05; **p < 0.01; ***p < 0.001.
Figure 9
Figure 9
The construction and assessment of nomogram. (A) Nomogram integrating clinical factors and risk score for predicting 1-, 3-, and 5-year OS in TCGA-GC cohort (B) Decision curves of risk score, nomogram, and single clinical factors including T stage, N stage and age. (C) The time-dependent ROC curves of risk score, nomogram and single clinical factors including T stage, N stage and age. (D) The calibration curves for 1-, 3-, and 5-year OS. OS, overall survival.
Figure 10
Figure 10
ssGSEA scores in the high- and low-risk group in the TCGA-GC and GSE84437 cohort. (A, B) TCGA cohort, (C, D) GSE84437 cohort. The scores of 16 immune cells (A, C) and 13 immune-related functions (B, D) are displayed in boxplots.
Figure 11
Figure 11
Drugs sensitivity analysis in patients from different risk score groups. The sensitivity to chemotherapeutic drugs was represented by the half-maximal inhibitory concentration (IC50) of chemotherapeutic drugs. (AK) Comparisons of IC50 for chemotherapeutics drugs between two subgroups revealed that the high-risk group was more likely to benefit from the treatments (Kruskal–Wallis test, all p < 0.01).
Figure 12
Figure 12
Correlation of risk score with TMB and predictive value of risk score for immunotherapy response. (A) TMB differences between the high- and low-risk score groups and the scatter plot depicted a positive correlation between risk score and TMB. (B) Kaplan–Meier curves for patients stratified by risk score and TMB in the TCGA-GC cohort. (CE) Immunophenscore (IPS) between high- and low-risk score groups. Blue represents the low-score group and red the high-score group. The thick line within the violin plot represents the median value. The inner box between the top and bottom represents the interquartile range. (C) IPS score when PD-1 positive; (D) IPS score when CTLA4 positive; (E) IPS score when both PD-1 and CTLA4 positives. TMB, tumor mutation burden; IPS, Immunophenscore. (F) TIDE score differences between the high- and low-risk score groups and the scatter plot depicted a positive correlation between risk score and TIDE and lower risk score may be more likely to benefit from the immunotherapy (Spearman text, p < 0.001).

Similar articles

Cited by

References

    1. Siegel RL, Miller KD, Fuchs HE, Jemal A. Cancer statistics. CA Cancer J. Clin. 2022;72:7–33. doi: 10.3322/caac.21708. - DOI - PubMed
    1. Yu J, et al. ZiYinHuaTan recipe inhibits cell proliferation and promotes apoptosis in gastric cancer by suppressing PI3K/AKT pathway. Biomed. Res. Int. 2020 doi: 10.1155/2020/2018162. - DOI - PMC - PubMed
    1. Hironaka S. Anti-angiogenic therapies for gastric cancer. Asia Pac. J. Clin. Oncol. 2019;15:208–217. doi: 10.1111/ajco.13174. - DOI - PubMed
    1. Ajani JA, et al. Gastric cancer, version 3.2016, NCCN clinical practice guidelines in oncology. J. Natl. Compr. Cancer Netw.: JNCCN. 2016;14:1286–1312. doi: 10.6004/jnccn.2016.0137. - DOI - PubMed
    1. Degterev A, et al. Chemical inhibitor of nonapoptotic cell death with therapeutic potential for ischemic brain injury. Nat. Chem. Biol. 2005;1:112–119. doi: 10.1038/nchembio711. - DOI - PubMed

Publication types

Substances