. 2022 Aug 2;12(1):13245.
doi: 10.1038/s41598-022-15629-1.

An analysis of the significance of the Tre2/Bub2/CDC 16 (TBC) domain protein family 8 in colorectal cancer

Affiliations

An analysis of the significance of the Tre2/Bub2/CDC 16 (TBC) domain protein family 8 in colorectal cancer

Yuan-Jie Liu et al. Sci Rep. .

Abstract

The TBC (Tre-2/Bub2/Cdc16, TBC) structural domain is now considered as one of the factors potentially regulating tumor progression. However, to date, studies on the relationship between TBC structural domains and tumors are limited. In this study, we identified the role of TBC1 domain family member 8 (TBC1D8) as an oncogene in colorectal cancer (CRC) by least absolute shrinkage and selection operator (LASSO) and Cox regression analysis, showing that TBC1D8 may independently predict CRC outcome. Functional enrichment and single-cell analysis showed that TBC1D8 levels were associated with hypoxia. TBC1D8 levels were also positively correlated with M2 macrophage infiltration, which may have a complex association with hypoxia. Taken together, these results show that the TBC1D8 gene is involved in colorectal carcinogenesis, and the underlying molecular mechanisms may include hypoxia and immune cell infiltration.


Conflict of interest statement

The authors declare no competing interests.

Figures

Figure 1
Figure 1
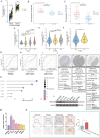
TBC1D8 expression as an indicator of overall survival and progression-free interval determined by Least absolute shrinkage and selection operator (LASSO) and Cox regression analysis in the The Cancer Genome Atlas (TCGA) cohort. (A) In the LASSO-Cox model based on TCGA-Colon Adenocarcinoma (COAD), the minimum standard was adopted to obtain the value of the super parameter λ by tenfold cross-validation, where the optimal lambda resulted in 2 non-zero coefficients (n = 480). (B) Cross-validation for selecting tuning parameters. (CF) Univariate (C,E) and multivariate (D,F) Cox regression analysis for overall survival (C,D) and progression free interval (E,F) of the relationship between TBC1D8 and TBC1D17 levels and clinicopathological parameters related to CRC prognosis in TCGA-COAD (n = 480). (G,H) Overall survival (OS) (G), Disease-specific survival (DSS) (H), and Progression-free interval (PFI) (I) based on median TBC1D8 levels in TCGA-COAD (n = 480).
Figure 2
Figure 2
TBC1D8 levels in colorectal cancer (CRC) and their association with clinicopathological parameters. (A) Expression level of TBC1D8 between CRC tissues and paired paracancerous tissue in the TCGA-COAD. Wilcoxon test was performed (n = 41). (B,C) The differences in TBC1D8 gene expression between CRC cases and normal controls in GSE10950 (n = 48) (B) and GSE37182 (n = 172) (C). Wilcoxon test was performed. (DF) Association of TBC1D8 mRNA levels with (D), T stage (n = 477) (E), N stage (n = 478) (F), and M (n = 411) stage in CRC patients based on TCGA-COAD. (GI) Diagnostic Operating Characteristic (ROC) curves based on TBC1D8 and Carcino embryonic antigen (CEA) levels [H, TCGA (n = 521); I, GSE10950 (n = 48); J, GSE37182 (n = 172)]. (J) Immunohistochemical (IHC) analysis of TBC1D8 in CRC tissues based on Human Protein Atlas (HPA) (Magnification, × 2, scale bars = 500 μm). (KM) TBC1D8 expression in different CRC cell lines based on (K) the Cancer Cell Line Encyclopedia (CCLE) and (L,M) western blot. One-way ANOVA was conducted. Data in the bar chart are the means ± SME from three independent experiments. *P < 0.05. (N) Quantifications of TBC1D8 IHC staining based on our own samples (n = 30) show the differential expression between paracancerous and colonrectal carcinoma tissue. The t-test was performed (Magnification × 200, scale bars = 50 μm; Magnification ×  × 400, scale bars = 20 μm). (NS: non-significant, *P < 0.05, **P < 0.01, ***P < 0.001, ****P < 0.0001).
Figure 3
Figure 3
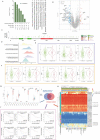
Protein–protein interaction (PPI) network and enrichment analysis. (A) TBC1D8 with neighboring genes showing physical interactions, co-expression, co-localization, predicted common pathways, genetic interactions, and common protein domains based on GENEMANIA database. Each node represents a gene. The node size represents the strength of interactions, and the line color represents the types of interactions. (B) Volcano plot of Differentially expressed genes (DEGs) induced by alterations in TBC1D8 levels. Yellow dots, upregulation; blue dots, downregulation; abscissa, expression differences (log2 fold change); ordinate, significance of differences (− log10 padj). (C) Cytoscape was conducted to visualized the network of TBC1D8 and significantly correlated genes. Darker color and larger size indicate higher degree. (D) The hub module with the highest scores analyzed by Molecular Complex Detection (MCODE). Darker color and larger size indicate higher degree. (E) The “clusterProfiler” R package was used for the Gene ontology (GO) _biological_process (BP) enrichment analysis based on the module. (F,G) Gene Set Enrichment Analysis (GSEA) for TBC1D8. (F) The enriched gene sets in KEGG and Reactome collection by the high TBC1D8 expression sample. (G) The enriched gene sets in GO collection by the high TBC1D8 expression sample. Only gene sets with Normal P < 0.05 and false discovery rate (FDR) < 0.1 were considered significant and displayed in the plot (The x axis represents the distribution of log-fold change (logFC) corresponding to the core molecules in each gene set).
Figure 4
Figure 4
The differentially enriched genesets correlated with TBC1D8 expression were studied through the gene set variation analysis (GSVA) algorithm based on TCGA and Gene Expression Omnibus (GEO) datasets. (A,B) Heatmap displaying the hierarchical clustering of enrichment scores obtained through Gene set variation analysis (GSVA) based on the enrichment degree profile of the datasets. (A) TCGA; (B) GSE37182. (C,D) Volcano plot of the differentially enriched genesets in CRC patients with different expression of TBC1D8 in (TCGA) and (GSE37182) dataset was analyzed by GSVA by “limma” R package (C TCGA, n = 480, D GSE37182, n = 84). Blue nodes indicate downregulation, red indicates upregulation. (E,F) Relationship between TBC1D8 and hypoxia-related genes based on TCGA (n = 480) (E) and GSE37182 (n = 84) (F). Yellow indicates a positive and blue indicates a negative relationship; darker color shows stronger correlation. (*P < 0.05, **P < 0.01).
Figure 5
Figure 5
Single-cell analysis for TBC1D8 based on Tumor Immune Single-cell Hub (TISCH) database. (A) Functional relevance of TBC1D8 in patients with CRC. (BK) (B,G) Cellular components based on (B) GSE139555 and (G) GSE146771. (C,H) Uniform manifold approximation and projection (UMAP) plots illustrating the expression of TBC1D8 clusters based on (C) GSE139555 and (H) GSE146771. (D,I) Enrichment scores of genes from the Hallmark hypoxia geneset in individual cells, from gene set variation analysis based on (D) GSE139555 and (I) GSE146771. (E,J) UMAP plots showing the CRC cell landscape. Different cell types after quality control, dimensionality reduction, and clustering based on (E) GSE139555 and (H) GSE146771. (F,K) Violin plots for CRC cell cluster marker genes and TBC1D8 in different cell types based on (F) GSE139555 and (K) GSE146771.
Figure 6
Figure 6
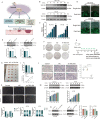
TBC1D8 can be induced by hypoxia conditions, thereby contributing to tumor proliferation and tumor stemness. (A) Schematic model of the possible role of TBC1D8 in CRC. (B,C) Effects of CoCl2-induced hypoxia on TBCD18 expression. (D,E) Transfection efficiencies (%) shown by Green fluorescent protein (GFP) expression and western blotting (Magnification, × 400, scale bars = 20 μm). (F) Clone formation capability of CRC cells transfected with NC and sh- TBC1D8 constructs, shown by colony formation determination (Magnification, × 1, scale bars = 1000 μm). (G) Schematic diagram of subcutaneous tumor models. (H) Xenograft mouse tumors (n = 6 mice per group). (I) Volumes of xenograft tumors measured twice a week and weights of xenograft tumors at completion of the study. (J) IHC staining of Ki-67 proteins in mouse xenograft tumor tissues (Magnification, × 100, scale bars = 100 μm; Magnification × 200, scale bars = 20 μm). All the IHC scores were repeated three times using a double-blind method.Statistical analysis All experiments were repeated at least three times, independently. (K) Sphere-forming assay of cells (magnification, × 100, scale bars = 100 μm). (L) The number of cell spheres and the sphere size were measured. All experiments were repeated at least three times, independently. (M) The relative expression level of SOX2 under hypoxic condition was detected using Western blot analysis (n = 3 replicates). (N) The relative expression level of SOX2 levels in CRC cells transfected with NC and sh-TBCID8, were examined using western blot analysis (n = 3 replicates). Data are means ± SEM *p < 0.05; **p < 0.01; ***p < 0.001. One-way ANOVA was conducted. All experiments were repeated at least three times, independently.
Figure 7
Figure 7
Immune analysis of TBC1D8. (A) Effects of high and low TBC1D8 expression on immune cells. (B) Relationship between TBC1D8 level and degree of immune infiltration, from TIMER. (C,D) Relationship between TBC1D8 and levels of (C) M2 macrophage markers and (D) M1 macrophage markers. (E) Tumor-initiating cell proportions in CRC samples. from GSE10950 and GSE37182 data based on CIBERSORT. (F) Relationship between TBC1D8 level and macrophage abundance based on CIBERSORT, from GSE10950 and GSE37182 data. (G) Diagram of co-culture system. (H) Double-immunofluorescence staining of M2 macrophage markers CD206 (red) and CD163 (green); nuclei are stained with DAPI (blue) (Magnification, × 400, scale bars = 20 μm) (n = 3 replicates). (I) Intensity of immunofluorescence (mean ± SEM) (n = 3 replicates). Data are means ± SEM *p < 0.05; **p < 0.01; ***p < 0.001.
Figure 8
Figure 8
The genetic alteration of TBC1D8 in CRC. (A) Frequencies of TBC1D8 mutations and copy number alterations (CNA) in the 8 datasets shown on the right side. (B) Volcano map of genes showing differential expression after a change in TBC1D8 (mutated and wild). Red dots, upregulated genes; blue dots, downregulated genes; abscissa, differences in gene expression (log2 fold change); and ordinate, significance of these differences (− log10 padj). (C) The mutation site profile of the TBC1D8 gene is shown. (D) GSEA was used to determine the functions of differential gene sets between the mutated and wild groups based on GO. Only gene sets with Normal P < 0.05 and FDR < 0.1 were considered significant and displayed in the plot. The x axis represents the distribution of log-fold change (logFC) corresponding to the core molecules in each gene set. (EF) Differential Analysis of TBC1D8 (mutated and wild) with M1 (E) and M2 (F) macrophage markers. Wilcoxon-Mann–Whitney test was performed based on TIMER database. (G) The Differential Analysis of the TBC1D8 probe methylation were indicated. (H) Waterfall plot of the methylation levels in the TBC1D8 gene. The correlations between TBC1D8 methylation or expression levels were also analyzed. (I) Venn diagram showing the intersection of (G,H). (J) Survival analysis based on the intersection methylation probes; P < 0.05 was considered statistically significant.

Similar articles

Cited by

References

    1. Siegel RL, et al. Cancer statistics, 2021. CA Cancer J. Clin. 2021;71(1):7–33. doi: 10.3322/caac.21654. - DOI - PubMed
    1. Dekker E, et al. Colorectal cancer. Lancet. 2019;394(10207):1467–1480. doi: 10.1016/S0140-6736(19)32319-0. - DOI - PubMed
    1. Thanikachalam K, Khan G. Colorectal cancer and nutrition. Nutrients. 2019;11:1. doi: 10.3390/nu11010164. - DOI - PMC - PubMed
    1. Picard E, et al. Relationships between immune landscapes, genetic subtypes and responses to immunotherapy in colorectal cancer. Front. Immunol. 2020;11:369. doi: 10.3389/fimmu.2020.00369. - DOI - PMC - PubMed
    1. van der Stok EP, et al. Surveillance after curative treatment for colorectal cancer. Nat. Rev. Clin. Oncol. 2017;14(5):297–315. doi: 10.1038/nrclinonc.2016.199. - DOI - PubMed

Publication types

MeSH terms

Substances