. 2022 Aug;7(8):1239-1251.
doi: 10.1038/s41564-022-01183-z. Epub 2022 Aug 2.

Uncontrolled transposition following RNAi loss causes hypermutation and antifungal drug resistance in clinical isolates of Cryptococcus neoformans

Affiliations

Uncontrolled transposition following RNAi loss causes hypermutation and antifungal drug resistance in clinical isolates of Cryptococcus neoformans

Shelby J Priest et al. Nat Microbiol. 2022 Aug.

Abstract

Cryptococcus neoformans infections cause approximately 15% of AIDS-related deaths owing to a combination of limited antifungal therapies and drug resistance. A collection of clinical and environmental C. neoformans isolates were assayed for increased mutation rates via fluctuation analysis, and we identified two hypermutator C. neoformans clinical isolates with increased mutation rates when exposed to the combination of rapamycin and FK506. Sequencing of drug target genes found that Cnl1 transposon insertions conferred the majority of resistance to rapamycin and FK506 and could also independently cause resistance to 5-fluoroorotic acid and the clinically relevant antifungal 5-flucytosine. Whole-genome sequencing revealed both hypermutator genomes harbour a nonsense mutation in the RNA-interference component ZNF3 and hundreds of Cnl1 elements organized into massive subtelomeric arrays on each of the fourteen chromosomes. Quantitative trait locus mapping in 28 progeny derived from a cross between a hypermutator and wild-type identified a locus associated with hypermutation that included znf3. CRISPR editing of the znf3 nonsense mutation abolished hypermutation and restored small-interfering-RNA production. We conclude that hypermutation and drug resistance in these clinical isolates result from RNA-interference loss and accumulation of Cnl1 elements.


Conflict of interest statement

Competing interests.

The authors declare no competing financial or non-financial interests.

Figures

Extended Data Fig. 1
Extended Data Fig. 1. Bt65 and Bt81 do not display a hypermutator phenotype on 5-FC or 5-FOA.
Mutation rates of closely related VNBII strains and controls on (A) YNB + 5-FC and (B) YNB + 5-FOA media. Heights of bars represent the mutation rate and error bars represent 95% confidence intervals; mutation rates represent the number of mutations per cell per generation. Fluctuation analysis was conducted once for all strains in each experiement, with n = 10 biologically independent cultures per strain. Schematic depicts the phylogenetic relationships of all strains included in fluctuation analyses based on Desjardins et al. 2017.
Extended Data Fig. 2
Extended Data Fig. 2. Growth at elevated temperature does not result in increased mutation rates in C. neoformans strains.
Fluctuation assays were used to quantify the mutation rates of strains grown overnight at 30°C or 37°C and plated on YPD + rapamycin + FK506 medium. Heights of bars indicate mean mutation rate and error bars indicate 95% confidence intervals. Mutation rates represent the number of mutations per cell per generation. Fluctuation analysis was conducted once for all strains, with n = 10 biologically independent cultures per strain.
Extended Data Fig. 3
Extended Data Fig. 3. Gel electrophoresis of FRR1, URA5, and FUR1 PCR products from resistant colonies.
Gel electrophoresis of FRR1 PCR products from (A) all H99 rapamycin + FK506-resistant colonies and a subset of (B) Bt65 and Bt81 rapamycin + FK506-resistant colonies sequenced in Figure 1D. PCR amplification of wild-type FRR1 in C. neoformans produces a 1,165 bp electrophoretic species (primers ZC7/8). Gel electrophoresis of a subset of (C) URA5 PCR products from H99, Bt65, and Bt81 5-FOA-resistant colonies and (D) FUR1 and (E) UXS1 PCR products from 5-FC-resistanct colonies of Bt65 and Bt81.
Extended Data Fig. 4
Extended Data Fig. 4. Protein length differences of genes within QTL
In the upper panels, points mark the strength of association (y-axis) between bi-allelic SNP sites and hypermutation for Chromosome 3 and Chromosome 11 (top left and right, respectively). Grey dashed lines depict the 95% confidence intervals (CI) of the two QTL. For the bi-allelic SNPs within the two QTL 95% CIs, p-value = 1.46868 × 10⁻⁵ (Kruskal-Wallis H-test). Lower panels show the predicted differences in lengths of proteins (y-axis) encoded by annotated genes in Bt65 compared to H99 within each 95% CI of the QTL (x-axis) on Chromosome 3 and Chromosome 11 (bottom left and right, respectively). The name of each gene with a predicted nonsense mutation is annotated. Blue and red colors denote the gene orientation.
Extended Data Fig. 5
Extended Data Fig. 5. QTL associated with the hypermutator phenotype span a chromosomal translocation.
(A) Nanopore whole-genome sequencing followed by synteny analysis was used to identify all indicated genomic rearrangements with respect to the reference strain H99. There is a chromosomal translocation between Chr3 and Chr11 unique to H99, and a translocation between H99 Chr1 and Chr13 unique to Bt65 and Bt81. Phylogenetic relationships of these strains are depicted in the top schematic, telomeric repeat sequences accurately identified in genomic assemblies are indicated by black half circles, and centromeres are indicated by white circles. (B) Haplotype maps of Bt65 x H99 F1 progeny utilized for QTL mapping. For QTLs on Chr3 and Chr11 the haplotypes (x-axis) are inferred by SNP data per segregant (y-axis) and colored blue or orange if inherited from H99 crg1Δ or Bt65, respectively. Segregants are sorted along the y-axis by their mutation rate; largest to smallest, top to bottom. Vertical red lines display boundaries of the QTL(s). Vertical black lines depict approximate location of the translocation between H99 and Bt65. Boundaries of the QTG, ZNF3, are depicted by vertical green lines. Vertical white spaces indicate approximate locations of centromeres.
Extended Data Fig. 6
Extended Data Fig. 6. Mutation rates of Bt81 x H99 F1 progeny.
Fluctuation analysis was used to quantify the mutation rates of the indicated strains on YPD + rapamycin + FK506 medium (y-axis) – sorted smallest to largest, left to right – for F1 progeny and the parental strains, H99α crg1Δ and Bt81 (x-axis). Heights of bars indicate the mean mutation rate and error bars represent 95% confidence intervals. Mutation rates represent the number of mutations per cell per generation. Inheritance of the Bt81 znf3 allele or H99 crg1Δ ZNF3 allele in the F1 progeny is indicated above mutation rates. Fluctuation analysis was conducted once for all strains, with n = 10 biologically independent cultures per strain.
Extended Data Fig. 7
Extended Data Fig. 7. Subtelomeric and centromeric retrotransposons in Bt89 and Bt133.
Distributions of the Tcn1-Tcn6 LTR-retrotransposons and the Cnl1 non-LTR retrotransposon in the genomes of (A) Bt89 and (B) Bt133. 50 kb of subtelomeric regions as well as centromeric regions are displayed for both strains. Shading corresponds to the lengths of the Cnl1 elements, and gene arrowheads indicate the direction of transcription for all retrotransposons.
Extended Data Fig. 8
Extended Data Fig. 8. Centromere lengths do not significantly differ among H99, Bt65, Bt81, Bt89, and Bt133.
The length of each centromere (y-axis) is plotted for each strain (x-axis). The thin horizontal black line indicates average centromere length and the thicker black error bars indicate the standard error of the mean. No significant difference was found between the average centromere length of each strain (one-way ANOVA, p-value = 0.153).
Extended Data Fig. 9
Extended Data Fig. 9. Distribution of Cnl1 among Bt65 x H99 F1 progeny and parental strains.
The Cnl1 non-LTR elements identified in the nanopore-based whole-genome assemblies are depicted for H99, Bt65, three hypermutator F1 progeny (P02, P08, and P34, all on the left), and three non-hypermutator F1 progeny (P14, P18, and P20, all on the right). Blue and orange bars under the subtelomeric region of each chromosome indicate which parental strain the region was inherited from (orange for Bt65, blue for H99). Red asterisks indicate invasion of Cnl1 into an H99 subtelomeric region that previously had zero Cnl1 copies/fragments. Accurate assembly of telomeric repeat sequences at the end of each chromosome is indicated by a black half circle. Cnl1 length is also indicated by the shade of black for each element.
Extended Data Fig. 10
Extended Data Fig. 10. Enrichment for dsRNA does not identify any fragments likely to be dsRNA mycoviruses.
Pictured on the left are RNA samples following LiCl enrichment for dsRNA run on a 1% agarose gel. Total RNA prior to dsRNA enrichment is pictured on the right on a 1% agarose gel. Ms+ is a Malassezia sympodialis strain that harbors a dsRNA virus, and Ms- is a congenic virus-cleared strain. Two biological replicates for all samples are shown and labeled (1) and (2). The TriDye 1 kb DNA ladder (NEB) was used to estimate RNA fragment sizes.
Figure 1.
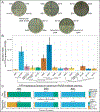
Figure 1.. Hypermutation in Bt65 and Bt81 is driven primarily by the insertion of Cnl1 into FRR1.
(A) Generation of spontaneously resistant colonies on YPD + rapamycin + FK506 medium was utilized to identify hypermutator candidates; representative pictures are shown from n = 10 biologically independent cultures per strain (each culture swabbed to one single quadrant). Strains include the phylogenetically closely related strains involved in fluctuation assay in B as well as positive (msh2Δ) and negative (H99) controls. (B) Mutation rates of closely related VNBII strains and controls on YPD + rapamycin + FK506. Heights of bars represent the mutation rate and error bars represent 95% confidence intervals; mutation rates represent the number of mutations per cell per generation. Fluctuation analysis was repeated twice for all strains, with n = 10 biologically independent cultures per strain in each experiment, thus n = 20 is shown for all strains except PMHc1051.ENR.STOR and NRHc5014.ENR, for which only one experiment was conducted and n = 10. Schematic depicts the phylogenetic relationships of all strains included in fluctuation analyses based on Desjardins et al. 2017. Mutational spectra in FRR1 in YPD + rapamycin + FK506-resistant colonies of H99, Bt65, and Bt81 as characterized by (C) gel electrophoresis and Sanger sequencing of FRR1 PCR products. MicroINDELs are defined as insertions or deletions < 50 bp. All mutations are relative to the appropriate rapamycin + FK506-sensitive parental strain.
Figure 2.
Figure 2.. QTL analysis of hypermutator phenotype.
(A) Quantification of mutation rates on YPD + rapamycin + FK506 medium – sorted smallest to largest, left to right – for F1 progeny and parental strains, H99 crg1Δ and Bt65. Inheritance of the Bt65 znf3 allele or H99 crg1Δ ZNF3 allele in F1 progeny is indicated above mutation rates. Heights of colored bar plots indicate mutation rate and vertical black lines depict associated 95% confidence intervals (CI) per segregant. Mutation rates represent the number of mutations per cell per generation. Fluctuation analysis was conducted once for all strains, with n = 10 biologically independent cultures per strain. (B) Manhattan plot showing the strength in association (y-axis) between bi-allelic SNPs and hypermutator phenotype, across the 14 chromosomes (x-axis). Colors separate SNPs across chromosomes. The permutation-based significance threshold (α = 0.01) is depicted with a horizontal dashed line. (C) Predicted ZNF3 gene and Znf3 protein models in H99 and Bt65. A grey horizontal bar depicts the gene body in the upper panel, and larger grey rectangles represent exons; the gene is depicted 5’ to 3’ and is 5417 nt in length. The locations of SNPs differing between Bt65 and H99 are shown by vertical black rungs along the gene model. Amino acids specified by mRNA codons in the indicated region of ZNF3 Exon 1 (nucleotides 364 to 411) are shown for H99 and Bt65 to illustrate the effect of the C to T mutation (nucleotide 409) predicted to cause a nonsense mutation in Bt65. The bottom panel depicts the predicted impact of the nonsense mutation on the Znf3 protein in Bt65. White rectangles along the protein schematic depict the three C2H2-type zinc finger domains of Znf3.
Figure 3.
Figure 3.. Retrotransposon content in the genomes of H99, Bt65, and Bt81.
Distributions of the Tcn1 through Tcn6 LTR-retrotransposons and the Cnl1 non-LTR retrotransposon in subtelomeric and centromeric regions of (A) Bt65, (B) Bt81, and (C) H99 genomes depicted in Figure S6. In Bt65 and Bt81, 80 kb of subtelomeric regions are displayed, and 50 kb subtelomeric regions are displayed for H99 to show the full distribution of subtelomeric Cnl1 elements. Subtelomeric arrays of Cnl1 are depicted at the end of each chromosome in Bt65 and Bt81, while only 7 Cnl1 elements are localized subtelomerically in H99. Shading corresponds to fragments of the Cnl1 elements, and gene arrowheads indicate the direction of transcription for all retrotransposons.
Figure 4.
Figure 4.. Genetic recombination sites and Cnl1 distribution in Bt65 x H99 F1 progeny.
Recombination sites along each of the 14 chromosomes for the six Bt65a x H99α F1 progeny for which long-read whole-genome sequencing was conducted. Genomic loci depicted in blue were inherited from the H99 parent, and orange genomic loci were inherited from the Bt65 parent. Cnl1 elements throughout the F1 progeny and parental genomes are indicated by black arrowheads in the upper panel. Centromeres are indicated by dark blue boxes in only the parental genomes. Hypermutator F1 progeny are indicated with asterisks, and the ZNF3 locus is indicated in each strain with a red arrowhead. Regions enlarged below illustrate Cnl1 subtelomeric arrays on several chromosomes and depict examples of Cnl1 array expansion (e.g. Chr4, P18), contraction (e.g. Chr1, P14), and invasion of naïve H99 subtelomeres (e.g. Chr1, P8). Telomeric repeat sequences are indicated by black half circles only in the enlarged panels.
Figure 5.
Figure 5.. ZNF3 complementation in Bt65 significantly reduces mutation rates and restores siRNA production.
Mutation rates of (A) the two independent ZNF3 complementation mutants, Bt65+ZNF3-1 and Bt65+ZNF3-2, as well as control strains, and (B) ago1Δ and rdp1Δ deletion mutants in the Bt65, Bt65+ZNF3-1 and Bt65+ZNF3-2 genetic backgrounds and controls on YPD+rapamycin+FK506 medium. Heights of bars represent mutation rate (number of mutations per cell per generation) and error bars represent 95% confidence intervals. Fluctuation analysis was conducted once for all strains in both A and B, with n = 10 biologically independent cultures per strain. (C) Size distributions of sRNA reads from each indicated strain. Dashed vertical lines indicate the 21 to 24 nucleotide size range, the characteristic sizes of siRNAs produced by the RNAi pathway. (D) Proportion of sRNA reads (y-axis) with the indicated 5’ nucleotide identity (color of stacked bar) at each sRNA read size (x-axis). siRNAs produced by the RNAi pathway characteristically have a 5’ uracil nucleotide. (E) Quantification of sense and antisense sRNAs from Bt65, Bt65 + ZNF3-1, and Bt65 + ZNF3-2 aligning to an array of subtelomeric Cnl1 elements on Chr1 of Bt65. Transposable elements along the chromosome are indicated by dark grey boxes, while intergenic regions are light grey.

Comment in

Similar articles

Cited by

References

    1. Barrick J. et al. Genome evolution and adaptation in a long-term experiment with Escherichia coli. Nature 461, 1243–1247 (2009). - PubMed
    1. Harfe BD & Jinks-Robertson S. Mismatch repair proteins and mitotic genome stability. Mutat. Res 451, 151–167 (2000). - PubMed
    1. Billmyre RB, Croll D. & Li W. Highly recombinant VGII Cryptococcus gattii population develops clonal outbreak clusters through both sexual macroevolution and asexual microevolution. mBio 5, e01494–14 (2014). - PMC - PubMed
    1. Billmyre RB, Clancey SA & Heitman J. Natural mismatch repair mutations mediate phenotypic diversity and drug resistance in Cryptococcus deuterogattii. eLife 6, e28802 (2017). - PMC - PubMed
    1. Healey KR et al. Prevalent mutator genotype identified in fungal pathogen Candida glabrata promotes multi-drug resistance. Nat. Commun 7, 11128 (2016). - PMC - PubMed

Publication types