. 2022 Aug 2;5(1):781.
doi: 10.1038/s42003-022-03743-9.

Gonadal sex patterns p21-induced cellular senescence in mouse and human glioblastoma

Affiliations

Gonadal sex patterns p21-induced cellular senescence in mouse and human glioblastoma

Lauren Broestl et al. Commun Biol. .

Abstract

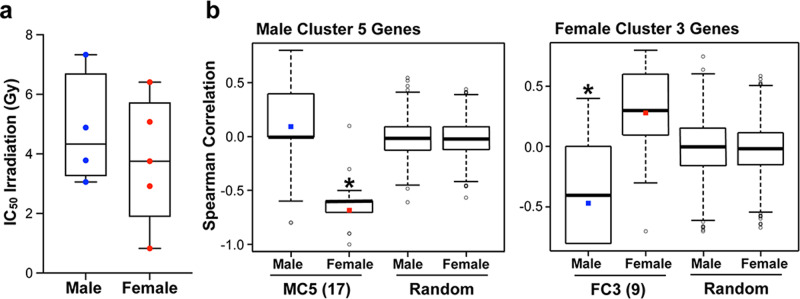
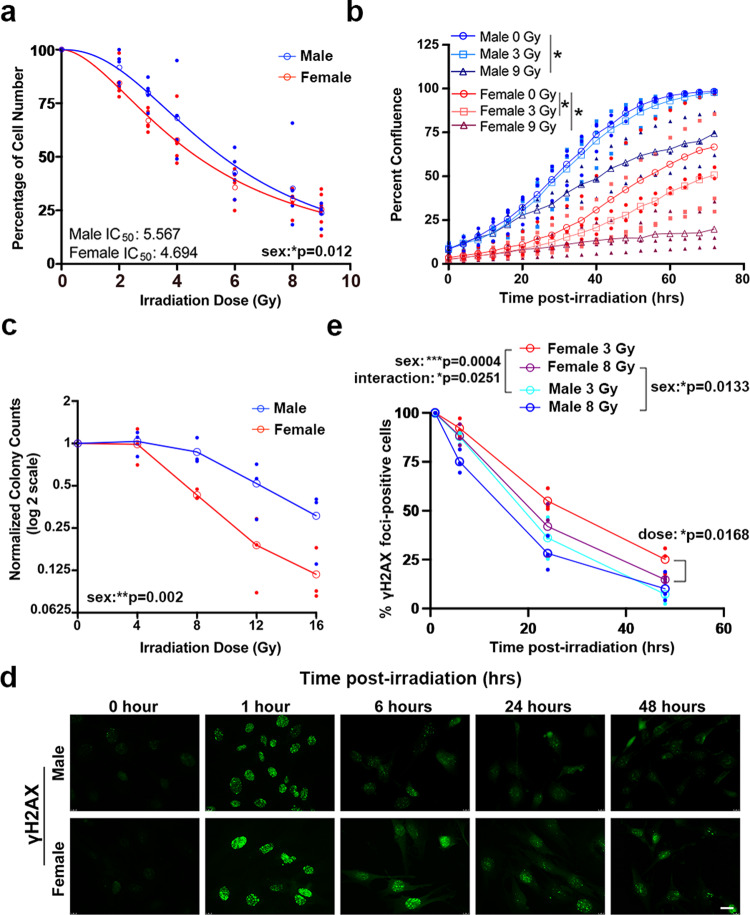
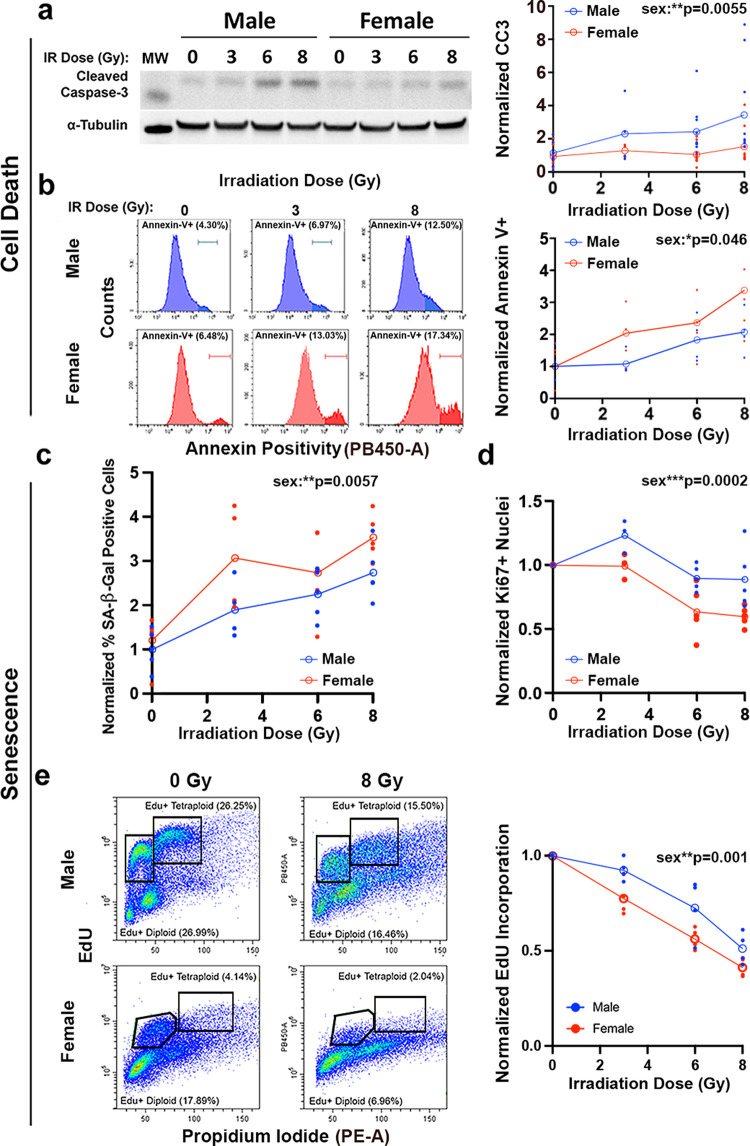
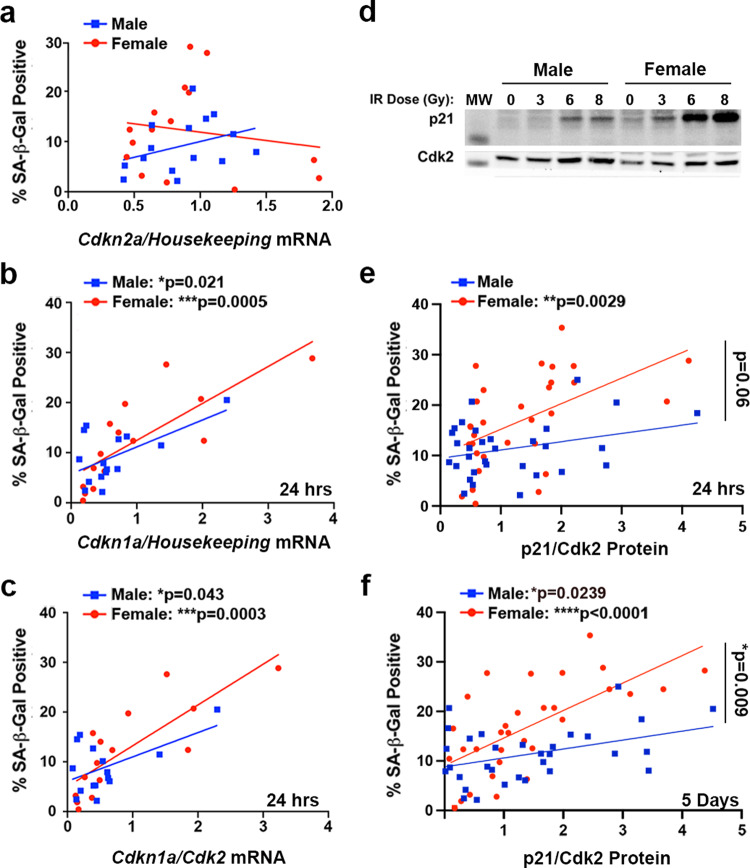
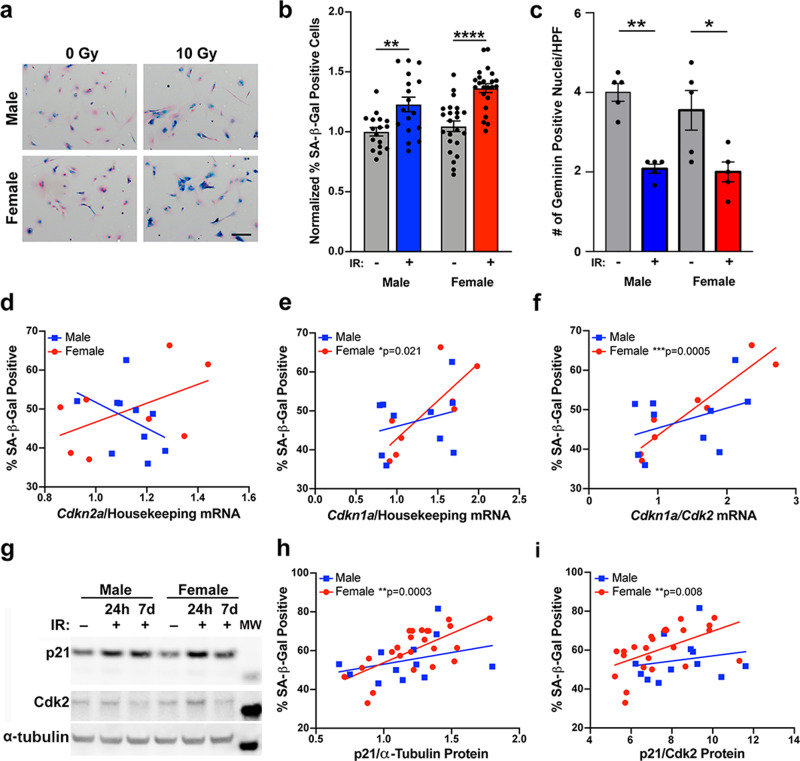
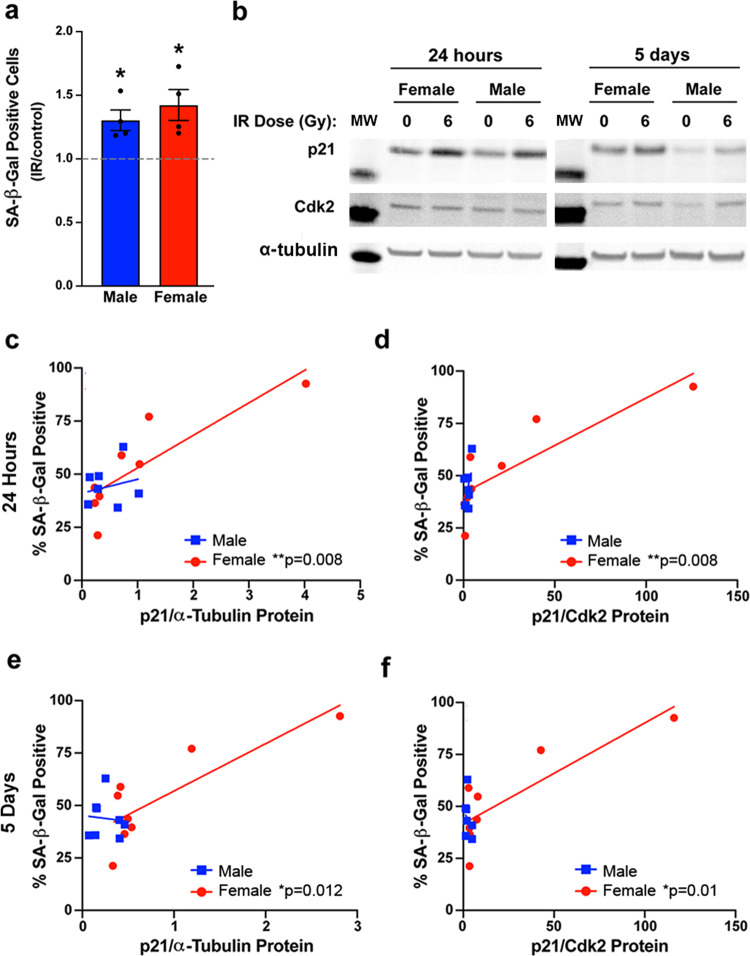
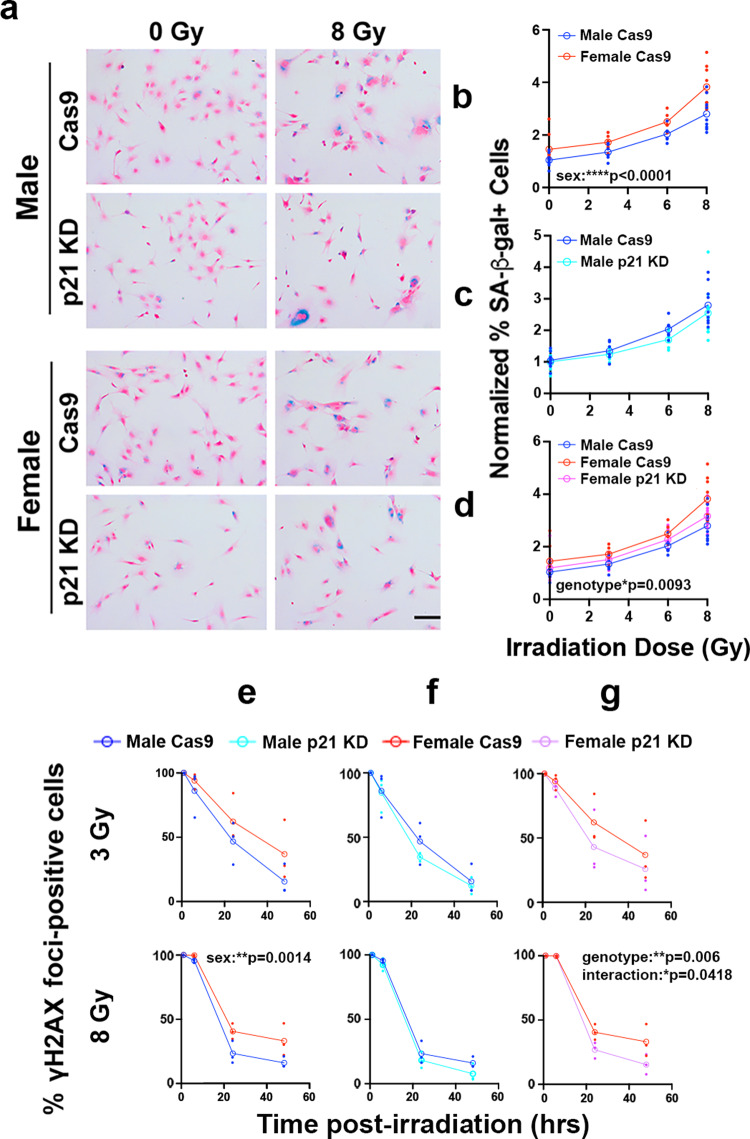
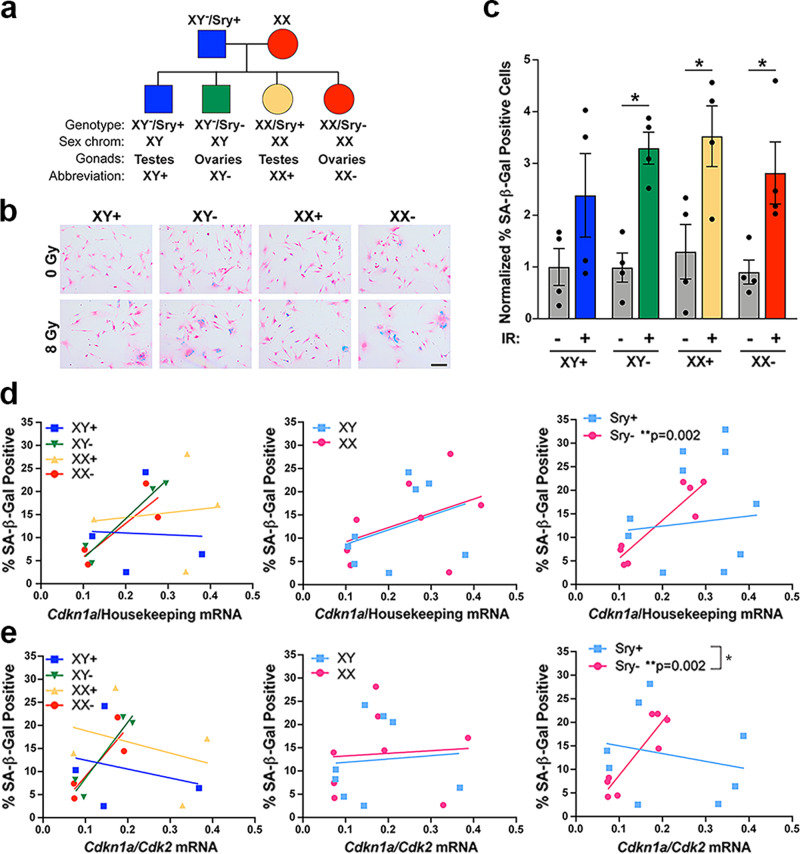
Males exhibit higher incidence and worse prognosis for the majority of cancers, including glioblastoma (GBM). Disparate survival may be related to sex-biased responses to treatment, including radiation. Using a mouse model of GBM, we show that female cells are more sensitive to radiation, and that senescence represents a major component of the radiation therapeutic response in both sexes. Correlation analyses revealed that the CDK inhibitor p21 and irradiation induced senescence were differentially regulated between male and female cells. Indeed, female cellular senescence was more sensitive to changes in p21 levels, a finding that was observed in wildtype and transformed murine astrocytes, as well as patient-derived GBM cell lines. Using a novel Four Core Genotypes model of GBM, we further show that sex differences in p21-induced senescence are patterned during early development by gonadal sex. These data provide a rationale for the further study of sex differences in radiation response and how senescence might be enhanced for radiation sensitization. The determination that p21 and gonadal sex are required for sex differences in radiation response will serve as a foundation for these future mechanistic studies.


Conflict of interest statement

The authors declare no competing interests.

Figures

Fig. 1
Fig. 1. Unique pathways contribute to cell-intrinsic radiation sensitivity in male and female human GBM lines.
a Box plots of irradiation IC50 values for four male and five female primary human GBM lines (horizontal bar indicates median). b Spearman correlation coefficients of irradiation IC50 values with expression of MC5 genes (17 genes), FC3 genes (9 genes), or random gene sets of the same size. For MC5 and FC3, box plots represent the distribution of the correlation coefficients for the 17 and 9 genes respectively. The colored square marks the average. For the random gene sets, the box plots represent the distribution of the Olkin-averaged Spearman correlation coefficient for 1000 gene sets of 17 (Male Cluster 5) or 9 (Female Cluster 3) randomly selected genes. MC5: male p = 0.245, female p < 0.001. FC3: male p = 0.025, Female p = 0.083.
Fig. 2
Fig. 2. Female mouse GBM model astrocytes are more sensitive to radiation treatment.
a Irradiation dose response curves in male and female Nf1−/− DNp53 astrocytes. Curves represent combined values from five separate established cell lines—each consisting of a corresponding male and female line generated at the same time. Male IC50 = 5.567 (95% CI 5.094–6.088), female IC50 = 4.694 (95% CI 4.349–5.061). Two-way ANOVA: dose p < 0.0001, sex p = 0.0123, interaction p = 0.6034. Open symbols are the means of the individual data points, which are presented as closed symbols. Lines are non-linear fits to the individual data points (n = 5/sex). b Male and female Nf1−/− DNp53 cell growth curves after irradiation with 0, 3, or 9 Gy. Cell growth was tracked using live cell imaging; images were taken every 4 h for 3 days and used to calculate percent confluence over time. Two-way repeated measures ANOVA—male 0 Gy vs male 3 Gy: time p < 0.0001, dose p = 0.3394, interaction p = 0.9087; male 0 Gy vs male 9 Gy: time p < 0.0001, dose p = 0.0325, interaction p < 0.0001; female 0 Gy vs female 3 Gy: time p < 0.0001, dose p = 0.0183, interaction p < 0.0001; female 0 Gy vs female 9 Gy: time p < 0.0001, dose p = 0.05, interaction p < 0.0001. Open symbols are the means of the individual data points, which are presented as closed symbols. Lines are non-linear fits to the individual data points (n = 3/sex). c Normalized colony counts from the clonogenic assay in male and female Nf1−/− DNp53 cells 5 days after irradiation with 0, 4, 8, 12, or 16 Gy. Two-way ANOVA: dose p < 0.0001, sex p = 0.002, interaction p = 0.111. Open symbols are the means of the individual data points, which are presented as closed symbols. (n = 3/sex). d Representative immunofluorescence images of male and female Nf1−/− DNp53 astrocytes stained for γH2AX 0, 1, 6, 24, and 48 h after irradiation with 3 Gy. Scale bar, 20 μm. e Quantification of the percent of cells with >10 γH2AX foci at each timepoint in male and female Nf1−/− DNp53 astrocytes following irradiation with 3 or 8 Gy. Two-way ANOVA—male 3 Gy vs female 3 Gy: time p < 0.0001, sex p = 0.0004, interaction p = 0.0251; male 8 Gy vs female 8 Gy: time p < 0.0001, sex p = 0.0133, interaction p = 0.2784; female 3 Gy vs female 8 Gy: time p < 0.0001, dose p = 0.0168, interaction p = 0.2959.
Fig. 3
Fig. 3. Cell death and senescence contribute to sex differences in radiation response in mouse GBM model astrocytes.
a Analysis of radiation-induced caspase-3 cleavage. Representative western blot image of cleaved caspase-3 in male and female Nf1−/− DNp53 astrocytes 5 days after irradiation with 0, 3, 6, or 8 Gy; one male and one female cell line are shown. Cleaved caspase-3 (CC3) levels were first normalized to their corresponding α-Tubulin values. Then all CC3/α-Tubulin values were normalized to the corresponding Male 0 Gy condition of the same cell line, which was arbitrarily set at 1. Two-way ANOVA: dose p = 0.0195, sex p = 0.0055, interaction p = 0.2085. Open symbols are the means of the individual data points, which are presented as closed symbols (n = 9/sex/dose). Molecular weight markers (MW): Cleaved caspase-3 (15 kDa), α-Tubulin (50 kDa). b Analysis of radiation-induced annexin V positivity. Sample histograms are shown for male (blue) and female (red) Nf1−/− DNp53 cells irradiated with 0, 3, or 8 Gy and stained for annexin 5 days later. Quantification of annexin V positivity 5 days after irradiation with 0, 3, 6, or 8 Gy. Values were normalized to the corresponding male 0 Gy condition of the same cell line, which was arbitrarily set at 1. Two-way ANOVA: dose p = 0.0077, sex p = 0.0464, interaction p = 0.8155. Open symbols are the means of the individual data points, which are presented as closed symbols (n = 4/sex/dose) c Quantification of the percentage of SA-β-gal positive cells after irradiation with 0, 3, 6, or 8 Gy. Values were normalized to the corresponding Male 0 Gy condition of the same cell line, which was arbitrarily set at 1. Two-way ANOVA: dose p < 0.0001, sex p = 0.0057, interaction p = 0.5356. Open symbols are the means of the individual data points, which are presented as closed symbols (n = 4–5/sex/dose). d Percent of Ki67 positive cells in male and female Nf1−/− DNp53 cultures 5 days after irradiation with 0, 3, 6, or 8 Gy. Values were normalized to the 0 Gy control condition for males and females separately. Two-way ANOVA: dose p < 0.0001, sex p = 0.0002, interaction p = 0.08. Open symbols are the means of the individual data points, which are presented as closed symbols (n = 3-5/sex/dose). e Analysis of EdU incorporation. Example density plots for EdU incorporation in male and female Nf1−/− DNp53 astrocytes under control conditions or 24 h after irradiation with 8 Gy. These cultures have both 2 N and 4 N populations and S-phase Edu incorporation is indicated by black gates. Quantification of combined 2 N and 4 N EdU incorporation 24 h after irradiation with 0, 3, 6, or 8 Gy. Values were normalized to the 0 Gy control condition for males and females separately. Two-way ANOVA: dose p < 0.0001, sex p = 0.001, interaction p = 0.177. Open symbols are the means of the individual data points, which are presented as closed symbols (n = 4/sex/dose).
Fig. 4
Fig. 4. Expression of p21 differentially correlates with SA-β-gal positivity in male and female mouse GBM model astrocytes.
a Correlation between Cdkn2a (p16) mRNA levels at 24 h after irradiation with 0, 6, or 9 Gy and the percentage of SA-β-gal positive cells at 5 days after irradiation in male and female Nf1−/− DNp53 astrocytes (n = 15/sex). b Correlation between Cdkn1a (p21) mRNA levels at 24 h after irradiation with 0, 6, or 9 Gy and the percentage of SA-β-gal positive cells at 5 days after irradiation in male and female Nf1−/− DNp53 astrocytes. Male correlation: r = 0.59, p = 0.0212; Female correlation: r = 0.79, p = 0.0005 (n = 15/sex). c Correlation between the Cdkn1a/Cdk2 mRNA ratio at 24 h after irradiation with 0, 6, or 9 Gy and the percentage of SA-β-gal positive cells at 5 days after irradiation in male and female Nf1−/− DNp53 astrocytes. Male correlation: r = 0.53, p = 0.0427; Female correlation: r = 0.80, p = 0.0003 (n = 15/sex). d Representative western blot images of p21 and Cdk2 5 days post-irradiation with 0, 3, 6, or 8 Gy. One male and one female Nf1−/− DNp53 cell line are shown. Molecular weight markers (MW): p21 (15 kDa), Cdk2 (30 kDa). e Correlation between the p21/Cdk2 protein ratio at 24 h after irradiation with 0, 3, 6, or 8 Gy and the percentage of SA-β-gal positive cells at 5 days after irradiation in male and female Nf1−/− DNp53 astrocytes. Male correlation: r = 0.30, p = 0.0997, female correlation: r = 0.52, p = 0.0029, male slope vs female slope: p = 0.0627—indicated by bracket (n = 31/sex). f Correlation between the p21/Cdk2 protein ratio 5 days after irradiation with 0, 3, 6, or 8 Gy and the percentage of SA-β-gal positive cells at 5 days after irradiation in male and female Nf1−/− DNp53 astrocytes. Male correlation: r = 0.40, p = 0.0239, female correlation: r = 0.65, p < 0.0001, male slope vs female slope: p = 0.009—indicated by bracket (n = 31/sex).
Fig. 5
Fig. 5. Wild-type mouse astrocytes exhibit sex differences in the relationship between p21 and SA-β-gal positivity.
a Example images of wildtype mouse astrocytes stained for SA-β-gal seven days after irradiation with 0 or 10 Gy, followed by counterstaining with nuclear fast red. Scale bar, 150 μm. b Quantification of the percentage of SA-β-gal positive cells. Results are pooled from 3 separate experiments, representing a total of 17 male and 23 female pups across 7 litters. Values were normalized to the Male 0 Gy condition of the same experiment, which was arbitrarily set at 1. Two-way ANOVA: dose p < 0.0001, sex p = 0.0455, interaction p = 0.3676. **p < 0.01, ****p < 0.0001 as indicated by bracket. Data are means +/− SEM (n = 17–23/sex/condition). c Number of Geminin positive nuclei per high-powered field. Shown are the means +/− SEM and each of the individual replicate points (n = 5/sex/condition). Two-way ANOVA: dose p < 0.0001, sex p = 0.3948, interaction p = 0.5561. *p = 0.0145 and **p = 0.0024 as indicated by bracket. d Correlation between Cdkn2a (p16) mRNA levels at 24 h after irradiation with 0 or 10 Gy and the percentage of SA-β-gal positive cells at 7 days after irradiation in male and female wildtype astrocytes (n = 10 male/8 female). e Correlation between Cdkn1a (p21) mRNA levels at 24 h after irradiation with 0 or 10 Gy and the percentage of SA-β-gal positive cells at 7 days after irradiation in male and female wildtype astrocytes. Male correlation: r = 0.28, p = 0.441, female correlation: r = 0.79, p = 0.0207 (n = 10 male/8 female). f Correlation between the Cdkn1a/Cdk2 mRNA ratio at 24 h after irradiation with 0 or 10 Gy and the percentage of SA-β-gal positive cells at 7 days after irradiation in male and female wild-type astrocytes. Male correlation: r = 0.39, p = 0.2608, Female correlation: r = 0.94 p = 0.0005 (n = 10 male/8 female). g Representative western blot images of p21 and Cdk2 in non-irradiated and irradiated male and female wild-type astrocytes at 24 h, and irradiated male and female wild-type astrocytes at 7 days. Molecular weight markers (MW): p21 (15 kDa), Cdk2 (30 kDa), α-Tubulin (50 kDa). h Correlation between p21 protein levels at 24 h after irradiation with 0 or 10 Gy and the percentage of SA-β-gal positive cells at 7 days after irradiation in male and female wild-type astrocytes. Male correlation: r = 0.33, p = 0.2909, female correlation: r = 0.67, p = 0.0003 (n = 12 male/24 female). i Correlation between the p21/Cdk2 protein ratio at 24 h after irradiation with 0 or 10 Gy and the percentage of SA-β-gal positive cells at 7 days after irradiation in male and female wildtype astrocytes. Male correlation: r = 0.20, p = 0.5418, Female correlation: r = 0.53, p = 0.0081 (n = 12 male/24 female).
Fig. 6
Fig. 6. Primary human GBM lines exhibit sex differences in the relationship between p21 and SA-β-gal positivity.
a Fold change (irradiated/control) in the percentage of SA-β-gal positive cells 5 days after irradiation with 0 or 6 Gy in four male and four female primary human GBM lines. *p = 0.0329 (male) and *p = 0.0401 (female). b Representative western blot images of p21 and Cdk2 24 h and 5 days after irradiation with 0 or 6 Gy in male and female human GBM lines. Molecular weight markers (MW): p21 (15 kDa), Cdk2 (30 kDa), α-Tubulin (50 kDa). c Correlation between p21 protein levels at 24 h after irradiation with 0 or 6 Gy and the percentage of SA-β-gal positive cells at 5 days after irradiation in male and female human GBM lines. Male correlation: r = 0.23, p = 0.5783, female correlation: r = 0.85, p = 0.008 (n = 8/sex). d Correlation between the p21/Cdk2 protein ratio at 24 h after irradiation with 0 or 6 Gy and the percentage of SA-β-gal positive cells at 5 days after irradiation in male and female human GBM lines. Male correlation: r = 0.54, p = 0.1649, female correlation: r = 0.85, p = 0.0081 (n = 8/sex). e Correlation between p21 protein levels at 5 days after irradiation with 0 or 6 Gy and the percentage of SA-β-gal positive cells at 5 days after irradiation in male and female human GBM lines. Male correlation: r = −0.09, p = 0.8408, female correlation: r = 0.83, p = 0.0115 (n = 8/sex). f Correlation between the p21/Cdk2 protein ratio at 5 days after irradiation with 0 or 6 Gy and the percentage of SA-β-gal positive cells at 5 days after irradiation in male and female human GBM lines. Male correlation r = −0.27, p = 0.5179, female correlation: r = 0.84, p = 0.0099 (n = 8/sex).
Fig. 7
Fig. 7. p21 knockdown abrogates sex differences in senescence and DNA damage response in irradiated mouse GBM model astrocytes.
a Example images of Nf1−/− DNp53 Cas9 control and p21 knockdown (KD) male and female astrocytes stained for SA-β-gal 5 days after irradiation with 0 or 8 Gy, followed by counterstaining with nuclear fast red. Scale bar, 150 μm. bd Quantification of the percentage of SA-β-gal positive cells 5 days post-irradiation with 0, 3, 6, or 8 Gy. Values were normalized to the corresponding Male 0 Gy condition of the same cell line, which was arbitrarily set at 1. b Male vs female Cas9 control cells—two-way ANOVA: dose p < 0.0001, sex p < 0.0001, interaction p = 0.2093. c Male Cas9 vs male p21 KD - two-way ANOVA: dose p < 0.0001, genotype p = 0.1459, interaction p = 0.8529; d Female Cas9 vs female p21 KD: two-way ANOVA: dose p < 0.0001, genotype p = 0.0093, interaction p = 0.5635. Male Cas9 curve (blue) is shown for comparison. Open symbols are the means of the individual data points, which are presented as closed symbols (bd n = 6–9/sex/dose). eg Quantification of the percent of Nf1−/− DNp53 Cas9 control versus p21 knockdown (KD) cells with >10 γH2AX foci at 1, 6, 24, and 48 h following irradiation with 3 Gy (top row) or 8 Gy (bottom row). Two-way ANOVAs: e Male Cas9 versus female Cas9 at 3 Gy: time: p < 0.0001, sex: p = 0.079, interaction: p = 0.625; male Cas9 versus female Cas9 at 8 Gy: time: p < 0.0001, sex: p = 0.0014, interaction: p = 0.0524. f Male Cas9 versus p21 KD at 3 Gy: time p < 0.0001, genotype: p = 0.356, interaction: p = 0.775; male Cas9 versus p21 KD at 8 Gy: time p < 0.0001, genotype: p = 0.0645, interaction: p = 5773 g female Cas9 versus p21 KD at 3 Gy: time p < 0.0001, genotype: p = 0.205, interaction: p = 0.774; female Cas9 versus p21 KD at 8 Gy: time p < 0.0001, genotype: p = 0.006, interaction: p = 0.0418. Open symbols are the means of the individual data points, which are presented as closed symbols (eg n = 3/sex/timepoint).
Fig. 8
Fig. 8. Gonadal sex patterns the relationship between p21 and SA-β-gal positivity.
a Diagram of the four genotypes resulting from the FCG mouse model. b Example images of FCG GBM model astrocytes stained for SA-β-gal 5 days after irradiation with 0 or 8 Gy, followed by counterstaining with nuclear fast red. Scale bar, 150 μm. c Quantification of the percentage of SA-β-gal positive cells. Results are from two cell lines (each consisting of a corresponding XY+, XY−, XX+, and XX− line generated at the same time) tested in two separate experiments. Values were normalized to the XY + 0 Gy condition, which was arbitrarily set at 1. *p < 0.05 as indicated by bracket. Data are means +/− SEM (n = 4/genotype/condition). d Correlation between Cdkn1a (p21) mRNA levels at 24 h after irradiation with 0 or 8 Gy and the percentage of SA-β-gal positive cells at 5 days after irradiation in FCG GBM model astrocytes, showing each genotype separately (left), as well as grouped by sex chromosomes (center) or gonadal sex (Sry status) (right). Sry+ correlation: r = 0.13, p = 0.7617, Sry- correlation: r = 0.91, p = 0.0016 (n = 8/group). e Correlation between the Cdkn1a/Cdk2 mRNA ratio at 24 h after irradiation with 0 or 8 Gy and the percentage of SA-β-gal positive cells at 5 days after irradiation in FCG GBM model astrocytes, showing each genotype separately (left), as well as grouped by sex chromosomes (center) or gonadal sex (Sry status) (right). Sry+ correlation: r = −0.22, p = 0.5964, Sry− correlation: r = 0.91, p = 0.002. Sry+ slope vs Sry− slope: p = 0.0262—indicated by bracket (n = 8/group).

Similar articles

Cited by

References

    1. Rubin JB, et al. Sex differences in cancer mechanisms. Biol. Sex. Differ. 2020;11:17. doi: 10.1186/s13293-020-00291-x. - DOI - PMC - PubMed
    1. Cook MB, McGlynn KA, Devesa SS, Freedman ND, Anderson WF. Sex disparities in cancer mortality and survival. Cancer Epidemiol. Biomark. Prev. 2011;20:1629–1637. doi: 10.1158/1055-9965.EPI-11-0246. - DOI - PMC - PubMed
    1. Siegel RL, Miller KD, Jemal A. Cancer Statistics, 2017. CA. Cancer J. Clin. 2017;67:7–30. doi: 10.3322/caac.21387. - DOI - PubMed
    1. Ostrom QT, et al. CBTRUS statistical report: primary brain and other central nervous system tumors diagnosed in the United States in 2013-2017. Neuro-Oncol. 2020;22:iv1–iv96. doi: 10.1093/neuonc/noaa200. - DOI - PMC - PubMed
    1. Ostrom QT, Rubin JB, Lathia JD, Berens ME, Barnholtz-Sloan JS. Females have the survival advantage in glioblastoma. Neuro-Oncol. 2018;20:576–577. doi: 10.1093/neuonc/noy002. - DOI - PMC - PubMed

Publication types

Substances