. 2022 Aug 2;22(1):843.
doi: 10.1186/s12885-022-09808-6.

A role for ceruloplasmin in the control of human glioblastoma cell responses to radiation

Affiliations

A role for ceruloplasmin in the control of human glioblastoma cell responses to radiation

Charlotte Roy et al. BMC Cancer. .

Abstract

Background: Glioblastoma (GB) is the most common and most aggressive malignant brain tumor. In understanding its resistance to conventional treatments, iron metabolism and related pathways may represent a novel avenue. As for many cancer cells, GB cell growth is dependent on iron, which is tightly involved in red-ox reactions related to radiotherapy effectiveness. From new observations indicating an impact of RX radiations on the expression of ceruloplasmin (CP), an important regulator of iron metabolism, the aim of the present work was to study the functional effects of constitutive expression of CP within GB lines in response to beam radiation depending on the oxygen status (21% O2 versus 3% O2).

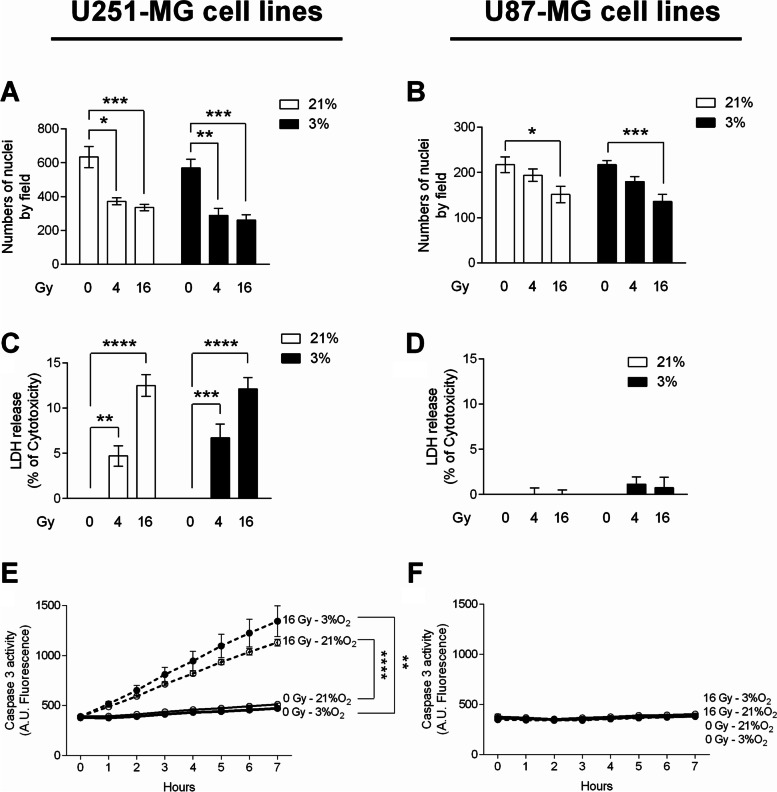
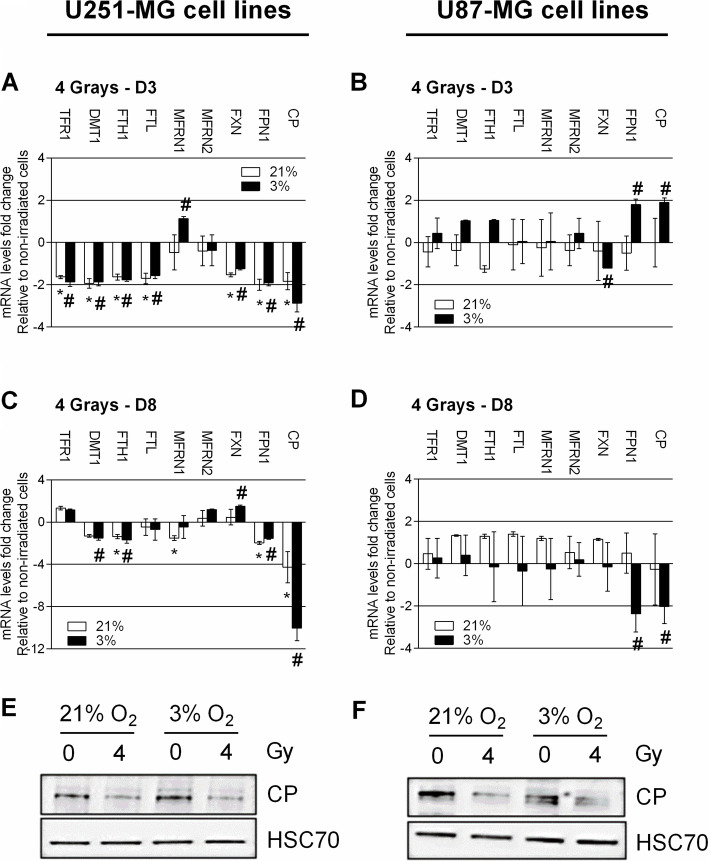
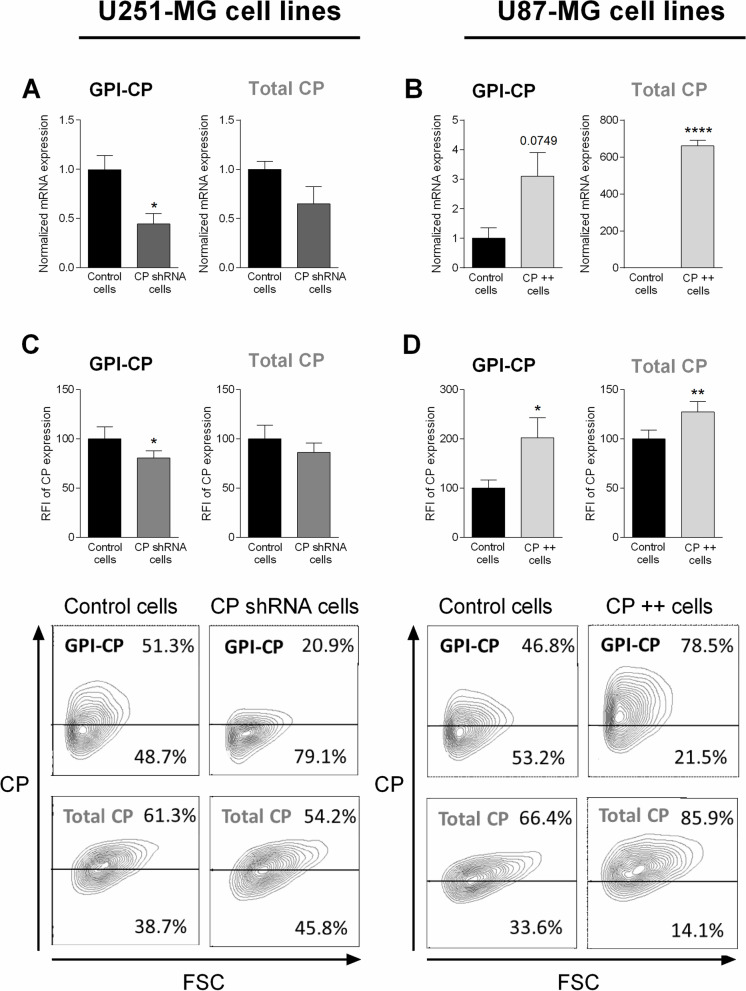
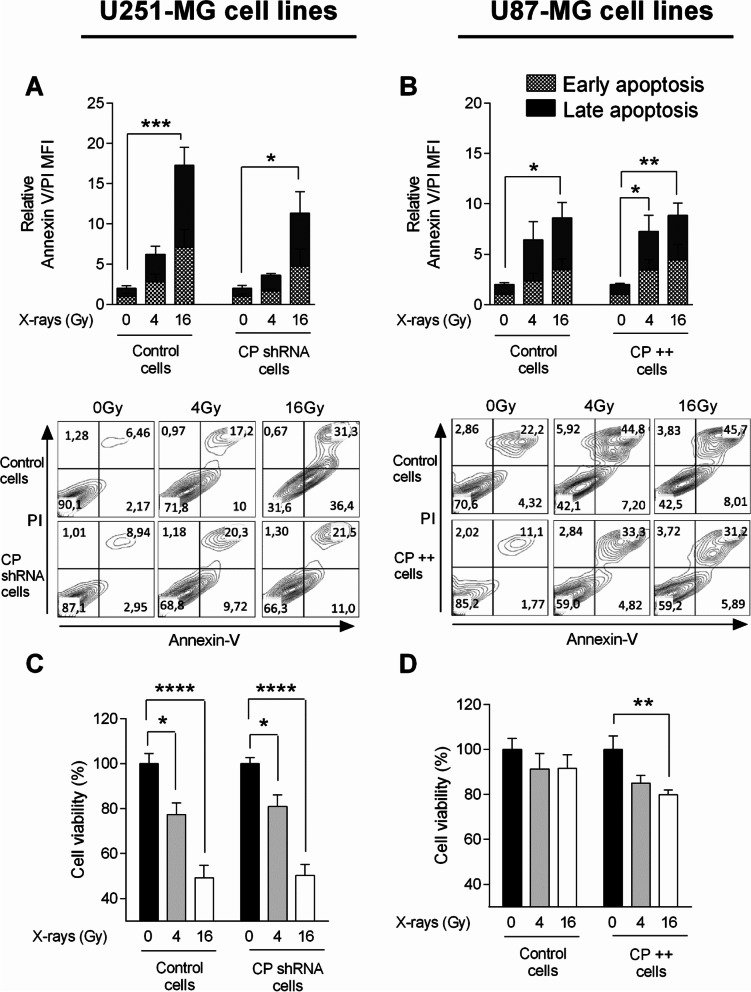
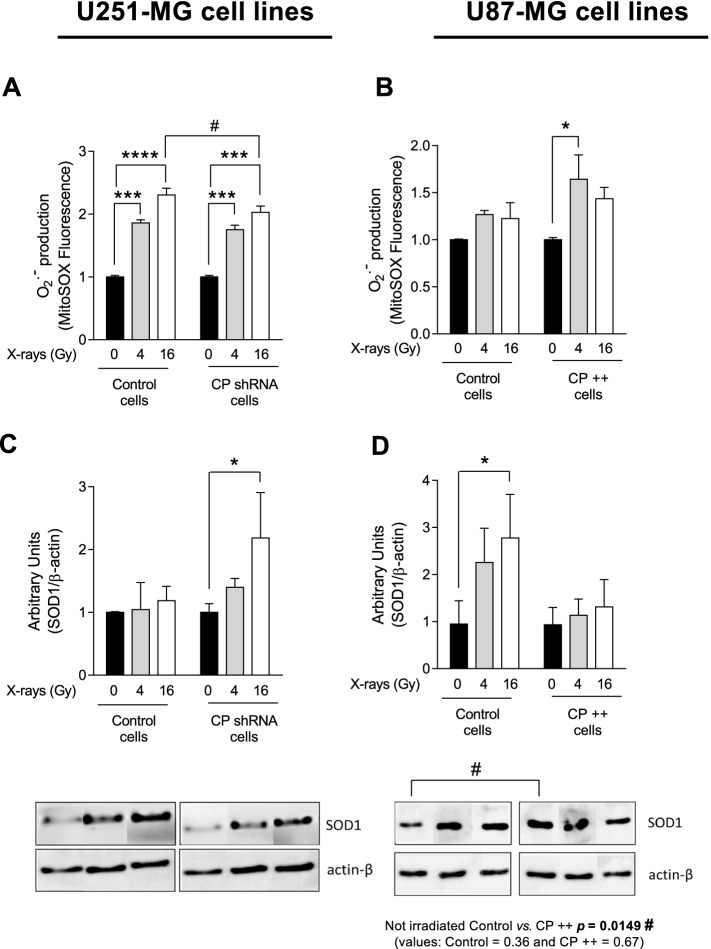
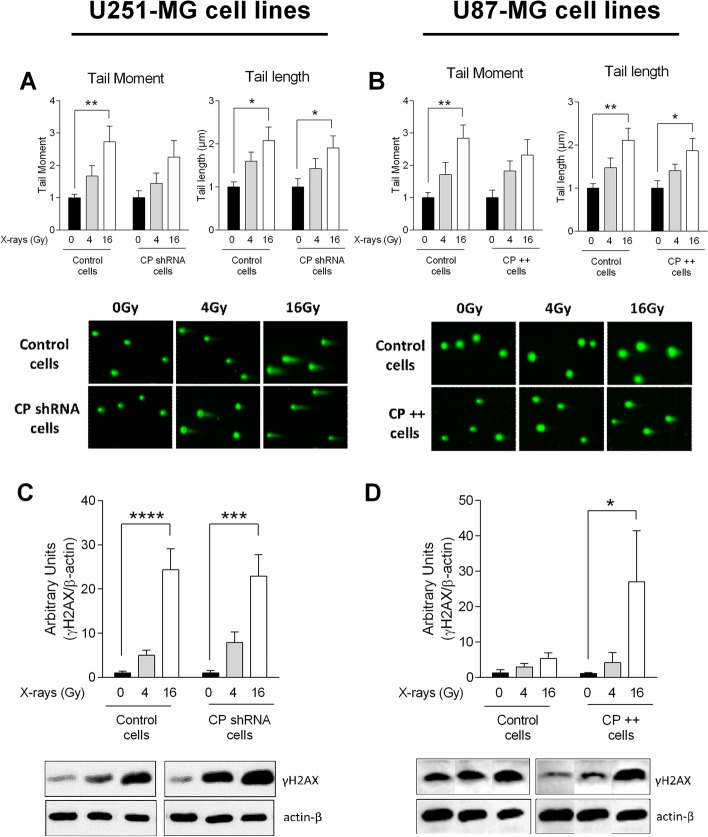
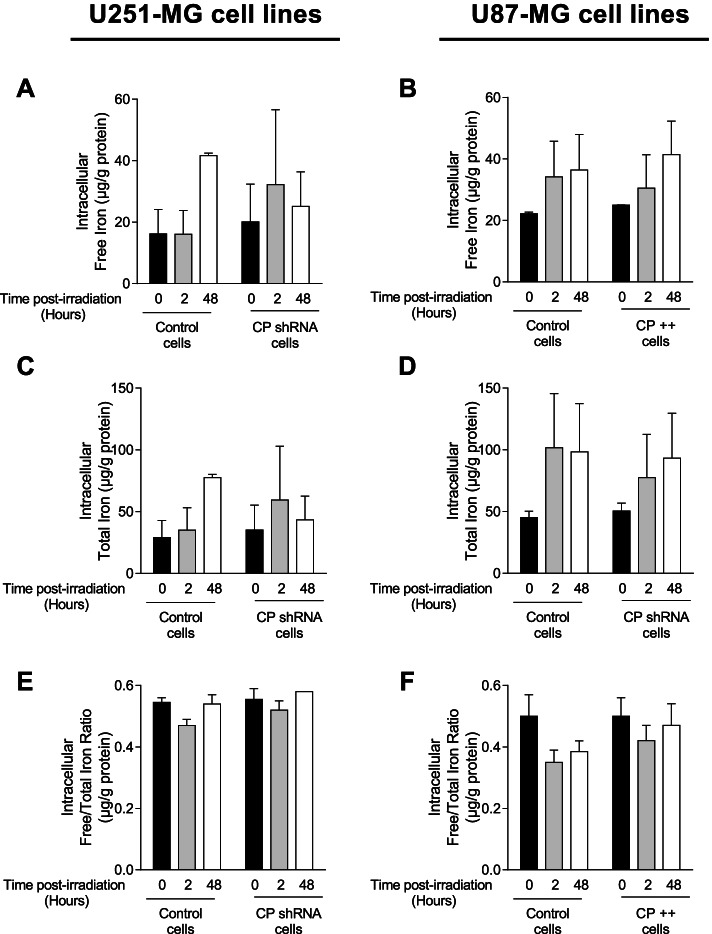
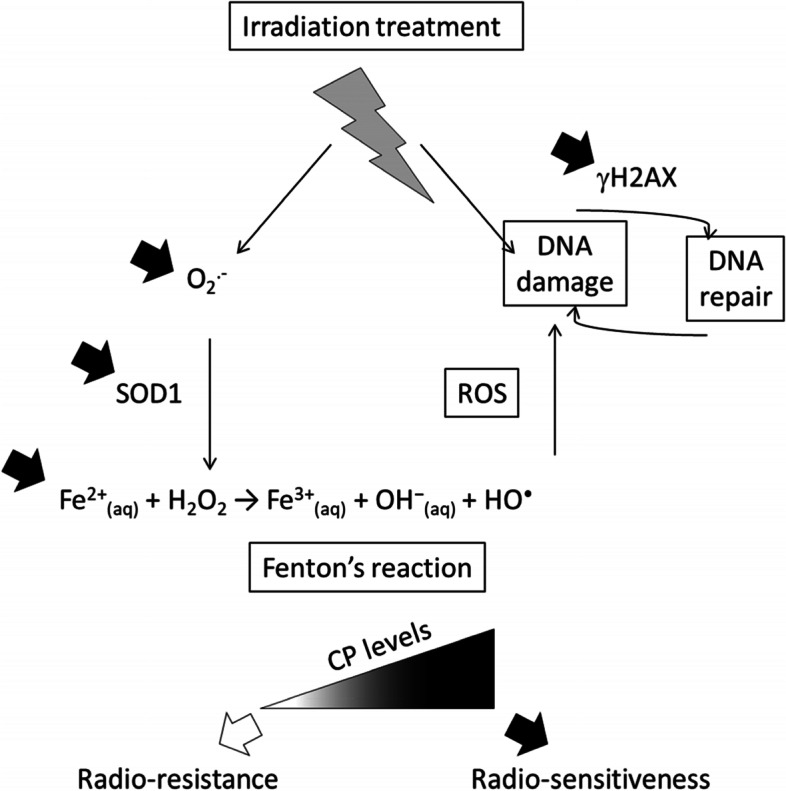
Methods and results: After analysis of radiation responses (Hoechst staining, LDH release, Caspase 3 activation) in U251-MG and U87-MG human GB cell lines, described as radiosensitive and radioresistant respectively, the expression of 9 iron partners (TFR1, DMT1, FTH1, FTL, MFRN1, MFRN2, FXN, FPN1, CP) were tested by RTqPCR and western blots at 3 and 8 days following 4 Gy irradiation. Among those, only CP was significantly downregulated, both at transcript and protein levels in the two lines, with however, a weaker effect in the U87-MG, observable at 3% O2. To investigate specific role of CP in GB radioresistance, U251-MG and U87-MG cells were modified genetically to obtain CP depleted and overexpressing cells, respectively. Manipulation of CP expression in GB lines demonstrated impact both on cell survival and on activation of DNA repair/damage machinery (γH2AX); specifically high levels of CP led to increased production of reactive oxygen species, as shown by elevated levels of superoxide anion, SOD1 synthesis and cellular Fe2 + .

Conclusions: Taken together, these in vitro results indicate for the first time that CP plays a positive role in the efficiency of radiotherapy on GB cells.

Keywords: Ceruloplasmin; Glioblastoma; Hypoxia; Iron Metabolism; Radioresistance.


Conflict of interest statement

The authors declare that they have no competing interests.

Figures

Fig. 1
Fig. 1
Ionizing radiation inhibits proliferation linked with increased cytotoxicity and apoptosis but only in U251-MG GB cells. For these experiments, GB cells were cultivated at 21% or 3% oxygen in non-irradiated condition (0) or 3 days after an irradiation of 4 or 16 Gy. Numbers of nuclei of U251-MG (A) and U87-MG (B) GB cells are expressed as mean ± Standard Error of the Mean (S.E.M.) (n = 3). Measure of Lactate Dehydrogenase (LDH) release into cell culture medium of U251-MG (C) and U87-MG (D) GB was assessed. Cytotoxicity is expressed as mean percentage ± SEM (n = 3) of the total amount of LDH released from cells and relative to GB cells treated 0.1% Triton X-100, given the arbitrary percentage of 100. DEVD-AMC caspase-3 activity in U251-MG (E) and U87-MG (F) GB cells is expressed as mean arbitrary units (A.U.) of fluorescence per 30 µg of proteins ± SEM (n = 3). One-way ANOVA test was performed between non-irradiated (0 Gy) or irradiated (4 or 16 Gy) conditions (*, p-value ≤ 0.05; **, p-value ≤ 0.01; ***, p-value ≤ 0.001; ****, p-value ≤ 0.0001)
Fig. 2
Fig. 2
Change in expression of iron metabolism-related genes and ceruloplasmin protein in response to IR in U251-MG and U87-MG cells. mRNA level fold change of transferrin receptor 1 (TFR1), divalent metal transporter 1 (DMT1), heavy and light ferritin chain (respectively FTH1 and FTL), Mitoferrin 1 and 2 (respectively MFRN1 and MFRN2), frataxin (FXN), ferroportin (FPN1) and CP in U251-MG (A and C) and U87-MG (B and D) GB cells cultivated at 21% or 3% oxygen at 3- (A and B) or 8- days (C and D) post-IR with 4 Gy. Fold change are expressed as mean ± SEM (n = 3) and relative to non-irradiated control condition, given the arbitrary value of 1. Multiple T-Test was performed (*, p-value ≤ 0.05 for 21%; # p-value ≤ 0.05 for 3%). Levels of CP protein and heat shock cognate protein 70 (HSC70) protein used as loading control protein in U251-MG (E) and U87-MG (F) GB cells cultivated at 21% or 3% oxygen in non-irradiated condition (0) or 3 days after an irradiation of 4 Gy. Western blot data represent one of three independent experiments with comparable results
Fig. 3
Fig. 3
Identification of stable knockdown or overexpressing of CP in GB cells. U251-MG and U87-MG GB cell lines were respectively transfected with CP short hairpin (sh)RNA and CP cDNA. To validated clone construction, CP gene expression level was measured by quantitative real-time PCR in stable transfected U251-MG (A) and U87-MG cells (B). GPI-CP expression (membrane-bound CP) is represented in left, while CP all isoforms expression is represented in right (A and B). CP expression is expressed in mRNA expression normalized to their own control ± SEM (n = 3). CP protein level was measured by flow cytometry in stable transfected U251-MG (C) and U87-MG cells (D). GPI-CP expression (membrane-bound CP), obtained without permeabilization, is represented in left graph, while CP all isoforms expression, obtained after permeabilization, is represented in right graph (C and D). CP expression is expressed as RFI ± SEM (n = 5). T-test was performed between normalized Control versus Clones conditions (*, p-value ≤ 0.05; **, p-value ≤ 0.01; ****, p-value ≤ 0.0001)
Fig. 4
Fig. 4
Modulation of cellular viability and apoptosis in CP-modulated cells post-IR. Early and late apoptosis was evaluated by measure of annexin V positive cells and Ann V and IP positive cells, respectively, by flow cytometry in stable transfected U251-MG (A) and U87-MG GB (B) cell lines 24 h after a single exposure to 4 Gy- or 16 Gy-irradiation at 3% oxygen. Apoptosis is expressed as relative MFI of annexin V and PI ± SEM (n = 3). In same conditions but here 48 h after IR, MTS viability assay was performed in U251-MG (C) and U87-MG cells (D). MTS viability is expressed as DO ± SEM (n = 7). One-way ANOVA with multiple comparisons (each group was compared to their own normalized control) was performed between Control vs. irradiated cells (*, p-value ≤ 0.05; **, p-value ≤ 0.01; ***, p-value ≤ 0.001; ****, p-value ≤ 0.0001)
Fig. 5
Fig. 5
Change in superoxide anion production and SOD1 expression in CP-modulated cells post-IR. Superoxide anion production was evaluated by flow cytometry measuring MitoSOX™ fluorescence in stable transfected U251-MG (A) and U87-MG GB (B) cell lines 24 h after a single exposure to 4 Gy- or 16 Gy-irradiation at 3% oxygen. Anion superoxide is expressed as % of positive cells ± SEM (n = 3). In same conditions, western blotting was performed to evaluate SOD1 expression in U251-MG (C) and U87-MG cells (D). SOD1 expression is expressed as mean ± SEM (n = 4). One-way ANOVA with multiple comparisons (each group was compared to their own normalized control) was performed between Control vs. irradiated cells (***, p-value ≤ 0.001; ****, p-value ≤ 0.0001). Two-way ANOVA was performed when cell populations have been compared (#, p-value ≤ 0.05)
Fig. 6
Fig. 6
DNA damage and expression of DNA repair marker in CP-modulated cells post-IR. Single cell electrophoresis comet assay was performed to measure DNA double-strand breaks in stable transfected U251-MG (A) and U87-MG GB (B) cell lines 2 h after a single exposure to 4 Gy- or 16 Gy-irradiation at 3% oxygen. Tail moment, corresponding to %DNA in tail multiplied by length of tail, is represented in left graph while length of tail is represented in right graph (A and B). Results are expressed as mean ± SEM (n = 7). Then, in same condition, western blotting was performed to evaluate γH2AX expression in U251-MG (C) and U87-MG cells (D) and results are expressed as mean ± SEM (n = 4–7). One-way ANOVA with multiple comparisons (each group was compared to their own normalized control) was performed between Control vs. irradiated cells (*, p-value ≤ 0.05; **, p-value ≤ 0.01; ***, p-value ≤ 0.001; ****, p-value ≤ 0.0001)
Fig. 7
Fig. 7
Intracellular iron in CP-modulated cells post-IR. Intracellular free iron (A and B), intracellular total iron (C and D) and free/total iron ratio (E and F) were measured, using ICP-MS, in stable transfected U251-MG (A, C and E) and U87-MG GB (B, D and F) cell lines 2 and 48 h after a single exposure to 16 Gy-irradiation at 3% oxygen. Iron is expressed in µg/g of protein and as mean ± SEM (n = 2)
Fig. 8
Fig. 8
CP as an intracellular potentiator of radiation responses in GB cells. The manipulation of CP expression in GB lines impacts both cell survival and activation of DNA repair/damage machinery (γH2AX), together with the production of reactive oxygen species with more superoxide anion, more SOD1 synthesis and more cellular Fe2+ when intracellular CP is present at high levels. These observations reemphasized also the role of Fenton's reaction tightly involved in the production of ROS by GB cells which might be one of the major link between intracellular CP levels and GB cell responses/survival to radiation. Hence, “GB prepared cells” under-expressing CP and “GB adapter cells” that naturally down regulate CP survive better to radiations thus providing a role for CP in the radio-resistance/radio-sensitiveness balance of GB cells

Similar articles

Cited by

References

    1. Louis DN, et al. The 2021 WHO Classification of Tumors of the Central Nervous System: a summary. Neuro-Oncol. 2021;23:1231–1251. doi: 10.1093/neuonc/noab106. - DOI - PMC - PubMed
    1. Stupp R, et al. Radiotherapy plus concomitant and adjuvant temozolomide for glioblastoma. N Engl J Med. 2005;352:987–996. doi: 10.1056/NEJMoa043330. - DOI - PubMed
    1. Stupp R, et al. Effects of radiotherapy with concomitant and adjuvant temozolomide versus radiotherapy alone on survival in glioblastoma in a randomised phase III study: 5-year analysis of the EORTC-NCIC trial. Lancet Oncol. 2009;10:459–466. doi: 10.1016/S1470-2045(09)70025-7. - DOI - PubMed
    1. Torti SV, Torti FM. Iron: The cancer connection. Mol. Aspects Med. 2020;75:100860. 10.1016/j.mam.2020.100860. - PMC - PubMed
    1. Yu Y, Kovacevic Z, Richardson DR. Tuning cell cycle regulation with an iron key. Cell Cycle Georget Tex. 2007;6:1982–1994. doi: 10.4161/cc.6.16.4603. - DOI - PubMed