. 2022 Aug 2;20(1):171.
doi: 10.1186/s12915-022-01375-3.

Hmga2 protein loss alters nuclear envelope and 3D chromatin structure

Affiliations

Hmga2 protein loss alters nuclear envelope and 3D chromatin structure

Giuseppina Divisato et al. BMC Biol. .

Abstract

Background: The high-mobility group Hmga family of proteins are non-histone chromatin-interacting proteins which have been associated with a number of nuclear functions, including heterochromatin formation, replication, recombination, DNA repair, transcription, and formation of enhanceosomes. Due to its role based on dynamic interaction with chromatin, Hmga2 has a pathogenic role in diverse tumors and has been mainly studied in a cancer context; however, whether Hmga2 has similar physiological functions in normal cells remains less explored. Hmga2 was additionally shown to be required during the exit of embryonic stem cells (ESCs) from the ground state of pluripotency, to allow their transition into epiblast-like cells (EpiLCs), and here, we use that system to gain further understanding of normal Hmga2 function.

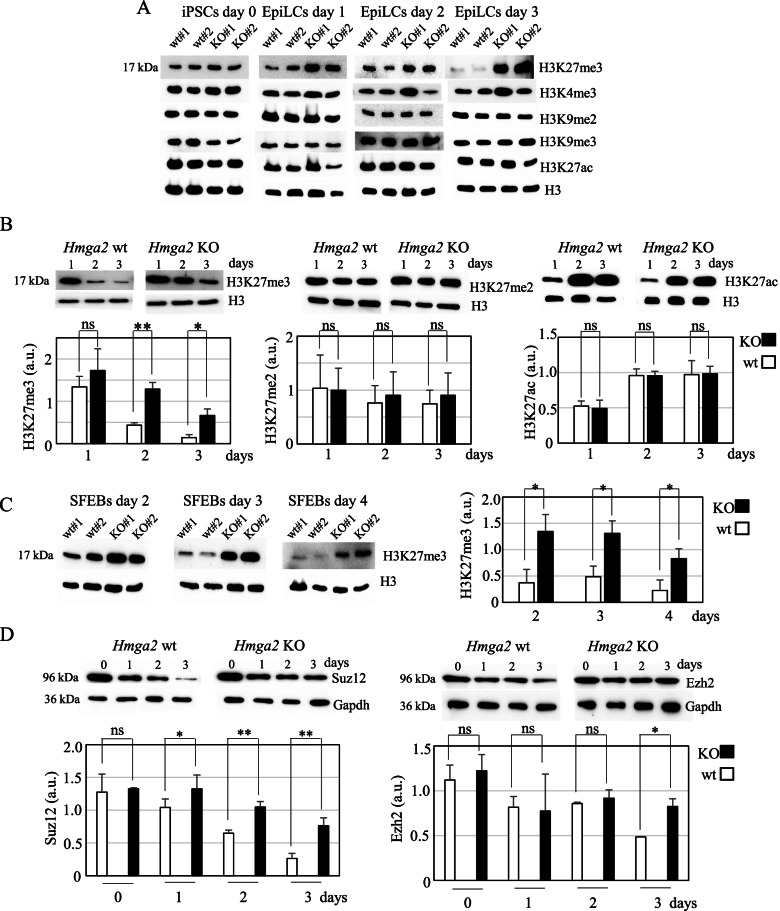
Results: We demonstrated that Hmga2 KO pluripotent stem cells fail to develop into EpiLCs. By using this experimental system, we studied the chromatin changes that take place upon the induction of EpiLCs and we observed that the loss of Hmga2 affects the histone mark H3K27me3, whose levels are higher in Hmga2 KO cells. Accordingly, a sustained expression of polycomb repressive complex 2 (PRC2), responsible for H3K27me3 deposition, was observed in KO cells. However, gene expression differences between differentiating wt vs Hmga2 KO cells did not show any significant enrichments of PRC2 targets. Similarly, endogenous Hmga2 association to chromatin in epiblast stem cells did not show any clear relationships with gene expression modification observed in Hmga2 KO. Hmga2 ChIP-seq confirmed that this protein preferentially binds to the chromatin regions associated with nuclear lamina. Starting from this observation, we demonstrated that nuclear lamina underwent severe alterations when Hmga2 KO or KD cells were induced to exit from the naïve state and this phenomenon is accompanied by a mislocalization of the heterochromatin mark H3K9me3 within the nucleus. As nuclear lamina (NL) is involved in the organization of 3D chromatin structure, we explored the possible effects of Hmga2 loss on this phenomenon. The analysis of Hi-C data in wt and Hmga2 KO cells allowed us to observe that inter-TAD (topologically associated domains) interactions in Hmga2 KO cells are different from those observed in wt cells. These differences clearly show a peculiar compartmentalization of inter-TAD interactions in chromatin regions associated or not to nuclear lamina.

Conclusions: Overall, our results indicate that Hmga2 interacts with heterochromatic lamin-associated domains, and highlight a role for Hmga2 in the crosstalk between chromatin and nuclear lamina, affecting the establishment of inter-TAD interactions.

Keywords: High mobility group proteins; Histone modifications; Lamin; Nuclear envelope; Pluripotent stem cells; Topologically associated domains.


Conflict of interest statement

The authors declare no competing interests.

Figures

Fig. 1
Fig. 1
Perturbation of H3K27me3 levels in Hmga2 wt and KO cells upon the induction of EpiLCs. A Western blotting images showing the levels of histone modifications (H3K27me3, H3K4me3, H3K9me2, H3K9me3, and H3K27ac) in wt and KO PSCs at day 0 (undifferentiated cells) and at three different times after the induction of the transition into EpiLCs (day 1, day 2, and day 3). The levels of the histone H3 were used as control. Two wt and two KO clones were used. Quantification and statistical analysis are reported in Additional file 1: Fig. S1B. B Western blotting and relative quantification graphs showing the levels of H3K27me3, H3K27me2, and H3K27ac during EpiLC establishment (time course experiments: days 1, 2, and 3) of wt and KO cells. C Western blotting images and relative quantification graph showing the levels of H3K27me3 in wt and KO PSCs during SFEB differentiation. D Western blotting images and relative quantification graph showing the levels of the PRC2 proteins Suz12 and Ezh2 during EpiLC establishment (time course experiments: days 1, 2, and 3) of wt and KO cells. The data in the graphs represent the mean ± SD (n=3 biological replicates) of H3K27me3, H3K27me2, and H3K27ac against total H3 (panels B and C) or of Suz12 and Ezh2 signal intensity against Gapdh expressed as arbitrary units (a.u.). Student’s t-test, two tailed (ns: not significant, *p<0.05, **p<0.01)
Fig. 2
Fig. 2
Hmga2 association with chromatin. A Comparison of the expression profiles of wt and Hmga2 KO cells induced to differentiate into EpiLCs. The profiles of the two cell types are similar (see also Additional file 2: Table S1) with some differences indicated in the Venn diagram. The heatmap shows the 2634 genes with a common behavior in the three cell clones, according to the Venn diagram. B DNA sequence motifs in the regions of the peaks of Chip-seq experiment with chromatin from wt EpiSC, immunoprecipitated with the anti-Hmga2 antibody and analyzed by MEME-chip software with default options. The three consensus sequences emerging from the analysis are shown. C Venn diagram of the alignment between Hmga2 peaks and those of chromatin markers H3K4me1 (GSM1382217 from ref. [19]) and H3K27ac (GSM1382219 from ref. [19]). D ChIP-seq data of Hmga2 in wt EpiSCs were aligned with available data of DamID in mouse ESCs (ref. [20], GSE17051). The results show a significantly overlap with the regions associated with Lamin b1 (about 51% Spearman correlation). The image shows a 196 Mb region of chromosome 1
Fig. 3
Fig. 3
Hmga2 suppression causes a remarkable distortion of the nuclear lamina. A Lmnb1 immunofluorescence (red) on Hmga2 wt and KO cells at day 1 of EpiLC induction, showing the distortion of the NL in Hmga2 KO cells. Maximum projection of z-slices (ROI 1024×1024) is shown; quantification graphs obtained by counting >200 nuclei/condition. B Representative images (single Z-plane, ROI 1024×1024) of the nuclear abnormalities (nuclear protrusions and nuclear blebbing) observed in Hmga2 KO cells at day 1 of EpiLC induction and absent in wt cells; quantification graphs obtained by counting >200 nuclei/condition. C Three-dimensional analysis of z-slices maximum projections showing the distortion of Lmnb1 (red) as well as the reduced porosity (grey dots inside the NL) detected in Hmga2 KO cells compared to the wild-type ones. Scale bar= 10 μm. D Lmnb1 immunofluorescence (red) on Hmga2 KD ESCs induced into EpiLCs (day 3) showing an evident distortion of the NL, with some enlarged and wrinkly nuclei. Non-silencing siRNA was used as control. Quantification graphs obtained by counting >400 nuclei/condition. E Lmnb1 immunofluorescence on Hmga2 KD cells showing the nuclear abnormalities (nuclear blebbing, enlarged nuclei) typical of cells devoid of Hmga2. DAPI (blue) was used to counterstain the nuclei. A single plane of the z-stack projection is shown. Scale bars of A, B, D, and E = 50 μm. Error bars represent standard deviation. Statistical significance on three biological replicate experiments was determined using Student’s t-test (ns: not significant, *p<0.05, **p<0.01)
Fig. 4
Fig. 4
Hmga2 silencing induced a phenotype identical to that observed in Hmga2 KO cells. A Lmnb1 (red) and Emerin (green) immunofluorescence on Hmga2 wt and KO cells (day 1 of EpiLC induction) showing the nuclear abnormalities typical of Hmga2 KO cells (single z-plane, ROI 1024×1024, scale bar= 50μm). Quantification graphs obtained by counting >150 nuclei/condition. B Lmnb1 (red) and Emerin (green) immunofluorescence at day 3 after the induction of EpiLCs upon Hmga2 silencing. Nuclear blebbing and enlarged nuclei were surrounded by both Lmnb1 and Emerin. DAPI (blue) was used to counterstain the nuclei. A single plane of the z-stack projection is shown. Scale bar= 50 μm. Quantification graphs obtained by counting >300 nuclei/condition. Error bars represent standard deviation. Statistical significance on three biological replicate experiments was determined using Student’s t-test (***p<0.001)
Fig. 5
Fig. 5
Mislocalization of H3K9me3 histone mark in Hmga2 KO and KD cells upon EpiLC induction. A Immunoflurescence experiments on Hmga2 wt and KO cells at day 1 after the induction of EpiLCs of Lmnb1 (red) and H3K9me3 (green). B Lmnb1 (red) and H3K9me3 (green) immunofluorescence on Hmga2 KD cells (day 3 after the induction). Non-silencing siRNA was used as control. In all immunofluorescence experiments, DAPI (blue) was used to counterstain the nuclei. All pictures are shown as single z-plane, ROI 1024×1024, scale bar= 50μm. Quantification graphs show the percentage of Hmga2 wt and KO cells with H3K9me3 mislocalization (n≥200 nuclei per condition) and the percentage of Hmga2 KD cells showing H3K9me3 mis-localization (n≥ 300 nuclei per condition). The count for Hmga2 wt and KO cells was performed at day 1 of differentiation, while the count for of Hmga2 KD cells was performed at day 3 of EpiLC transition, on three biological replicates for each condition. Error bars represent standard deviation. Statistical significance was determined using Student’s t-test (ns: not significant, ***p<0.001)
Fig. 6
Fig. 6
3D genome structure in wt and Hmga2 KO cells. A Left: Genome-wide Hi-C data in wt and Hmga2 KO conditions at 5Mb resolution, right: Hi-C data of chromosome 11 in both conditions at 250Kb resolution. B Hi-C maps in the region chr11:105000000-116000000, 25-Kb resolution. Insulation score and boundaries are reported below. C Overlap between boundaries (detected at 50kb resolution) in wt and Hmga2 KO for chromosome 11. D Enrichment in WT of H3K4me3, H3K27me3, and Hmga2 (normalized) at TAD boundaries, shaded area represents the standard error of each point
Fig. 7
Fig. 7
Hmga2 KO alters inter-TAD interactions and their association with nuclear lamina. A The computational approach to analyze the effects of Hmga2 KO on inter-TAD interactions was to calculate the Log fold change between the interactions between TADs in wt and Hmga2 KO. B Fold changes between all TAD pairs were calculated for each chromosome; the graph reports the distribution of inter-TAD interactions in chromosome 1, showing that there are numerous interactions that are decreased or increased in Hmga2 KO cells compared to wt cells. C Genome-wide enrichment of DamID signal [33] in TAD pairs exhibiting the most prominent interaction change

Similar articles

Cited by

References

    1. Ozturk N, Singh I, Mehta A, Braun T, Barreto G. HMGA proteins as modulators of chromatin structure during transcriptional activation. Front Cell Dev Biol. 2014;2:5. doi: 10.3389/fcell.2014.00005. - DOI - PMC - PubMed
    1. Reeves R. Nuclear functions of the HMG proteins. Biochim Biophys Acta Gene Regul Mech. 1799;2010:3–14. - PMC - PubMed
    1. Zhou X, Benson KF, Ashar HR, Chada K. Mutation responsible for the mouse pygmy phenotype in the developmentally regulated factor HMGI-C. Nature. 1995;376:771–774. doi: 10.1038/376771a0. - DOI - PubMed
    1. Li Z, Gilbert JA, Zhang Y, Zhang M, Qiu Q, Ramanujan K, et al. An HMGA2-IGF2BP2 axis regulates myoblast proliferation and myogenesis. Dev Cell. 2012;23:1176–1188. doi: 10.1016/j.devcel.2012.10.019. - DOI - PMC - PubMed
    1. Federico A, Forzati F, Esposito F, Arra C, Palma G, Barbieri A, et al. Hmga1/Hmga2 double knock-out mice display a “superpygmy” phenotype. Biol Open. 2014;3:372–378. doi: 10.1242/bio.20146759. - DOI - PMC - PubMed

Publication types

MeSH terms