

Identification of stage-related and severity-related biomarkers and exploration of immune landscape for Dengue by comprehensive analyses
- PMID: 35918744
- PMCID: PMC9344228
- DOI: 10.1186/s12985-022-01853-8
Identification of stage-related and severity-related biomarkers and exploration of immune landscape for Dengue by comprehensive analyses
Abstract
Background: At present, there are still no specific therapeutic drugs and appropriate vaccines for Dengue. Therefore, it is important to explore distinct clinical diagnostic indicators.
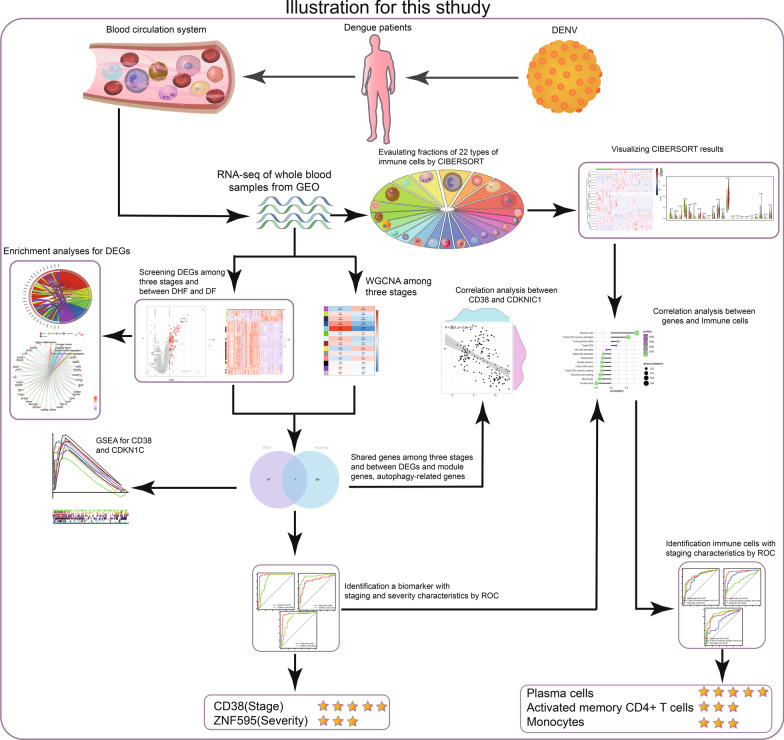
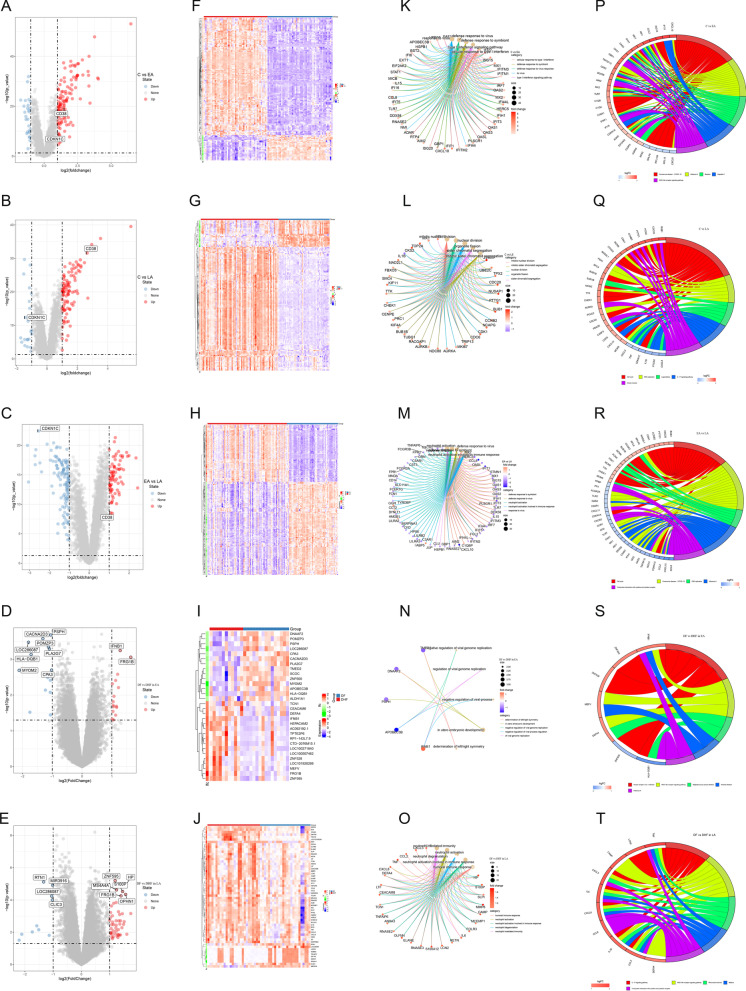
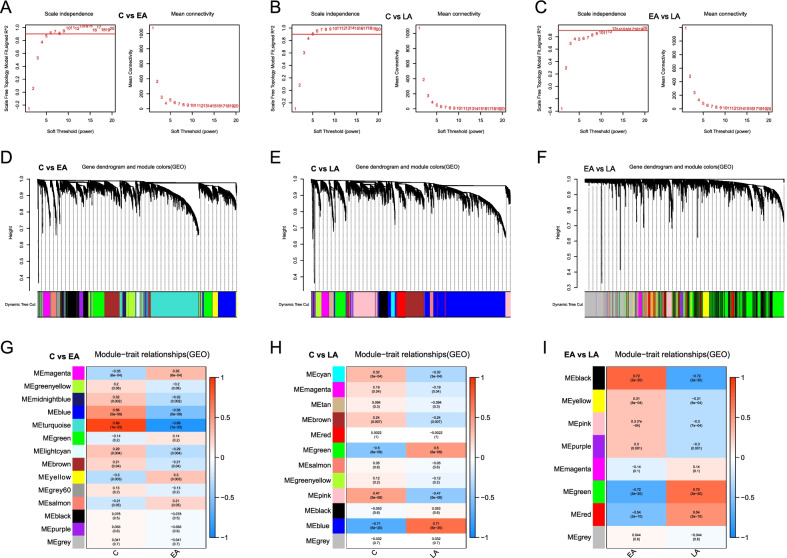
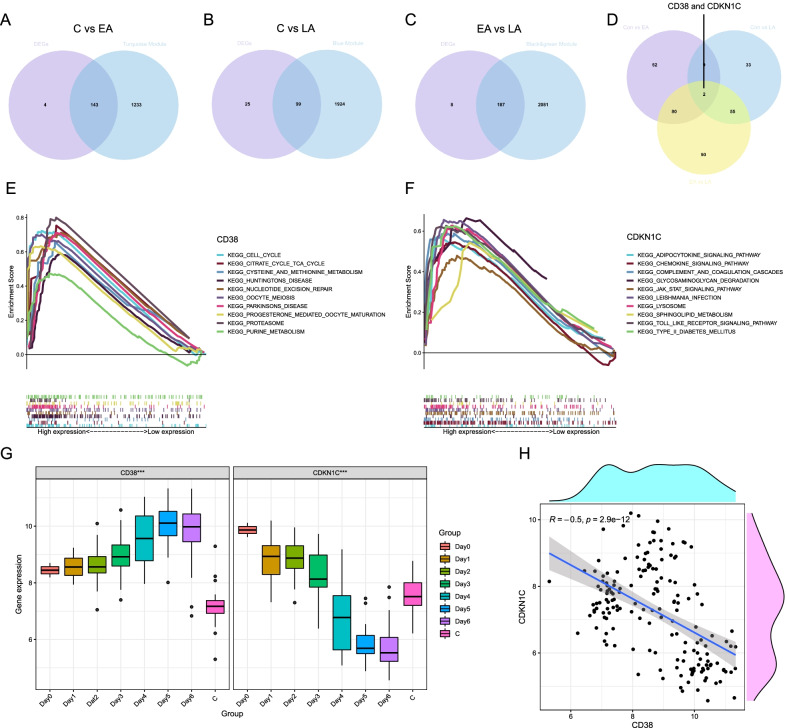
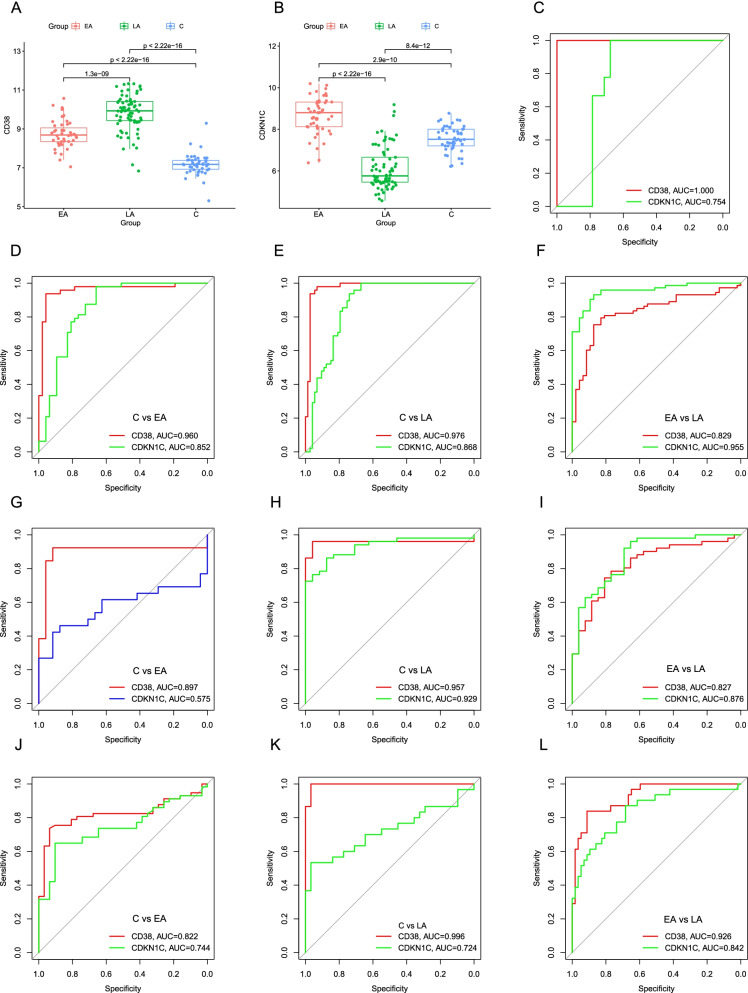
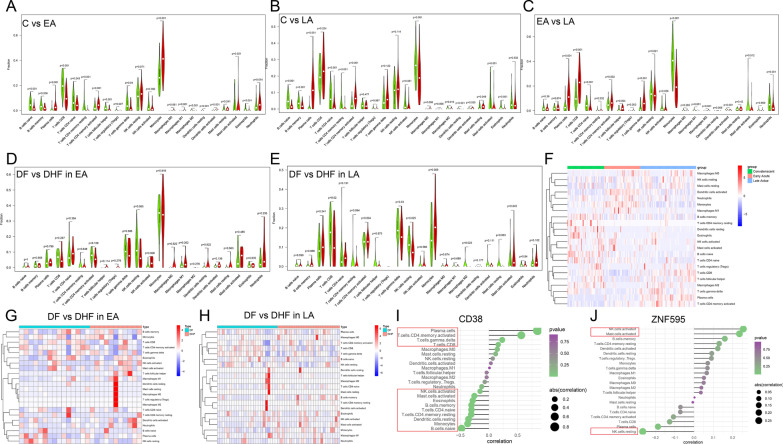
Methods: In this study, we combined differentially expressed genes (DEGs) analysis, weighted co-expression network analysis (WGCNA) and Receiver Operator Characteristic Curve (ROC) to screen a stable and robust biomarker with diagnosis value for Dengue patients. CIBERSORT was used to evaluate immune landscape of Dengue patients. Gene Ontology (GO) enrichment, Kyoto Encyclopedia of Genes and Genomes (KEGG) analysis and Gene set enrichment analysis (GSEA) were applied to explore potential functions of hub genes.
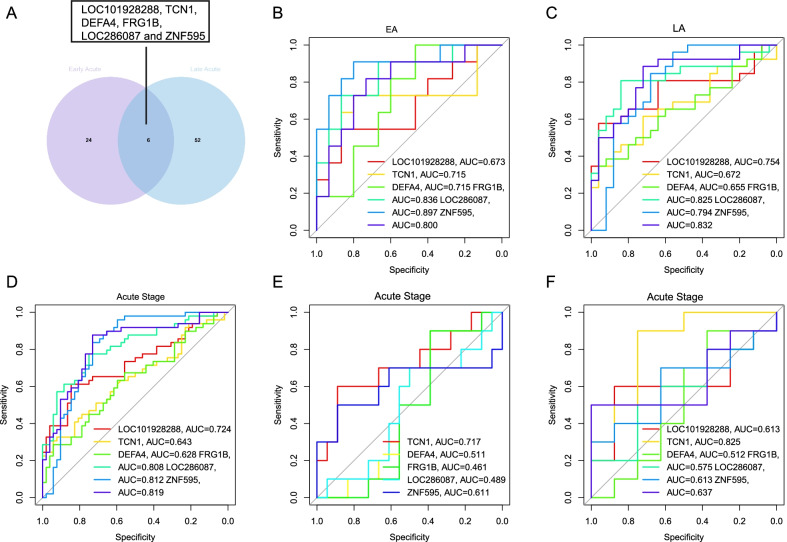
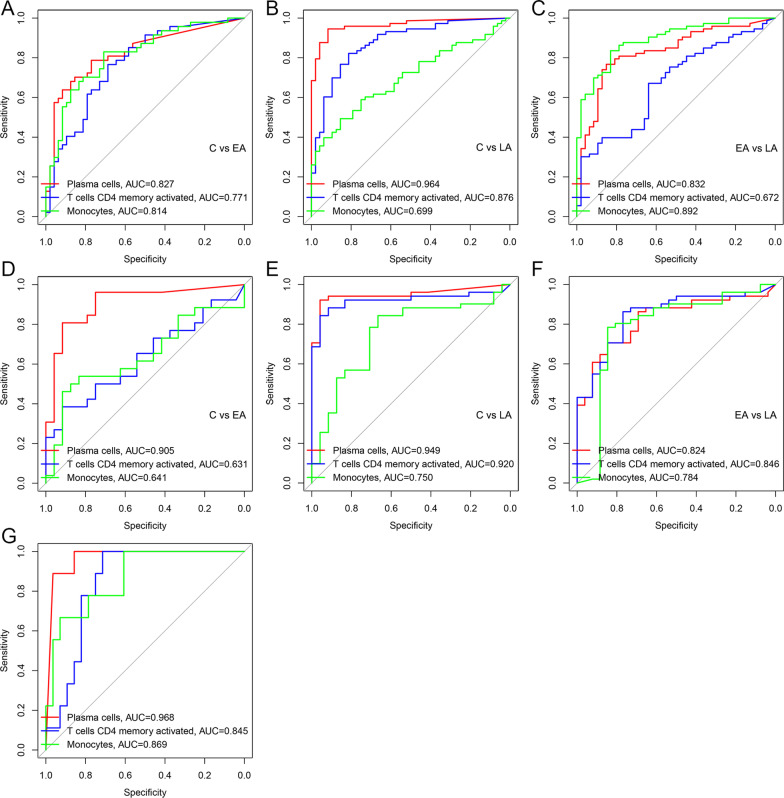
Results: CD38 and Plasma cells have excellent Area Under the Curve (AUC) in distinguishing clinical stages for Dengue patients, and activated memory CD4+ T cells and Monocytes have good AUC for this function. ZNF595 has acceptable AUC in discriminating dengue hemorrhagic fever (DHF) from dengue fever (DF) in whole acute stages. Analyzing any serotype, we can obtain consistent results. Negative inhibition of viral replication based on GO, KEGG and GSEA analysis results, up-regulated autophagy genes and the impairing immune system are potential reasons resulting in DHF.
Conclusions: CD38, Plasma cells, activated memory CD4+ T cells and Monocytes can be used to distinguish clinical stages for dengue patients, and ZNF595 can be used to discriminate DHF from DF, regardless of serotypes.
Keywords: Autophagy; CD38; DH; DHF; ZNF595.
© 2022. The Author(s).
Conflict of interest statement
The authors declare that they have no competing interests.
Figures
Similar articles
-
Genome-wide profiling of mRNA and lncRNA expression in dengue fever and dengue hemorrhagic fever.FEBS Open Bio. 2019 Feb 2;9(3):468-477. doi: 10.1002/2211-5463.12576. eCollection 2019 Mar. FEBS Open Bio. 2019. PMID: 30868055 Free PMC article.
-
Quantitation of T lymphocyte subsets helps to distinguish dengue hemorrhagic fever from classic dengue fever during the acute febrile stage.Southeast Asian J Trop Med Public Health. 1999 Dec;30(4):710-7. Southeast Asian J Trop Med Public Health. 1999. PMID: 10928365
-
Dysregulation and imbalance of innate and adaptive immunity are involved in the cardiomyopathy progression.Front Cardiovasc Med. 2022 Sep 6;9:973279. doi: 10.3389/fcvm.2022.973279. eCollection 2022. Front Cardiovasc Med. 2022. PMID: 36148059 Free PMC article.
-
Dengue hemorrhagic fever - A systemic literature review of current perspectives on pathogenesis, prevention and control.J Microbiol Immunol Infect. 2020 Dec;53(6):963-978. doi: 10.1016/j.jmii.2020.03.007. Epub 2020 Mar 26. J Microbiol Immunol Infect. 2020. PMID: 32265181
-
The pathology of dengue hemorrhagic fever.Semin Diagn Pathol. 2007 Nov;24(4):227-36. doi: 10.1053/j.semdp.2007.07.002. Semin Diagn Pathol. 2007. PMID: 18085063 Review.
Cited by
-
Comprehensive analysis of intervention and control studies for the computational identification of dengue biomarker genes.PLoS Negl Trop Dis. 2025 Mar 18;19(3):e0012914. doi: 10.1371/journal.pntd.0012914. eCollection 2025 Mar. PLoS Negl Trop Dis. 2025. PMID: 40100920 Free PMC article.
References
-
- Zhang J, Shu Y, Shan X, Li D, Ma D, Li T, Long S, Wang X, Pan Y, Chen J, et al. Co-circulation of three dengue virus serotypes led to a severe dengue outbreak in Xishuangbanna, a border area of China, Myanmar, and Laos, in 2019. Int J Infect Dis. 2021;107:15–17. doi: 10.1016/j.ijid.2021.04.010. - DOI - PubMed
Publication types
MeSH terms
Substances
LinkOut - more resources
Full Text Sources
Medical
Research Materials
Miscellaneous
