. 2022 Aug 3;42(1):25.
doi: 10.1186/s41232-022-00209-7.

Targeting microglial autophagic degradation of the NLRP3 inflammasome for identification of thonningianin A in Alzheimer's disease

Affiliations

Targeting microglial autophagic degradation of the NLRP3 inflammasome for identification of thonningianin A in Alzheimer's disease

Xiao-Gang Zhou et al. Inflamm Regen. .

Abstract

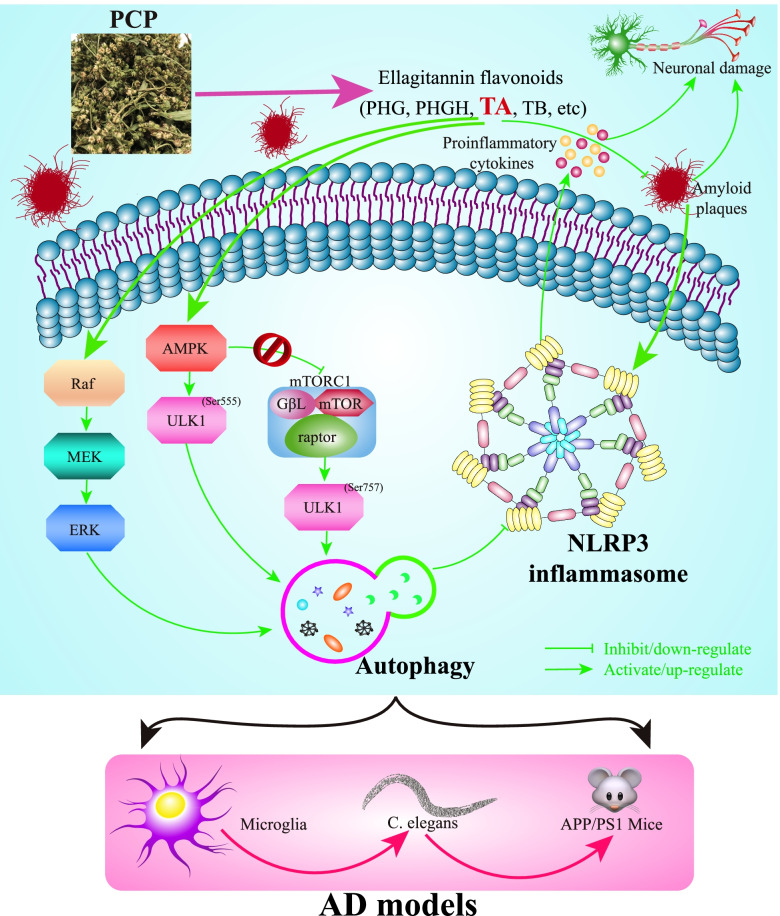
Background: NLRP3 inflammasome-mediated neuroinflammation plays a critical role in the pathogenesis and development of Alzheimer's disease (AD). Microglial autophagic degradation not only decreases the deposits of extracellular Aβ fibrils but also inhibits the activation of NRLP3 inflammasome. Here, we aimed to identify the potent autophagy enhancers from Penthorum chinense Pursh (PCP) that alleviate the pathology of AD via inhibiting the NLRP3 inflammasome.

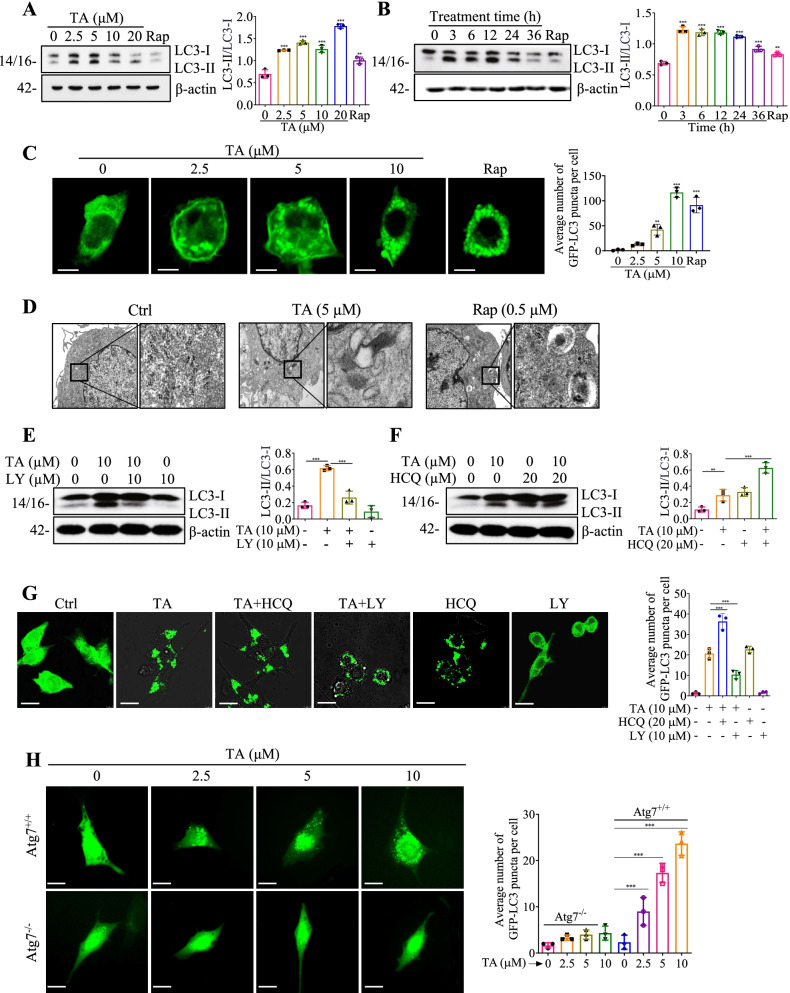
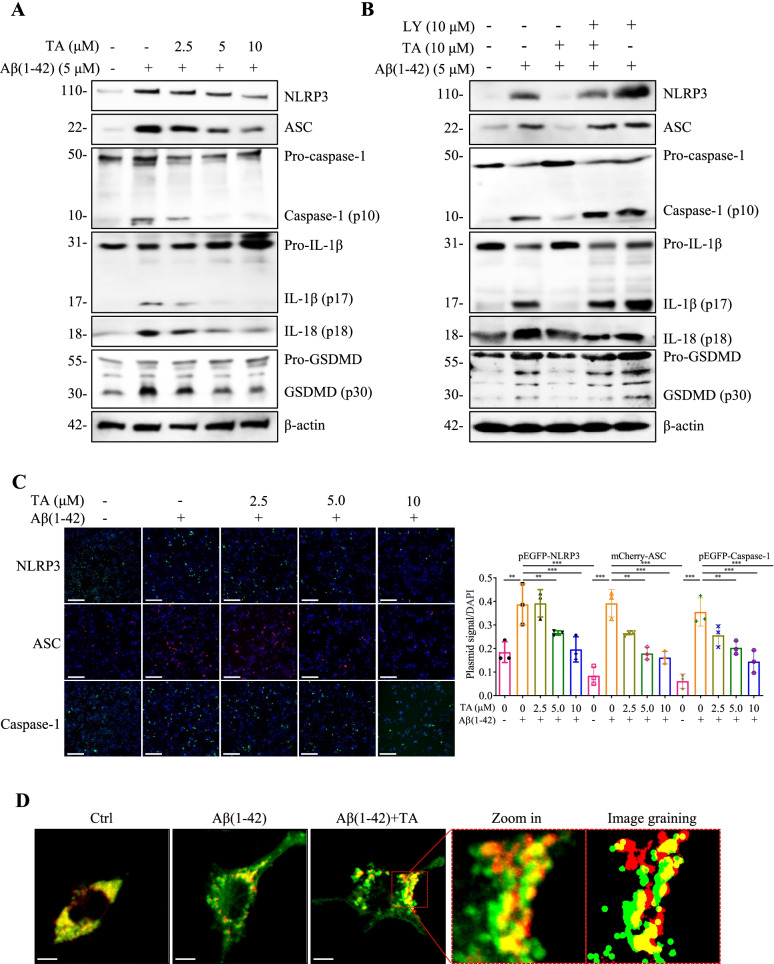
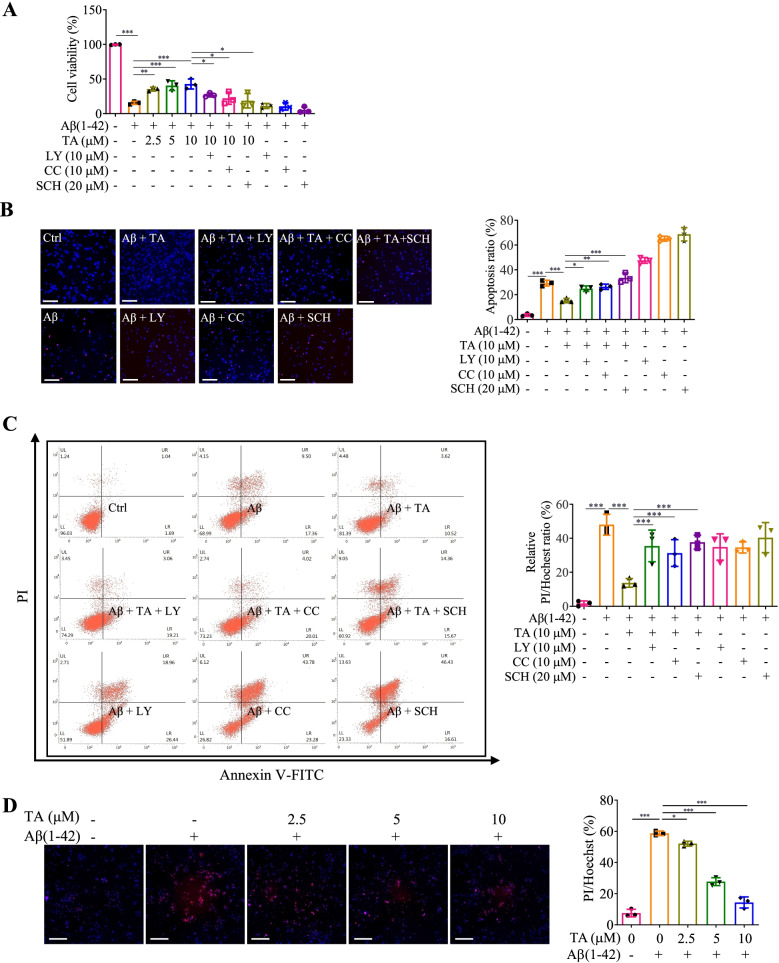
Methods: At first, autophagic activity-guided isolation was performed to identify the autophagy enhancers in PCP. Secondly, the autophagy effect was monitored by detecting LC3 protein expression using Western blotting and the average number of GFP-LC3 puncta per microglial cell using confocal microscopy. Then, the activation of NLRP3 inflammasome was measured by detecting the protein expression and transfected fluorescence intensity of NLRP3, ASC, and caspase-1, as well as the secretion of proinflammatory cytokines. Finally, the behavioral performance was evaluated by measuring the paralysis in C. elegans, and the cognitive function was tested by Morris water maze (MWM) in APP/PS1 mice.

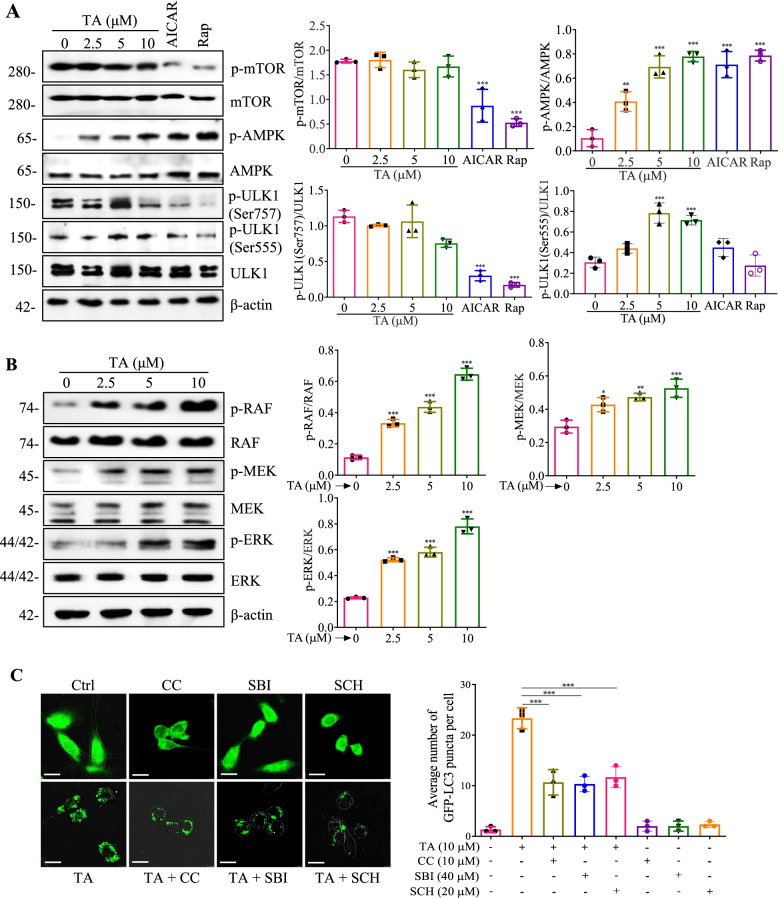
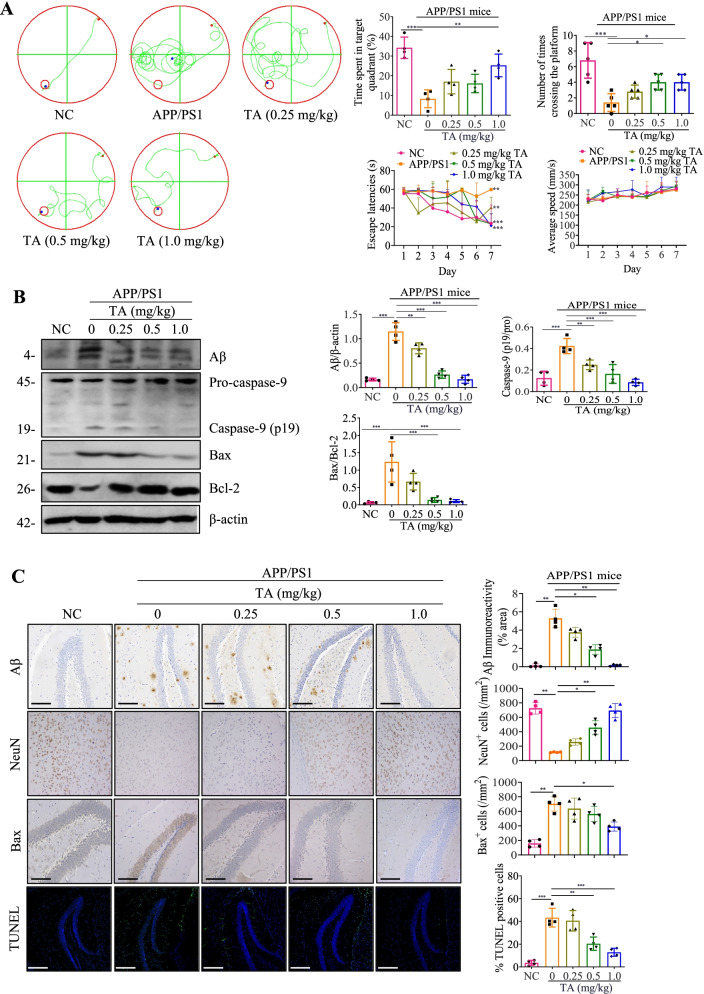
Results: Four ellagitannin flavonoids, including pinocembrin-7-O-[4″,6″-hexahydroxydiphenoyl]-glucoside (PHG), pinocembrin-7-O-[3″-O-galloyl-4″,6″-hexahydroxydiphenoyl]-glucoside (PGHG), thonningianin A (TA), and thonningianin B (TB), were identified to be autophagy enhancers in PCP. Among these, TA exhibited the strongest autophagy induction effect, and the mechanistic study demonstrated that TA activated autophagy via the AMPK/ULK1 and Raf/MEK/ERK signaling pathways. In addition, TA effectively promoted the autophagic degradation of NLRP3 inflammasome in Aβ(1-42)-induced microglial cells and ameliorated neuronal damage via autophagy induction. In vivo, TA activated autophagy and improved behavioral symptoms in C. elegans. Furthermore, TA might penetrate the blood-brain barrier and could improve cognitive function and ameliorate the Aβ pathology and the NLRP3 inflammasome-mediated neuroinflammation via the AMPK/ULK1 and Raf/MEK/ERK signaling pathways in APP/PS1 mice.

Conclusion: We identified TA as a potent microglial autophagy enhancer in PCP that promotes the autophagic degradation of the NLRP3 inflammasome to alleviate the pathology of AD via the AMPK/ULK1 and Raf/MEK/ERK signaling pathways, which provides novel insights for TA in the treatment of AD.

Keywords: AMPK/ULK1; Alzheimer’s disease; Autophagy; NLRP3 inflammasome; Raf/MEK/ERK; Thonningianin A.


Conflict of interest statement

The authors declare that they have no competing interests.

Figures

Fig. 1
Fig. 1
TA induces autophagy flux in microglial cells. A, B LC3 expressions of BV-2 cells treated with the indicated concentration of TA for 24 h or treated with 10 μM of TA for the indicated hours, and 0.5 μM rapamycin (Rap) was set as a positive autophagy inducer. Bar charts indicate the ratios of LC3-II/LC3-I. C Representative fluorescence images of mouse primary microglial cells transfected with GFP-LC3 plasmid and treated with TA or Rap for 24 h were captured. Magnification, × 63; scale bar: 25 μm. D Representative electron micrographs showing the ultrastructures of BV-2 cells which were treated with TA (5 μM), or Rap (0.5 μM) for 24 h. Left: Magnification: × 10000, scale bar: 2 μm; Right: Magnification: × 250000, scale bar: 500 nm. E, F LC3 expressions of BV-2 cells were pretreated with LY (10 μM) or HCQ (20 μM) for 1 h, followed by treatment with TA (10 μM) for an additional 24 h. Bar charts indicate the ratios of LC3-II/LC3-I in BV-2 cells. G Representative fluorescence images of BV-2 cells transfected with GFP-LC3 plasmid and pretreated with LY (10 μM) or HCQ (20 μM) for 1 h, followed by treatment with TA (10 μM) for an additional 24 h. Magnification, × 40; scale bar: 50 μm. The bar chart represents the average number of GFP-LC3 puncta per cell. H Representative fluorescence images of Atg7+/+ and Atg7−/− MEF cells transfected with GFP-LC3 plasmid and treated with 2.5, 5, and 10 μM of TA for 24 h were captured. Magnification, × 40; scale bar: 50 μm. The bar chart represents the average number of GFP-LC3 puncta per cell. Error bars, S.D. *p ≤ 0.05; **p ≤ 0.01; ***p ≤ 0.001, n = 3. (One-way ANOVA with Tukey-corrected post hoc t-test for multiple comparisons was applied for comparison between groups). The full-length blots are presented in Additional file 1: Fig. S19
Fig. 2
Fig. 2
TA induces autophagy via activating the AMPK/ULK1 and Raf/MEK/ERK signaling pathways. A BV-2 cells were treated with 2.5, 5, and 10 μM of TA, AICAR (1 mM), or Rap (0.5 μM) for 24 h. Then protein expressions were detected using Western blot. Bar charts indicate the ratios of p-mTOR/mTOR, p-AMPK/AMPK, p-ULK1 (Ser757)/ULK1, and p-ULK1 (Ser555)/ULK1 in BV-2 cells. B BV-2 cells were treated with TA at indicated concentrations for 24 h. Then protein expressions were detected using Western blot. Bar charts indicate the ratios of p-Raf/Raf, p-MEK/MEK, and p-ERK/ERK in BV-2 cells. C Representative fluorescence images of BV-2 cells transfected with GFP-LC3 plasmid and pretreated with CC (10 μM) or SBI (40 μM) or SCH (20 μM) for 1 h, followed by treatment with TA (10 μM) for an additional 24 h were captured. Magnification, × 40; scale bar: 50 μm. Bar charts represent the average number of GFP-LC3 puncta per cell. Error bars, S.D. *p ≤ 0.05; **p ≤ 0.01; ***p ≤ 0.001, n=3. (One-way ANOVA with Tukey-corrected post hoc t-tests for multiple comparisons was applied for comparison between groups). The full-length blots are presented in Additional file 1: Fig. S20
Fig. 3
Fig. 3
TA inhibits Aβ(1–42)-induced activation of the NLRP3 inflammasome via autophagy induction. A BV-2 cells were pretreated with 5 μM of Aβ(1–42) for 12 h, followed by treatment with TA at the indicated concentrations for an additional 24 h. Protein expressions were detected using Western blot. Bar charts indicate the ratios of NLRP3/β-actin, ASC/β-actin, caspase-1 (p10)/pro-caspase-1, IL-1β (p17)/pro-IL-1β, IL-18 (p18)/pro-IL-18, and GSDMD (p30)/pro-GSDMD in BV-2 cells. B BV-2 cells were pretreated with 5 μM of Aβ(1–42) for 12 h, followed by the treatment of TA (10 μM) in the presence or absence of LY (10 μM) for an additional 24 h. Protein expressions were detected using the Western blot. The bar chart indicates the ratios of NLRP3/β-actin, ASC/β-actin, caspase-1 (p10)/pro-caspase-1, IL-1β (p17)/pro-IL-1β, IL-18 (p18)/pro-IL-18, and GSDMD (p30)/pro-GSDMD in BV-2 cells. C Representative images of BV-2 cells transfected with pEGFP-NLRP3, mCherry-ASC, or pEGFP-caspase-1 plasmid for 18–24 h and treated with Aβ(1–42) in the presence or absence of TA at the indicated concentrations for 24h, followed by DAPI staining were captured. Magnification, × 10; scale bar: 100 μm. The bar chart indicates the percentage of BV-2 cells with NLRP3, ASC, or caspase-1 signal. D BV-2 cells seeded on confocal petri dishes were transiently transfected with pmCherry-C1-ASC and GFP-LC3 plasmid for 24 h, followed by treatment with 5 μM of Aβ(1–42) with or without TA (10 μM) for 24 h. After treatment, the BV-2 cells were fixed and examined by a Leica SP8 confocal microscope with a LAS X 3D Visualization (Leica Microsystems Inc., Wetzlar, Germany). Representative images of BV-2 cells with co-localization of pmCherry-C1-ASC and GFP-LC3 puncta were captured, and the image graining was performed by the Leica SP8 processor. Magnification, × 63; scale bar: 25 μm. Error bars, S.D. *p ≤ 0.05; **p ≤ 0.01; ***p ≤ 0.001, n=6. (One-way ANOVA with Tukey-corrected post hoc t-tests for multiple comparisons was applied for comparison between groups). The full-length blots are presented in Additional file 1: Fig. S21, 22
Fig. 4
Fig. 4
TA inhibits Aβ(1–42)-induced activation of the NLRP3 inflammasome through the AMPK/ULK1- and Raf/MEK/ERK-mediated autophagy. A, B BV-2 cells were pretreated with 5 μM of Aβ (1–42) for 12 h, followed by the treatment of TA (10 μM) in the presence or absence of CC (10 μM) or SCH (20 μM) for an additional 24 h. Then protein expressions were detected using Western blot. Bar charts indicate the ratios of NLRP3/β-actin, ASC/β-actin, caspase-1 (p10)/pro-caspase-1, IL-1β (p17)/pro-IL-1β, IL-18 (p18)/pro-IL-18, and GSDMD (p30)/pro-GSDMD in BV-2 cells. B Error bars, S.D. *p ≤ 0.05; **p ≤ 0.01; ***p ≤ 0.001, n = 3. (One-way ANOVA with Tukey-corrected post hoc t-tests for multiple comparisons was applied for comparison between groups). The full-length blots are presented in Additional file 1: Fig. S23
Fig. 5
Fig. 5
TA ameliorates neuronal damage induced by the Aβ(1–42)-induced activation of the NLRP3 inflammasome in microglial cells. BV-2 cells were treated with 5 μM of Aβ(1–42) for 24 h, followed by the treatment of TA (10 μM) in the presence or absence of inhibitors, including LY, CC, and SCH for an additional 24 h. The conditioned mediums were then transferred into PC-12 cells and incubated for 24 h. The cell viability of PC12 cells was then detected by (A) MTT assay, (B) Hoechst 33342/PI staining, and (C) flow cytometry methods. Bar charts indicate the cell viability, the PI/Hoechst ratio, and the apoptosis rate of PC-12 cells. The representative fluorescence images were captured by a fluorescence microscope. Magnification, × 20; scale bar: 100 μm. D Mouse primary microglial cells were treated with 5 μM of Aβ(1–42) for 24 h, followed by the treatment of TA at the indicated concentrations for 24 h. The conditioned mediums were then transferred into mouse primary hippocampal neurons and incubated for 24 h. The cell viability of mouse primary hippocampal neurons was then detected by Hoechst 33342/PI staining method. The representative fluorescence images were captured by a fluorescence microscope. Magnification, × 20; scale bar: 100 μm. The bar chart indicates the PI/Hoechst ratio of mouse primary hippocampal neurons. Error bars, S.D. *p ≤ 0.05; **p ≤ 0.01; ***p ≤ 0.001. n = 3. (One-way ANOVA with Tukey-corrected post hoc t-test for multiple comparisons was applied for comparison between groups)
Fig. 6
Fig. 6
TA induces autophagy and exhibits a neuroprotective effect in C. elegans. A Representative images of BC12921 worms with GFP representing the expression of p62. Magnification, × 10; scale bar: 200 μm. The bar chart indicates the relative GFP intensity (n = 10). B The bar chart indicates the relative mRNA expression of p62 in worms (n = 10). C Representative images of DA2123 worms with GFP::LGG-1 puncta. Magnification, × 20; scale bar: 100 μm. Inset images displayed a higher magnification of the image in the dashed rectangle. The bar chart indicates the number of GFP::LGG-1 puncta in worms (n = 10). The results were pooled from three independent experiments. The full image of worms is presented in Additional file 1: Fig. S24. D The bar chart indicates the slowing rate of the N2 and BR5275 worms treated with or without TA (20 μM) (n = 60). E Representative images of CL2331 worms with GFP representing the amount of Aβ deposits. Magnification, × 10; scale bar: 200 μm. The bar chart indicates the number of Aβ deposits in the anterior area of worms (n = 10). F Representative images of CL4176 worms treated with TA (20 μM) in the presence or absence of unc-51 RNAi, bec-1 RNAi, or vps-34 RNAi bacteria were captured, and red arrows indicated the paralyzed worms. Magnification, × 10; scale bar: 200 μm. The bar chart indicates the percentage of paralyzed worms (n = 60). Error bars, S.D. **p ≤ 0.01; ***p ≤ 0.001. (One-way ANOVA with Tukey-corrected post hoc t-tests for multiple comparisons was applied for comparison between groups)
Fig. 7
Fig. 7
TA improves cognitive function and ameliorates the Aβ pathology and neuronal damage in APP/PS1 mice. A The cognitive function of NC and APP/PS1 mice was evaluated by the MWM test. Bar charts indicate the escape latencies, the ratio of time spent in the target quadrant/total time, the number of mice crossing the platform, and average swimming speed (n ≥ 4). B The Western blotting detection of the protein expressions of Aβ, caspase-9, Bax, and Bcl-2 in the brain tissues of NC and APP/PS1 mice. Bar charts indicate the ratios of Aβ/β-actin, caspase-9 (p19)/Pro, Bax/Bcl-2. The full-length blots are presented in Additional file 1: Fig. S25. C Representative immunohistochemistry and immunofluorescence staining images showing the expressions of Aβ, NeuN, Bax, and TUNEL-positive neurons in the hippocampus of NC and APP/PS1 mice. Magnification: × 20; scale bar: 100 μm. Bar charts indicate the quantification of Aβ, NeuN, Bax, and TUNEL-positive neurons (n = 4). Error bars, S.D. *p ≤ 0.05; **p ≤ 0.01; ***p ≤ 0.001, n = 4. (One-way ANOVA with Tukey-corrected post hoc t-tests for multiple comparisons was applied for comparison between groups)
Fig. 8
Fig. 8
TA inhibits the activation of NLRP3 inflammasome might via the AMPK/ULK1- and Raf/MEK/ERK-mediated autophagy in APP/PS1 mice. A The Western blotting detection of the protein expressions of LC3, NLRP3, caspase 1, and IL-1β in the brain tissues of NC and APP/PS1 mice. The bar chart indicates the ratios of LC3-II/β-actin, NLRP3/β-actin, caspase-1 (p10)/Pro, and IL-1β (p17)/Pro. B Representative immunohistochemistry and immunofluorescence staining images showing the expressions of NLRP3, TREM2, GFAP, LC3, and CD45 in the hippocampus of NC and APP/PS1 mice. Magnification: × 20; scale bar: 100 μm. Bar charts indicate the quantifications of NLRP3 expression, and the cells with TREM2+/DAPI+, GFAP+/DAPI+, and LC3+, CD45+, and the colocalization of LC3+ with CD45+ (n = 4). C The Western blotting detection of the protein expressions of p-AMPK, AMPK, p-ULK1(555), ULK1, p-RAF, RAF, p-MEK, MEK, p-ERK, ERK, and β-actin in the brain tissues of NC and APP/PS1 mice. The bar chart indicates the ratios of p-AMPK/AMPK, p-ULK1(555)/ULK1, p-RAF/RAF, p-MEK/MEK, p-ERK/ERK. Error bars, S.D., *p ≤ 0.05, **p ≤ 0.01, ***p ≤ 0.001. The full-length blots are presented in Additional file 1: Fig. S26
Fig. 9
Fig. 9
The schematic diagram depicts that TA, one of the ellagitannin flavonoids derived from PCP, inhibits the activation of the NLRP3 inflammasome via the AMPK/ULK1- and Raf/MEK/ERK-mediated autophagy in the in vitro and in vivo models of AD, including microglia, C. elegans, and APP/PS1 mice

Similar articles

Cited by

References

    1. Barrientos RM, Hein AM, Frank MG, Watkins LR, Maier SF. Intracisternal interleukin-1 receptor antagonist prevents postoperative cognitive decline and neuroinflammatory response in aged rats. J Neurosci. 2012;32(42):14641–14648. doi: 10.1523/JNEUROSCI.2173-12.2012. - DOI - PMC - PubMed
    1. Bussi C, Ramos JMP, Arroyo DS, Gaviglio EA, Gallea JI, Wang JM, et al. Autophagy down regulates pro-inflammatory mediators in BV2 microglial cells and rescues both LPS and alpha-synuclein induced neuronal cell death. Sci Rep. 2017;7:43153. - PMC - PubMed
    1. Cao YW, Jiang Y, Zhang DY, Wang M, Chen WS, Su H, Wang YT, Wan JB. Protective effects of Penthorum chinense Pursh against chronic ethanol-induced liver injury in mice. J Ethnopharmacol. 2015;161:92–98. doi: 10.1016/j.jep.2014.12.013. - DOI - PubMed
    1. Cao YW, Jiang Y, Zhang DY, Zhang XJ, Hu YJ, Li P, Su H, Wan JB. The hepatoprotective effect of aqueous extracts of Penthorum chinense Pursh against acute alcohol-induced liver injury is associated with ameliorating hepatic steatosis and reducing oxidative stress. Food Funct. 2015;6(5):1510–1517. doi: 10.1039/C5FO00098J. - DOI - PubMed
    1. Carson MJ, Thrash JC, Walter B. The cellular response in neuroinflammation: The role of leukocytes, microglia and astrocytes in neuronal death and survival. Clin Neurosci Res. 2006;6(5):237–245. doi: 10.1016/j.cnr.2006.09.004. - DOI - PMC - PubMed