. 2022 Nov 2;30(11):3414-3429.
doi: 10.1016/j.ymthe.2022.07.019. Epub 2022 Aug 1.

Dual role of deubiquitinating enzyme USP19 regulates mitotic progression and tumorigenesis by stabilizing survivin

Affiliations

Dual role of deubiquitinating enzyme USP19 regulates mitotic progression and tumorigenesis by stabilizing survivin

Arun Pandian Chandrasekaran et al. Mol Ther. .

Abstract

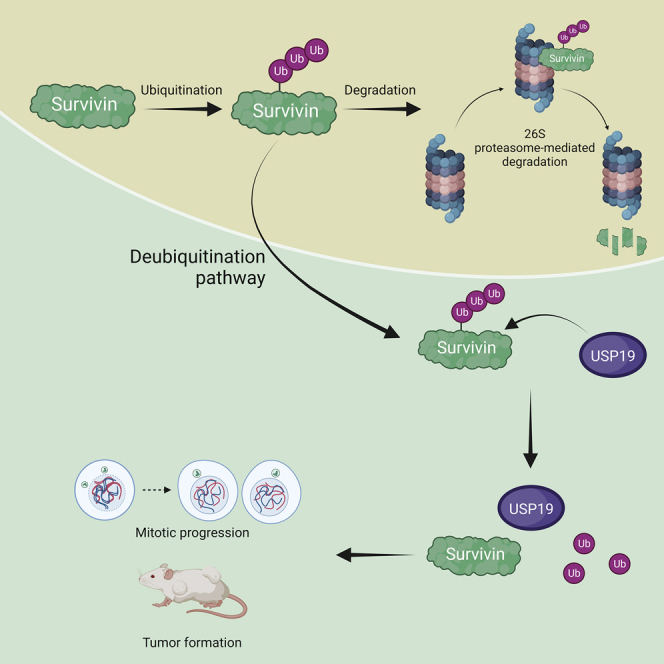
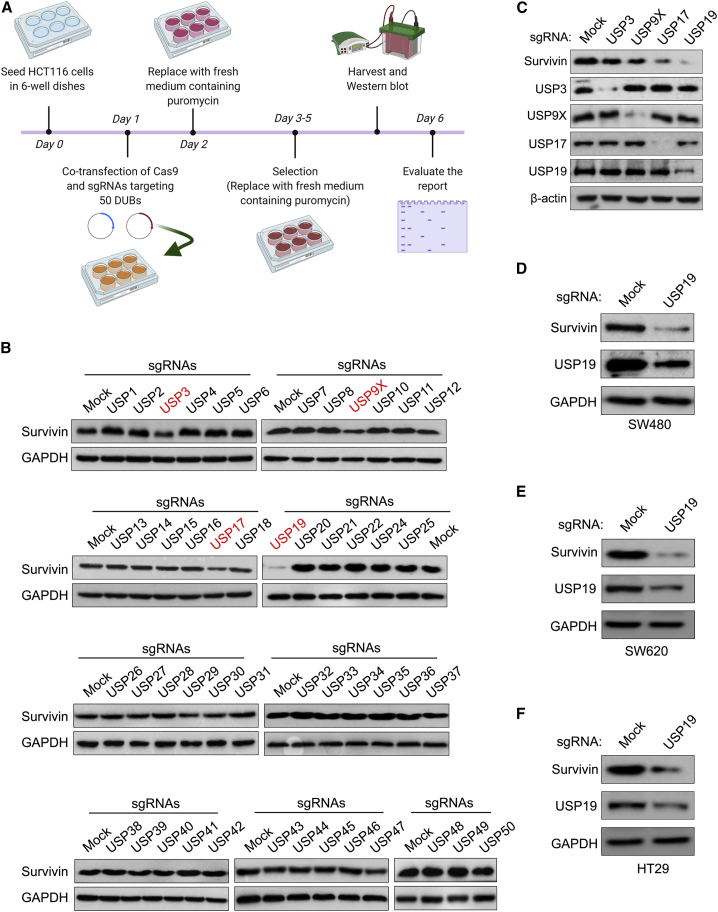
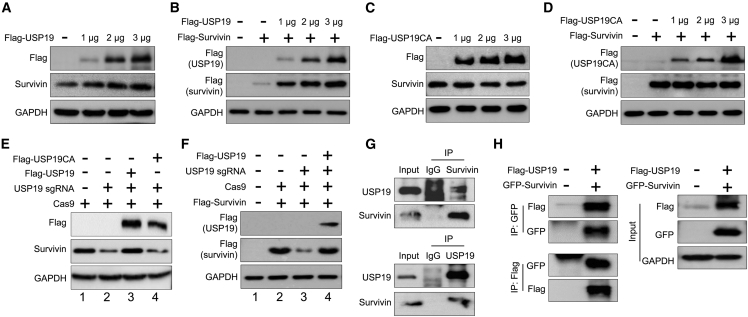
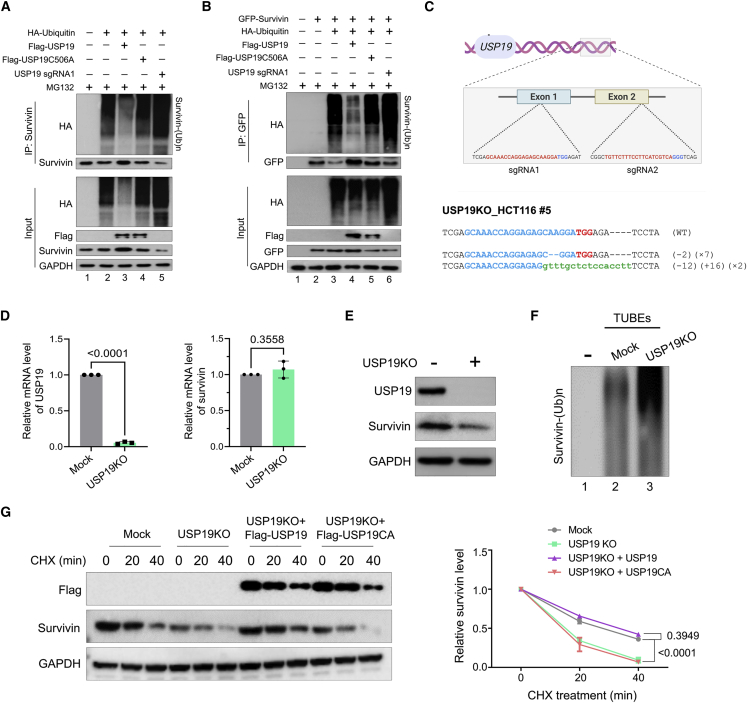
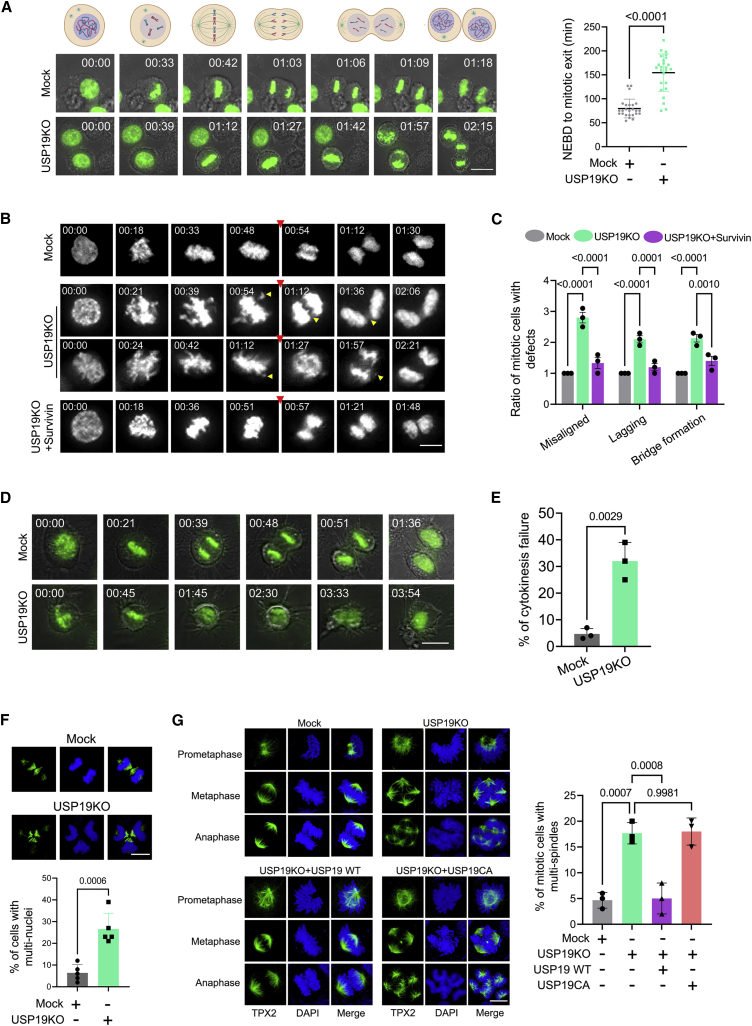
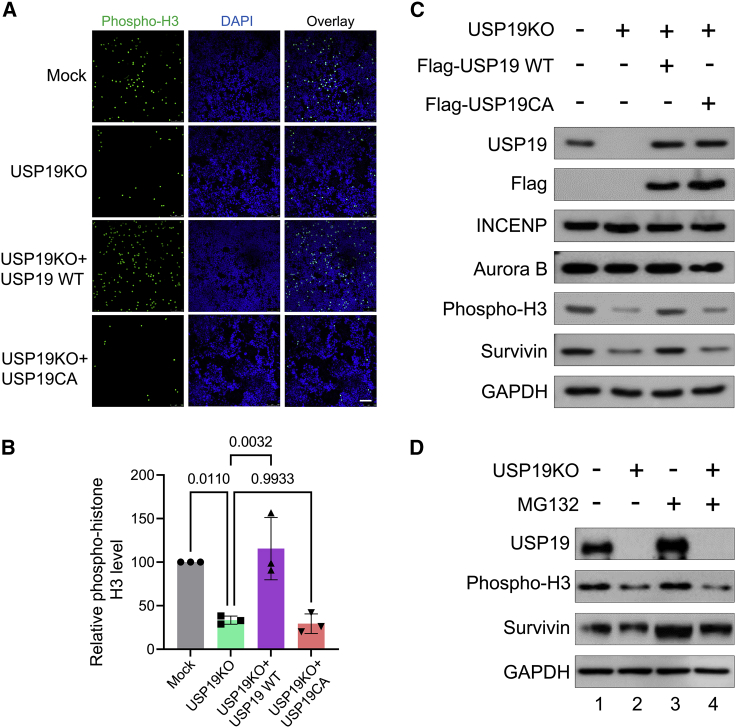
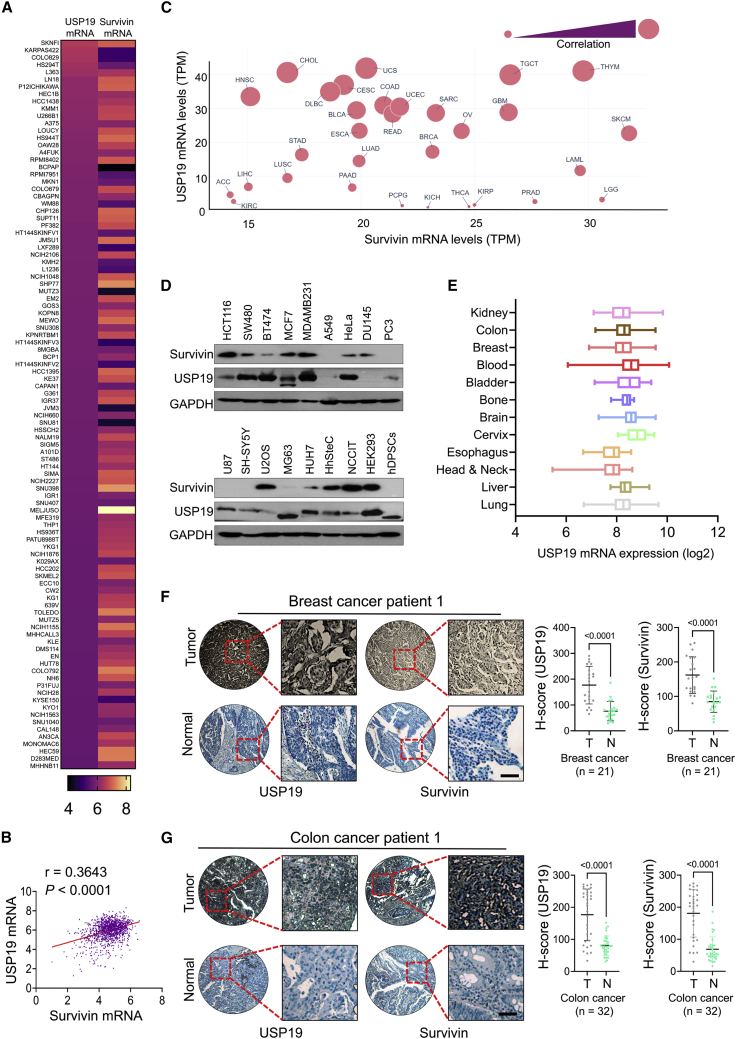
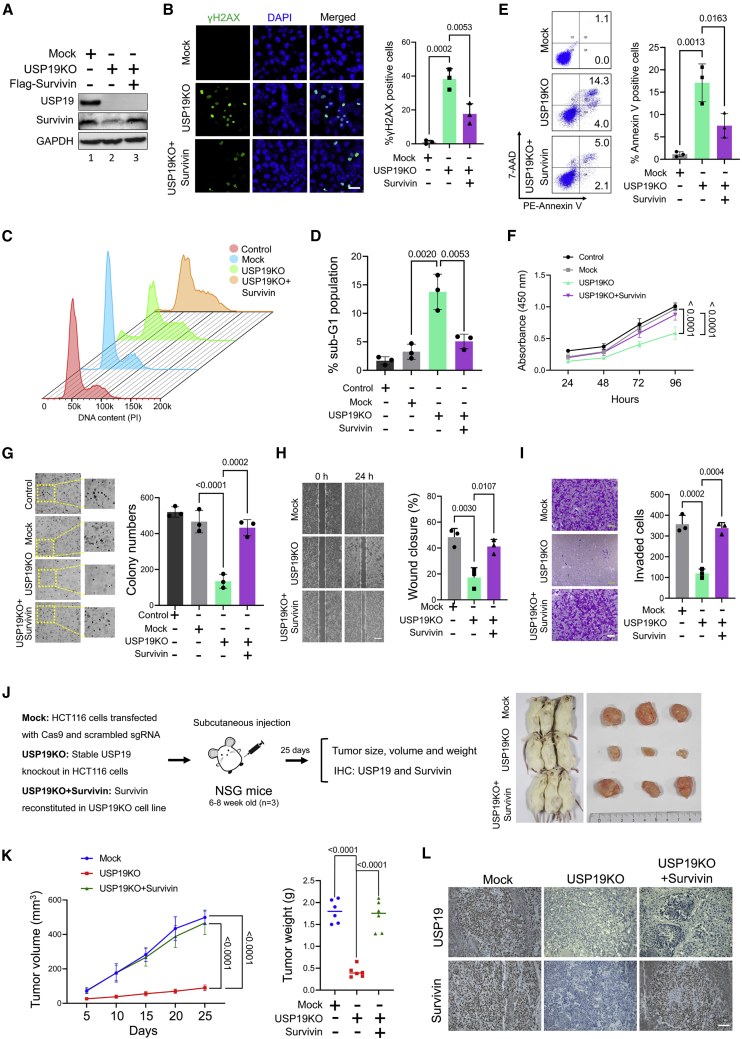
Survivin is a component of the chromosomal passenger complex, which includes Aurora B, INCENP, and Borealin, and is required for chromosome segregation and cytokinesis. We performed a genome-wide screen of deubiquitinating enzymes for survivin. For the first time, we report that USP19 has a dual role in the modulation of mitosis and tumorigenesis by regulating survivin expression. Our results found that USP19 stabilizes and interacts with survivin in HCT116 cells. USP19 deubiquitinates survivin protein and extends its half-life. We also found that USP19 functions as a mitotic regulator by controlling the downstream signaling of survivin protein. Targeted genome knockout verified that USP19 depletion leads to several mitotic defects, including cytokinesis failure. In addition, USP19 depletion results in significant enrichment of apoptosis and reduces the growth of tumors in the mouse xenograft. We envision that simultaneous targeting of USP19 and survivin in oncologic drug development would increase therapeutic value and minimize redundancy.

Keywords: USP19; apoptosis; chromosome; deubiquitinating enzyme; mitosis; protein turnover; survivin; tumor progression.


Conflict of interest statement

Declaration of interests The authors declare no competing interests.

Figures

None
Graphical abstract
Figure 1
Figure 1
CRISPR-Cas9-based genome-scale screening of USP family proteins for survivin (A) Schematic representation of a DUB knockout (KO) library screening system. Day 0: HCT116 cells were seeded at a density of 3.5 × 105 cells/well on 6-well plates and maintained in RPMI. Day 1: DUB KO library consisting of sgRNAs individually targeting an entire set of USP family members along with Cas9 were co-transfected using Lipofectamine 2000 in HCT116 cells. Day 2: The RPMI medium was replaced with complete medium containing puromycin (1.5 μg/mL). Days 3–5: HCT116 transfected cells were allowed to grow under puromycin selection. Day 6: The transfected HCT116 cells were harvested and western blot was performed using survivin antibody. (B) western blot analysis showing endogenous survivin expression levels. (C) western blot analysis of putative DUB candidates in HCT116 cells. (D–F) Validation of the effect of USP19 on survivin protein expression in (D) SW480, (E) SW620, and (F) HT29 cell lines.
Figure 2
Figure 2
USP19 regulates survivin protein stability (A) The effect of USP19 on endogenous survivin protein expression was determined in HCT116 cells. (B) Exogenous protein levels of survivin in HCT116 cells were analyzed upon transfection with increasing concentrations of FLAG-USP19, along with a constant amount of FLAG-survivin. (C) The effect of the catalytic mutant form of USP19 (USP19C506A) on endogenous survivin protein was analyzed upon transfection with increasing concentrations of USP19C506A. (D) The effect of USP19C506A on exogenous survivin protein was analyzed upon transfection with increasing concentrations of USP19C506A, along with a constant amount of FLAG-survivin in HCT116 cells. Western blot analysis was performed with the indicated antibodies. (E and F) HCT116 cells were transfected with indicated plasmids to check the reconstitution effect of USP19 in USP19-depleted cells on survivin by western blot analysis at an (E) endogenous or (F) exogenous level. (G and H) Interactions between (G) endogenous and (H) exogenous USP19 and survivin were analyzed in HCT116 cells. Cell lysates were immunoprecipitated with USP19- or survivin-specific antibodies and immunoblotted with indicated antibodies.
Figure 3
Figure 3
USP19 deubiquitinates survivin and extends the half-life of survivin protein (A and B) The deubiquitinating activity of (A) endogenous and (B) exogenous USP19 on survivin protein was performed in HCT116 cells. HCT116 cells were transfected with indicated constructs and treated with 5 μM MG132 for 6 h before harvesting the samples. Next, survivin-specific antibodies were used to immunoprecipitate endogenous survivin protein or GFP antibody was used to immunoprecipitate exogenous survivin, and the polyubiquitination status of endogenous or exogenous survivin in the presence or absence of FLAG-USP19 or FLAG-USP19C506A was analyzed by western blotting. (C) Schematic representation shows the sgRNA design strategy to target the USP19 gene to generate a stable USP19 KO cell line in HCT116 cells (top panel). The bottom panel shows the Sanger sequence results of the USP19KO clone#5 cell line. (D) The qPCR analysis was performed to validate the USP19KO efficiency and USP19KO effect on survivin mRNA level in HCT116 cells. Data are presented as the means and standard deviations of 3 independent experiments. A 2-tailed t test was used, and the p values are as indicated. (E) Western blot analysis was performed to check the effect of USP19 and survivin protein levels in mock and USP19KO cells. (F) TUBE assay was performed to assess the loss of USP19 on ubiquitination status of survivin in mock and USP19KO HCT116 cells. (G) Mock, USP19KO, and USP19KO reconstituted with either FLAG-USP19 WT or FLAG-USP19C506A transfected HCT116 cells were used to analyze the half-life of survivin. CHX (150 μg/mL) was treated for the indicated time intervals and harvested for western blotting with the indicated antibodies. Data are presented as the means and standard deviations of 3 independent experiments. Two-way ANOVA followed by Tukey’s post hoc test was used with the indicated p values.
Figure 4
Figure 4
USP19 is required for successful mitotic progression (A–E) Mock or USP19KO HCT116 cells were transfected with GFP-H2B, synchronized using thymidine and released into fresh medium. Cells were then monitored using a time-lapse microscope for 12 h and images were taken at 3-min intervals. The results were from 3 independent experiments. (A) Screenshots taken from the time-lapse microscopy of mitotic cell populations (n = 25). NEBD to the mitotic exit was estimated in the mentioned groups and graphically represented. Representative images were formed by merging GFP-H2B fluorescence and phase-contrast images. Scale bar, 25 μm. Data are presented as the means and standard deviations. A 2-tailed t test was used, and the p value is as indicated. (B) Screenshots taken from time-lapse microscopy at the indicated times from NEBD (occurred at 00:00). The anaphase onset is denoted by the red arrowhead. Yellow arrowheads show misaligned or lagging chromosomes, chromatin bridges, or improperly separated chromosomes. Scale bar, 10 μm. (C) Graphical representation of the quantification of mitotic defects from time-lapse videos (n = 10). Data are presented as the means and standard deviations of 3 independent experiments. Two-way ANOVA followed by Bonferroni post hoc test was used, and p values are as indicated. (D) Time-lapse microscopic images of cells undergoing mitosis and cytokinesis. Representative images were formed by merging GFP-H2B fluorescence and phase-contrast images. Scale bar, 25 μm. (E) Quantification of cytokinesis failure from time-lapse videos (n = 35). Data are presented as the means and standard deviations of 3 independent experiments. A 2-tailed t test was used, and the p value is as indicated. (F) Mock or USP19KO HCT116 cells were stained with TPX2 antibody (n = 5). Immunofluorescence analysis was performed to check bi- or multi-nuclei conditions and graphically represented. Scale bar, 10 μm. Data are presented as the means and standard deviations of 5 independent experiments. A 2-tailed t test was used, and the p value is as indicated. (G) Mock, USP19KO, and USP19KO cells transfected with USP19 WT or USP19CA and immunofluorescence staining was performed using TPX2-specific antibody (n = 25). HCT116 cells showing multi-spindles were counted after immunofluorescence staining and graphically represented. Data are presented as the means and standard deviations of 3 independent experiments. One-way ANOVA followed by Tukey’s post hoc test was used with the indicated p values. Scale bar, 10 μm.
Figure 5
Figure 5
USP19 mimics the role of survivin in mitosis (A) Mock, USP19KO, and USP19KO cells transfected with USP19 WT or USP19CA. Immunofluorescence staining was performed using phospho-histone H3 antibody. Scale bar, 100 μm. (B) The cells expressing GFP (phospho-histone H3+) were counted and presented graphically. Data are presented as the means and standard deviations of 3 independent experiments. One-way ANOVA followed by Tukey’s post hoc test was used with the indicated p values. (C) Mock, USP19KO, and USP19KO cells transfected with USP19 WT or USP19CA were synchronized by treating with 100 ng/mL nocodazole for 18 h. Western blot analysis was performed with the indicated antibodies. (D) Mock, USP19KO, and USP19KO cells transfected with USP19 WT or USP19CA were synchronized in prometaphase by treating with 100 ng/mL nocodazole for 18 h and then treated with MG132 for 4 h before harvesting. Western blot analysis was performed using indicated antibodies.
Figure 6
Figure 6
USP19 and survivin expression profiles are positively correlated (A) Heatmap showing the top 100 mRNA expression levels of USP19 and survivin derived from the DepMap portal. Representative samples are arranged from high to low mRNA levels of USP19, and corresponding survivin values are adjusted. (B) Scatterplot between USP19 and survivin mRNA levels from several cancer cell lines. Pearson correlation was performed to estimate the relationship between USP19 and survivin. (C) The mRNA expression profiles of USP19 and survivin were obtained from the GEPIA 2 database and graphically represented using Plotly to assess the correlation between USP19 and survivin. (D) Endogenous protein expression patterns of USP19 and survivin in different cell lines were determined by western blot analysis. In MCF7, MG63, and hDPSCs, the expression of USP19 showed lower molecular weight than the expected size. (E) The mRNA expression data of USP19 was obtained from the GENT2 database and represented graphically. Due to the small sample size for the expression of USP19 in the normal groups obtained from the GENT2 database, the statistical significance between normal and cancer groups could not be calculated. (F and G) Representative immunohistochemical staining images of endogenous USP19 and survivin in human breast cancer (n = 21) and colon cancer (n = 32). All immunohistochemistry (IHC) images were quantified by an H score. A 2-tailed t test was used, and p values are as indicated. Scale bar, 25 μm.
Figure 7
Figure 7
USP19KO inhibits tumor progression in vitro and in vivo Mock, USP19KO, and USP19KO cells reconstituted with survivin plasmid in HCT116 cells were used to perform the following experiments. (A) Western blot analysis was performed using USP19- and survivin-specific antibodies. (B) Immunofluorescence analysis was used to measure γH2AX foci formation. Green, γH2AX; blue, nucleus stained by DAPI. Scale bar, 25 μm. The right panel depicts the percentage of γH2AX+ cells. Data are presented as the means and standard deviations of 3 independent experiments. One-way ANOVA followed by Tukey’s post hoc test was used with the indicated p values. (C and D) Flow cytometry was performed with PI staining to measure the DNA content and is represented graphically. Data are presented as the means and standard deviations of 3 independent experiments. One-way ANOVA followed by Tukey’s post hoc test was used with the indicated p values. (E) Flow cytometry was performed to analyze annexin-V and 7-AAD+ cells and graphically represented. Data are presented as the means and standard deviations of 3 independent experiments. One-way ANOVA followed by Tukey’s post hoc test was used with the indicated p values. (F) Cell viability assay was performed using CCK-8 reagent and represented as the absorbance at 450 nm. Data are presented as the means and standard deviations of 3 independent experiments. Two-way ANOVA followed by Tukey’s post hoc test was used with the indicated p values. (G) Colony formation was measured after 14 days. The colony numbers were quantified and are presented graphically (right panel). Data are presented as the means and standard deviations of 3 independent experiments. One-way ANOVA followed by Tukey’s post hoc test was used with the indicated p values. (H) An in vitro scratch assay was performed to assess the migration potential of the groups mentioned. Scale bar, 100 μm. Data are presented as the means and standard deviations of 3 independent experiments. One-way ANOVA followed by Tukey’s post hoc test was used with the indicated p values. (I) Transwell cell invasion assay was performed with the groups mentioned. Scale bar, 200 μm. Invaded cells were quantified using ImageJ software and represented graphically. Data are presented as the means and standard deviations of 3 independent experiments. One-way ANOVA followed by Tukey’s post hoc test was used with the indicated p values. (J) Xenografts were generated by subcutaneously injecting the mentioned cell groups into the right flank of NSG mice (n = 3). Tumor volumes were recorded and stored for IHC experiments. The right panel shows the tumors excised from the mice after the experiment. (K) Tumor volume and weight were calculated and are presented graphically. Data are presented as the means and standard deviations of 6 biological replicates (n = 6). One-way or 2-way ANOVA followed by Tukey’s post hoc test was used with the indicated p values. (L) Xenograft tumors were sectioned and paraffin embedded. Immunohistochemical analysis was performed with the antibodies indicated. Scale bar, 50 μm.

Similar articles

Cited by

References

    1. Zhang C., Liu Y. Targeting cancer with sesterterpenoids: the new potential antitumor drugs. J. Nat. Med. 2015;69:255–266. - PMC - PubMed
    1. Sun L., Peng Q., Qu L., Gong L., Si J. Anticancer agent icaritin induces apoptosis through caspase-dependent pathways in human hepatocellular carcinoma cells. Mol. Med. Rep. 2015;11:3094–3100. - PubMed
    1. Su Z., Yang Z., Xu Y., Chen Y., Yu Q. Apoptosis, autophagy, necroptosis, and cancer metastasis. Mol. Cancer. 2015;14:48. - PMC - PubMed
    1. Brady S.W., Zhang J., Tsai M.-H., Yu D. PI3K-independent mTOR activation promotes lapatinib resistance and IAP expression that can be effectively reversed by mTOR and Hsp90 inhibition. Cancer Biol. Ther. 2015;16:402–411. - PMC - PubMed
    1. Pereira S.S., Monteiro M.P., Antonini S.R., Pignatelli D. Apoptosis regulation in adrenocortical carcinoma. Endocr. Connect. 2019;8:R91–R104. - PMC - PubMed

Publication types