. 2022 Jul 19;12(32):20696-20713.
doi: 10.1039/d2ra02745c. eCollection 2022 Jul 14.

Facile production of quercetin nanoparticles using 3D printed centrifugal flow reactors

Affiliations

Facile production of quercetin nanoparticles using 3D printed centrifugal flow reactors

Davide De Grandi et al. RSC Adv. .

Abstract

Drug nanocrystals are a delivery system comprised of an active pharmaceutical ingredient, with small amounts of a surface stabilizer. Despite offering simplicity in formulation, their manufacture can be a challenging endeavour; this is especially true when the production is performed using microfluidic devices. Although precipitation within microchannels can lead to issues such as clogging, microfluidics is an appealing manufacturing method as it provides fine control over mixing conditions. This allows production of nanoparticles with a narrower size distribution and greater reproducibility compared to batch methods. To generate microfluidic devices cost effectively, replica moulding techniques are considered the manufacturing standard. Due to its simplicity and relatively low cost, 3D printing has become prevalent at the laboratory scale, especially during iterative development of new devices. A challenge of microfluidic-based methods is that they require specialized equipment and multi-step procedures, making them less accessible to users with no previous experience. In a recent study we developed a 3D printed flow-through reactor, referred to as reactor-in-a-centrifuge (RIAC). It is a simple device designed to fit in a 50 mL tube and actuated using a laboratory centrifuge, which removes the need for specialized instrumentation. The manufacturing capabilities of the RIAC have been already proven, by reproducible production of liposomes and silver nanoparticles. The present work demonstrates the use of RIACs with a straight- and spiral-shaped channel architecture to produce quercetin nanocrystals, with therapeutically relevant size (190-302 nm) and very low size dispersity (polydispersity index, PDI < 0.1). The work focused on evaluating how changes in operational parameters (actuation speed) and formulation components (medium viscosity and stabilizer type), impacted on nanocrystal size and PDI. Under all tested conditions the obtained nanocrystals had a smaller size and narrower size distribution, when compared to those produced with alternative methods. The obtained quercetin nanosuspensions however showed limited stability, which should be addressed in future investigations. The simplicity of the RIAC makes it an appealing technology to research groups, especially in low-resource settings and without prior expertise in microfluidics.


Conflict of interest statement

There are no conflicts to declare.

Figures

Fig. 1
Fig. 1. Schematic representation (cross-sectional view) of both spiral- and straight-RIAC prototypes. Both RIACs contain a recess at the bottom of each reservoir, to host a 3.175 mm steel HPLC-grade FRIT filter. The positioning of these filters is illustrated for the spiral-RIAC.
Fig. 2
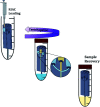
Fig. 2. Nanocrystals production method using the RIAC. The steel support is connected to the RIAC, and the reactor is placed in a 50 mL centrifuge tube. Using a micropipette, reagents are added to the reservoirs and to the bottom of the tube. The tube is then closed and placed in the centrifuge. In this work, two reactors were actuated simultaneously in each run. After centrifugation, the reactors are removed from the tube, and the sample is recovered in a glass vial. The reactors are then washed with absolute ethanol and dried as described in the Methods section.
Fig. 3
Fig. 3. (A) Size distribution of samples manufactured using 4% KP407 (in blue) and 4% TW20 (in orange). These samples were optically clear and likely contained quercetin solubilised within polymeric micelles. (B) Photograph of a sample prepared using 4% KP407. Quercetin did not precipitate in the form of crystals or nanoparticles, as it was likely solubilised within polymeric micelles. (C) Photograph of a sample prepared using 1% KP407. Quercetin precipitated in the form of coarse acicular crystals that sedimented at the bottom of the vial.
Fig. 4
Fig. 4. In the RIAC, nanoparticles are produced in a similar way to pump-driven microfluidic devices that rely on the mixing between a solvent and an antisolvent. The quercetin organic solution (S) and the aqueous solution containing an amphoteric polymer (A) are first placed in the RIAC reservoirs and at the bottom of the centrifuge tube. When the reactor is actuated inside the centrifuge, S and A flow from the reservoirs into the mixing channel, where rapid and controlled mixing occurs. In this process, the aqueous solution acts as the antisolvent and allows the precipitation of the drug. The newly formed nanoparticles exhibit high surface tension and the amphoteric polymer acts as a stabilizer, covering the nanocrystals surface and hindering interparticle aggregation.
Fig. 5
Fig. 5. Mean particle size (A) and PDI (B) of quercetin nanocrystals manufactured using the two different RIAC architectures. Samples were prepared in triplicate, using both RIAC configurations operated at two RCF levels (500 and 3000). Samples were prepared using three different concentrations of HPMC, corresponding to 0.5%, 0.75% and 1% (in blue, red and green respectively). Nanocrystal size and RSD of triplicates increased with increasing HPMC concentration, whereas PDI remained relatively low and almost unchanged throughout all samples.
Fig. 6
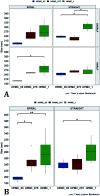
Fig. 6. Mean particle size comparisons between samples manufactured at the same HPMC concentration. Plots highlight differences in particle size determined by changes in (A) RCF and (B) RIAC configuration used. (A) Comparison of particle size for samples prepared at 500 RCF (in yellow) and 3000 RCF (in blue). Nanoparticles didn't show significant differences at any HPMC concentration level (0.5%, 0.75% and 1% w/v). (B) When samples were prepared using different RIAC architectures (straight-RIAC in purple, and spiral-RIAC in brown) significant differences were detected between samples prepared using 0.5% HPMC, at both 500 and 3000 RCF (p < 0.005 in both cases).
Fig. 7
Fig. 7. Mean particle size comparisons between samples manufactured using increasing HPMC concentration (0.5%, 0.75% and 1%). Plots highlight differences in nanocrystal mean diameter determined by changes in HPMC concentration. Panel (A) shows differences in particle mean diameter due to both the variation of RIAC architecture and RCF value used. For samples prepared using the spiral-RIAC, there is a clear increase in mean particle diameter when HPMC concentration is increased (at both RCF levels tested), although only samples prepared using 0.5% and 1% HPMC at 500 RCF are significantly different (p < 0.05). Concerning the straight-RIAC, samples prepared using 0.5% and 0.75% HPMC appear very similar to each other at both RCF levels. The sample prepared using 1% HPMC shows a significant increase in particle diameter only when the production is conducted at 3000 RCF. The plot in panel (B) groups the samples prepared at different RCFs and illustrates differences in mean particle size due to the variation of HPMC concentration (for both RIAC architectures employed). An increase in particle size with increasing HPMC concentration can be appreciated.
Fig. 8
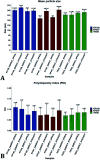
Fig. 8. Mean particle size (A) and PDI (B) of quercetin nanocrystals manufactured using the two different RIAC architectures. Samples were prepared in triplicate, and both RIAC configurations were operated at two RCF levels (500 and 3000). Samples were prepared using three different polymeric stabilizers: Kolliphor P 188 (KP188), Kolliphor P 407 (KP407) and polysorbate 20 (TW20) (in blue, red and green, respectively). Nanocrystals size underwent appreciable variations when the stabilizer was changed, whereas PDI remained quite low and almost unchanged throughout all samples.
Fig. 9
Fig. 9. Mean particle size comparisons between samples manufactured using the same polymeric stabilizer. Plots highlight differences in nanoparticle size determined by changes in (A) RCF and (B) RIAC architecture. (A) Only samples prepared using Kolliphor P 188 (KP188) and the straight-RIAC showed significant particle size differences due to changes in RCF (p < 0.05). (B) When samples were prepared using different RIAC architectures (straight-RIAC in purple and spiral-RIAC in brown) significant differences in size were found between samples prepared using Kolliphor P 407 (KP407) as stabilizer, at both 500 and 3000 RCF (p < 0.005), and using KP188 (but only at 3000 RCF; p < 0.05).
Fig. 10
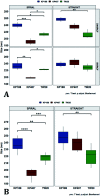
Fig. 10. Mean particle size comparisons between samples manufactured using different polymeric stabilizers: Kolliphor P 188 (KP188), Kolliphor P 407 (KP407) and polysorbate 20 (TW20). Plots highlight differences in nanocrystal mean diameter determined by changes in the stabilizer used. The top panel (A) shows differences in particle mean diameter due to both the variation of RIAC architecture and RCF used for the production of the samples. For samples prepared using the spiral-RIAC, significant differences between most of the samples are found, as represented by the brackets (* = p < 0.05; ** = p < 0.005; *** = p < 0.0005). Concerning the straight-RIAC, samples prepared at 3000 RCF show appreciable differences, with a significant difference in size between samples prepared using KP188 and TW20. At 500 RCF, the manufactured samples do not show any significant difference. Panel (B) groups samples prepared at different RCFs and shows differences in mean particles size due to the change of stabilizer used (when the manufacturing is carried out using the two RIAC architectures).
Fig. 11
Fig. 11. Zeta potential distribution of unprocessed and post-processed quercetin nanocrystal suspensions. Before processing the zeta potential distribution displays two separate peaks (red line), likely due to the presence of uncoated quercetin nanocrystals and negative polymeric micelles. After processing (orange and blue lines), sample zeta potential shifted and the distribution presents only one (slightly negative) peak.

Similar articles

Cited by

References

    1. Amidon G. L. Lennernäs H. Shah V. P. Crison J. R. Pharm. Res. 1995;12:413–420. - PubMed
    1. Lipinski C. A. J. Pharmacol. Toxicol. Methods. 2000;44:235–249. - PubMed
    1. Tao J. Chow S. F. Zheng Y. Acta Pharm. Sin. B. 2019;9:4–18. - PMC - PubMed
    1. Shekhawat P. B. Pokharkar V. B. Acta Pharm. Sin. B. 2017;7:260–280. - PMC - PubMed
    1. Guimarães D. Cavaco-Paulo A. Nogueira E. Int. J. Pharm. 2021;601:120571. - PubMed