

Maternal stevioside supplementation improves intestinal immune function of chicken offspring potentially via modulating gut microbiota and down-regulating the promoter methylation level of suppressor of cytokine signaling 1 (SOCS1)
- PMID: 35919247
- PMCID: PMC9307571
- DOI: 10.1016/j.aninu.2022.06.002
Maternal stevioside supplementation improves intestinal immune function of chicken offspring potentially via modulating gut microbiota and down-regulating the promoter methylation level of suppressor of cytokine signaling 1 (SOCS1)
Abstract
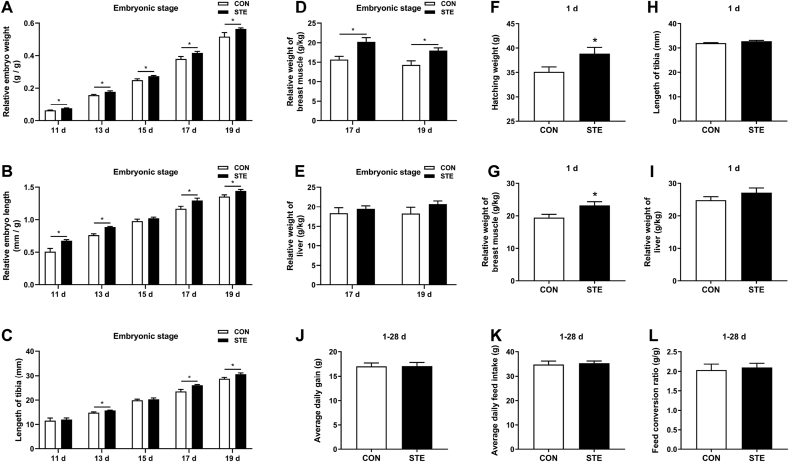
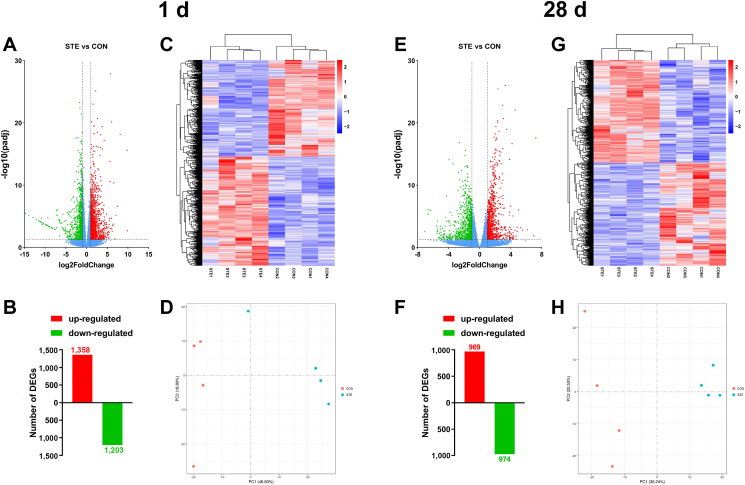
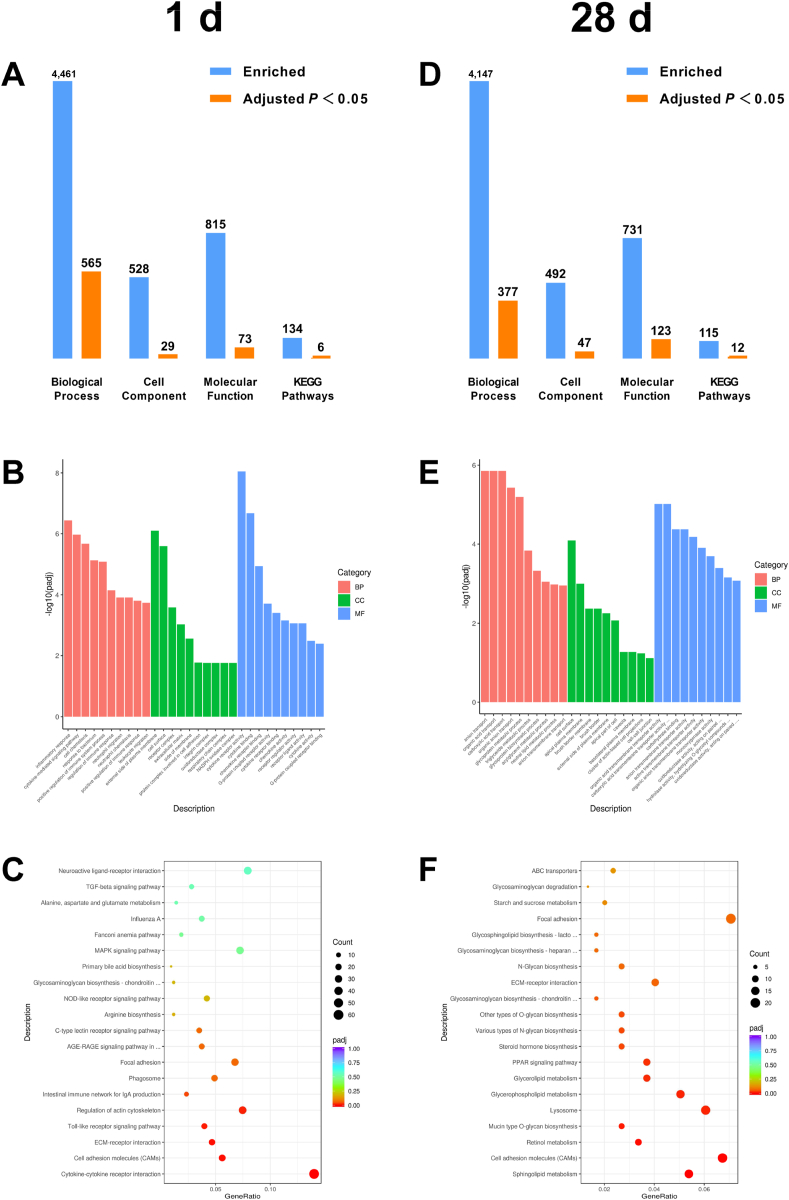
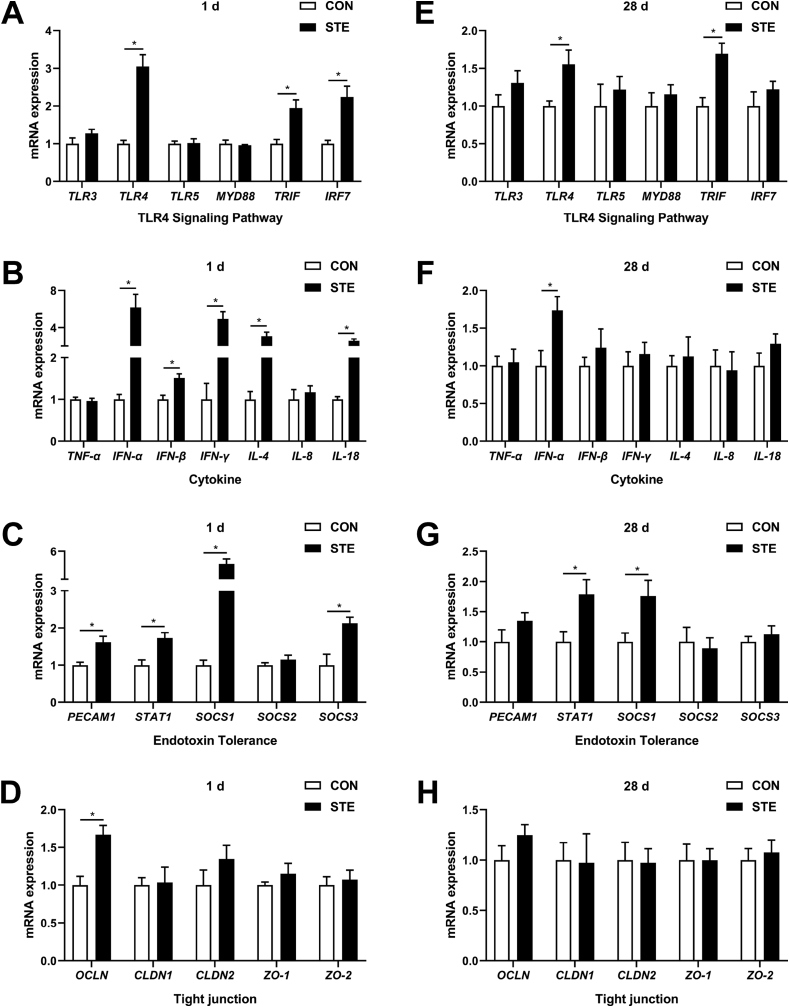
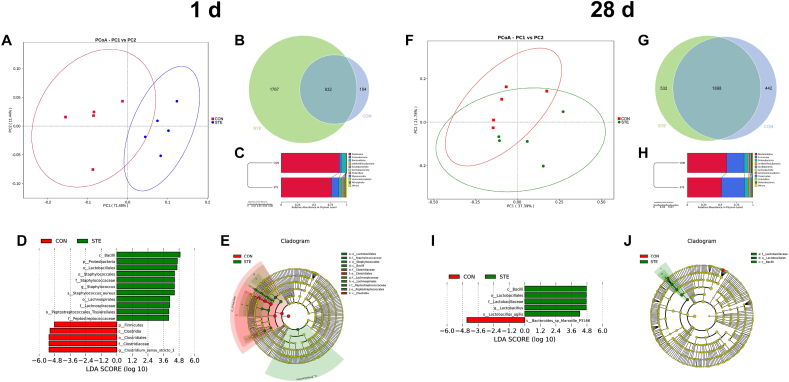
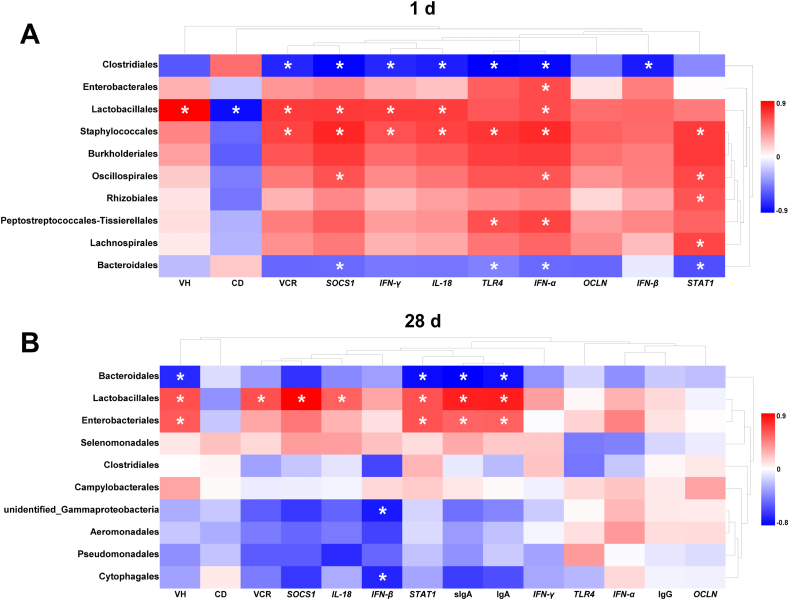
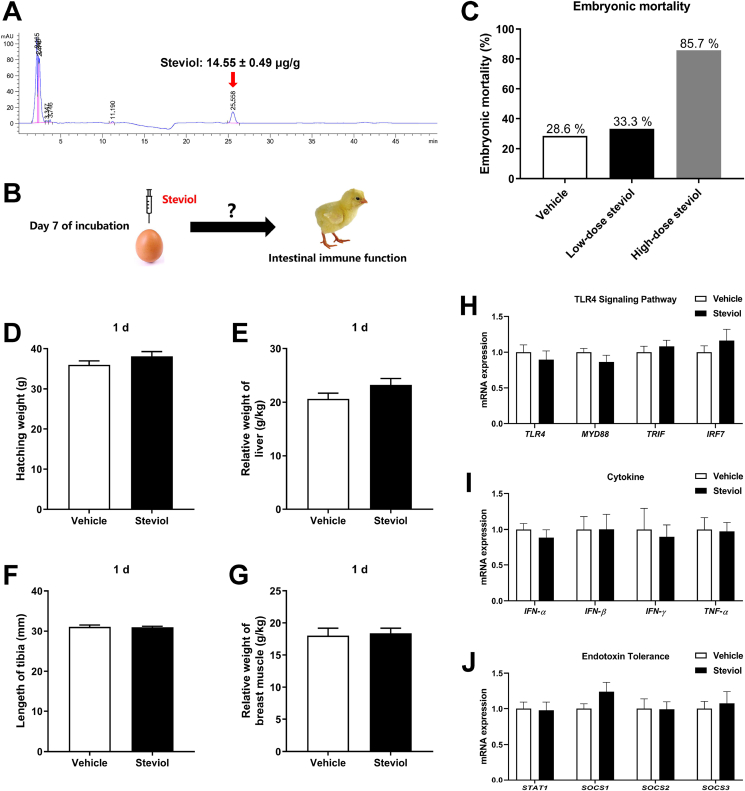
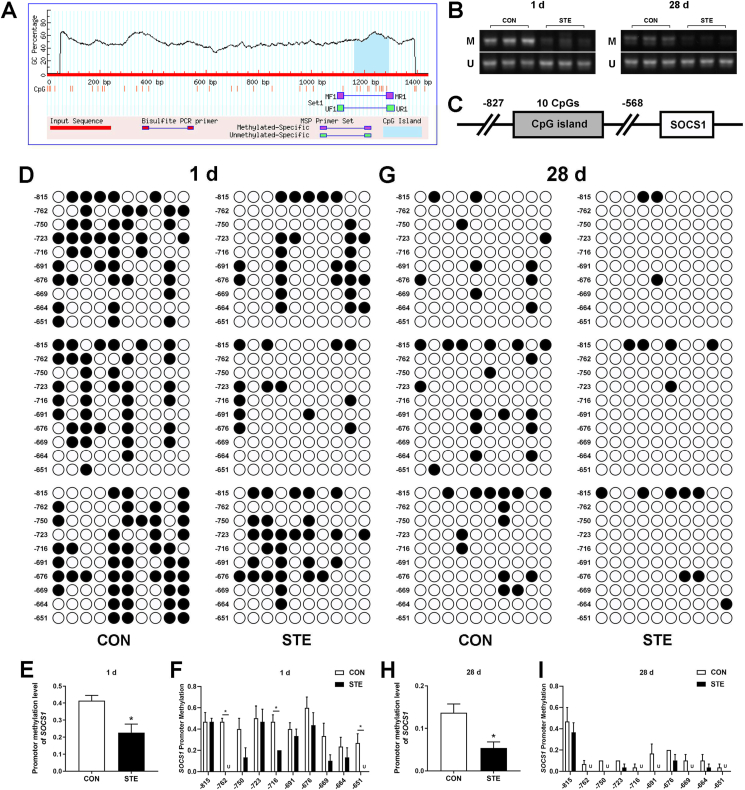
The intestinal immune function of chickens is limited during the early growing stage. Maternal nutritional intervention has been suggested to affect the innate immunity of offspring. The present study aimed to investigate the effects of maternal stevioside supplementation on the intestinal immune function of chicken offspring. A total of 120 Jinmao yellow-feathered breeder hens were fed a basal diet or a diet supplemented with 250 mg/kg stevioside for 5 weeks. During the last week, 200 breeding eggs from each group were collected for incubation. After hatching, 80 male offspring (40 chickens from each group) were randomly selected and fed the same basal diet for 28 d. In addition, 90 well-shaped fertile eggs of non-treated breeder hens were incubated for the in ovo injection experiment. Steviol dissolved in 20% glycerol was injected at 7 d of incubation. The results showed that maternal stevioside supplementation could improve embryonic development, jejunal integrity and proliferation in the jejunal crypt (P < 0.05). Maternal stevioside supplementation could also increase the innate transcription levels of cytokines and endotoxin tolerance-related factors in the jejunum of chicken offspring (P < 0.05). At 28 d of age, the offspring following maternal stevioside supplementation exhibited higher jejunal secretory immunoglobulin A and serum interferons levels (P < 0.05). A higher abundance of Lactobacillales induced by maternal stevioside supplementation was positively correlated with intestinal immune-related factors (P < 0.05). The in ovo injection with steviol did not alter either embryonic development or intestinal immune function of hatching chickens (P > 0.05). Furthermore, maternal stevioside supplementation could induce hypo-methylation on the promoter region of suppressor of cytokine signaling 1 (SOCS1). In conclusion, maternal stevioside supplementation could improve the intestinal immune function of chicken offspring potentially via modulating the gut microbiota and down-regulating the promoter methylation level of SOCS1.
Keywords: Immune function; Jejunum; Maternal; Offspring; Stevioside; Transcriptome.
© 2022 Chinese Association of Animal Science and Veterinary Medicine. Publishing services by Elsevier B.V. on behalf of KeAi Communications Co. Ltd.
Conflict of interest statement
We declare that we have no financial and personal relationships with other people or organizations that can inappropriately influence our work, and there is no professional or other personal interest of any nature or kind in any product, service and/or company that could be construed as influencing the content of this paper.
Figures

Similar articles
-
Supplementing Genistein for Breeder Hens Alters the Growth Performance and Intestinal Health of Offspring.Life (Basel). 2023 Jun 28;13(7):1468. doi: 10.3390/life13071468. Life (Basel). 2023. PMID: 37511844 Free PMC article.
-
Maternal stevioside supplementation ameliorates intestinal mucosal damage and modulates gut microbiota in chicken offspring challenged with lipopolysaccharide.Food Funct. 2021 Jul 7;12(13):6014-6028. doi: 10.1039/d0fo02871a. Epub 2021 May 26. Food Funct. 2021. PMID: 34036963
-
Effects of laying breeder hens dietary β-carotene, curcumin, allicin, and sodium butyrate supplementation on the jejunal microbiota and immune response of their offspring chicks.Poult Sci. 2020 Aug;99(8):3807-3816. doi: 10.1016/j.psj.2020.03.065. Epub 2020 May 19. Poult Sci. 2020. PMID: 32731966 Free PMC article.
-
Dietary collagen peptide-chelated trace elements supplementation for breeder hens improves the intestinal health of chick offspring.J Sci Food Agric. 2024 Jan 15;104(1):174-183. doi: 10.1002/jsfa.12938. Epub 2023 Sep 12. J Sci Food Agric. 2024. PMID: 37612258
-
Maternal β-carotene supplementation improves offspring growth, development, immunity, and intestinal microbiota in chickens via immune-mediated and microbial-mediated maternal effects.Sci Rep. 2025 May 31;15(1):19149. doi: 10.1038/s41598-025-03450-5. Sci Rep. 2025. PMID: 40450070 Free PMC article.
Cited by
-
Unveiling the skin microbial guardians and assailants in psoriasis subtypes: a Mendelian randomization study.Arch Dermatol Res. 2024 Dec 10;317(1):95. doi: 10.1007/s00403-024-03602-z. Arch Dermatol Res. 2024. PMID: 39656273
-
Maternal supplementation with mulberry-leaf flavonoids improves the development of skeletal muscle in the offspring of chickens.Anim Nutr. 2024 Apr 17;18:72-83. doi: 10.1016/j.aninu.2024.04.005. eCollection 2024 Sep. Anim Nutr. 2024. PMID: 39035983 Free PMC article.
-
Stevioside Improves Antioxidant Capacity and Intestinal Barrier Function while Attenuating Inflammation and Apoptosis by Regulating the NF-κB/MAPK Pathways in Diquat-Induced Oxidative Stress of IPEC-J2 Cells.Antioxidants (Basel). 2023 May 10;12(5):1070. doi: 10.3390/antiox12051070. Antioxidants (Basel). 2023. PMID: 37237936 Free PMC article.
-
Effects of hesperidin, thymol, rosmarinic acid and their combined effect on growth performance, intestinal barrier function and cecal microbiota in broilers.Poult Sci. 2024 Dec;103(12):104247. doi: 10.1016/j.psj.2024.104247. Epub 2024 Aug 27. Poult Sci. 2024. PMID: 39265517 Free PMC article.
-
Supplementing Genistein for Breeder Hens Alters the Growth Performance and Intestinal Health of Offspring.Life (Basel). 2023 Jun 28;13(7):1468. doi: 10.3390/life13071468. Life (Basel). 2023. PMID: 37511844 Free PMC article.
References
-
- Abdel-Moneim A.E., Elbaz A.M., Khidr R.E., Badri F.B. Effect of in ovo inoculation of Bifidobacterium spp. on growth performance, thyroid activity, ileum histomorphometry, and microbial enumeration of broilers. Probiotics Antimicrob Proteins. 2020;12:873–882. - PubMed
-
- Abreu M.T. Toll-like receptor signalling in the intestinal epithelium: how bacterial recognition shapes intestinal function. Nat Rev Immunol. 2010;10:131–144. - PubMed
-
- Alavala S., Sangaraju R., Nalban N., Sahu B.D., Jerald M.K., Kilari E.K., et al. Stevioside, a diterpenoid glycoside, shows anti-inflammatory property against Dextran Sulphate Sodium-induced ulcerative colitis in mice. Eur J Pharmacol. 2019;855:192–201. - PubMed
LinkOut - more resources
Full Text Sources
