. 2022 Jan 10;9(7):nwac003.
doi: 10.1093/nsr/nwac003. eCollection 2022 Jul.

The second polar body contributes to the fate asymmetry in the mouse embryo

Affiliations

The second polar body contributes to the fate asymmetry in the mouse embryo

Hongbin Jin et al. Natl Sci Rev. .

Abstract

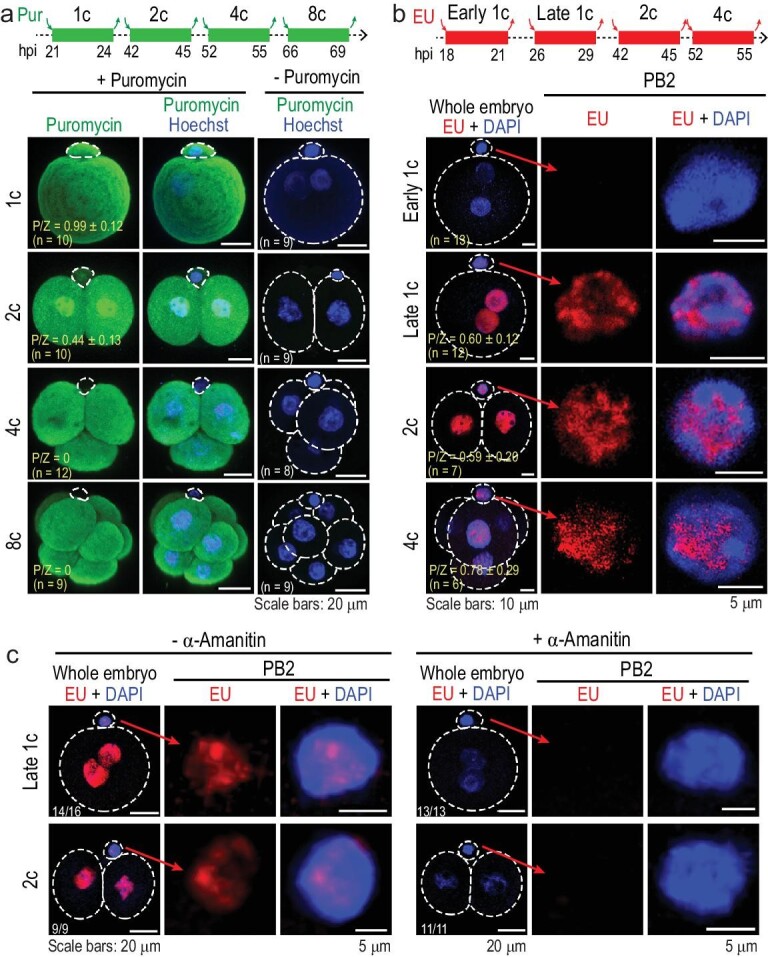
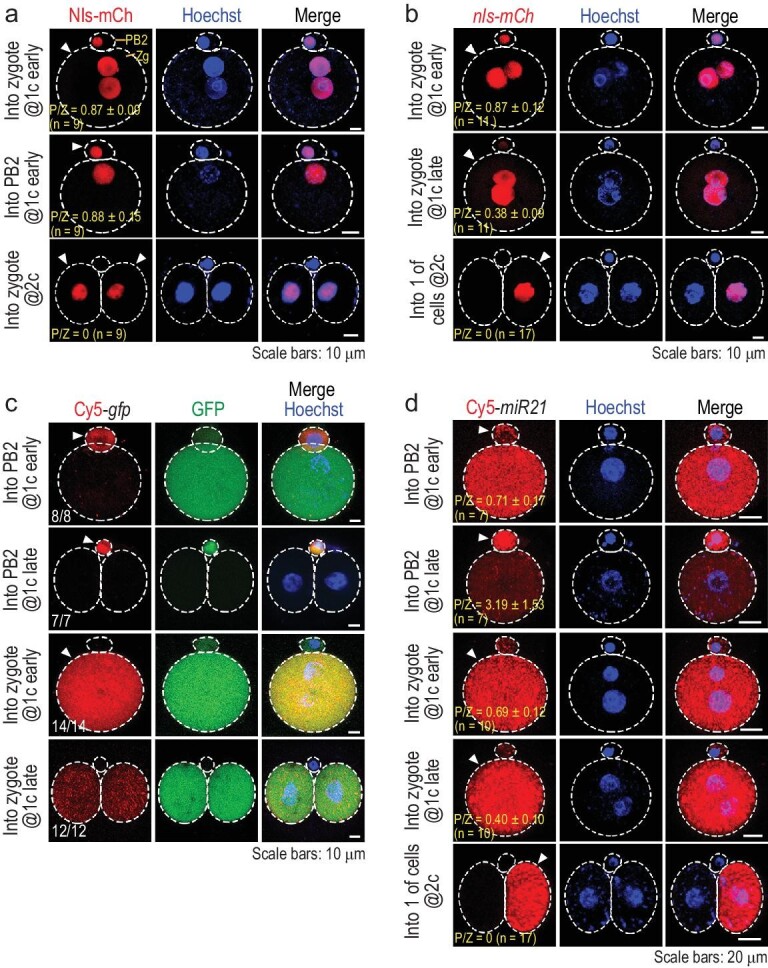
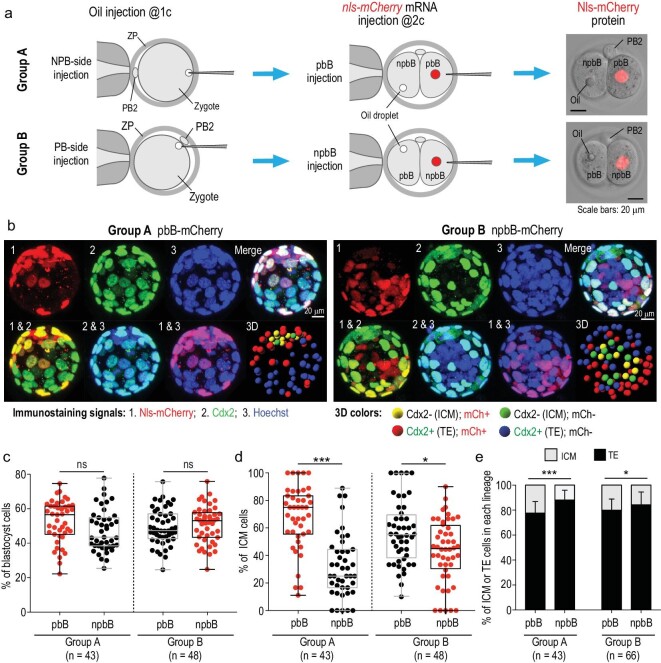
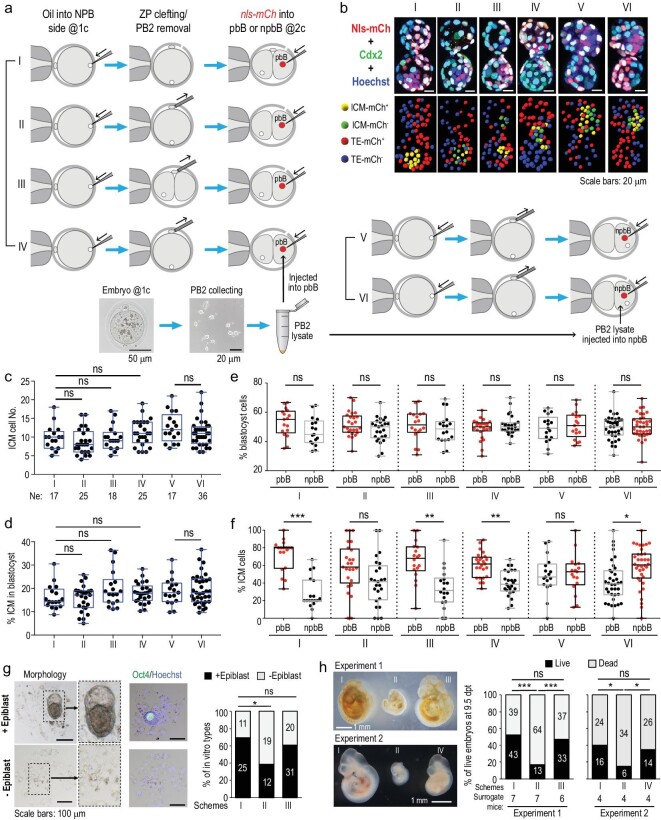
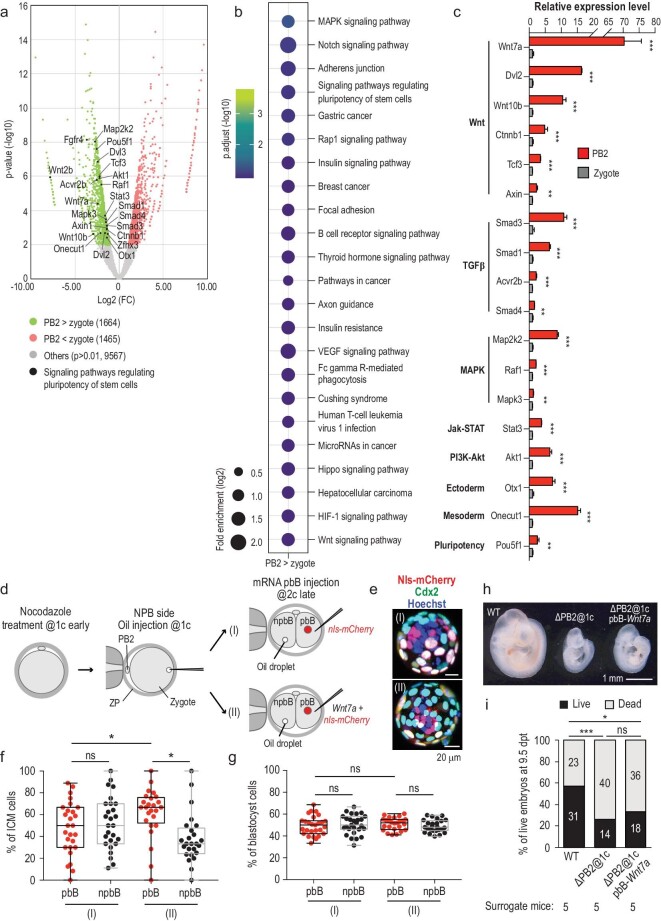
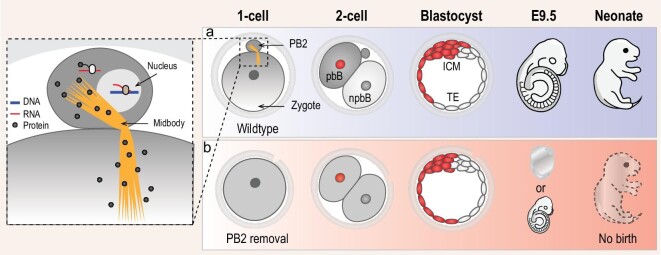
The polar bodies (PBs) are extruded microcells during oocyte meiosis and generally regarded as inessentials for embryonic development. Therefore, PBs have been widely used as important materials for pre-implantation genetic diagnosis in human. Here we report that the second PB (PB2) in the mouse zygote may play roles in cell-fate specification and post-implantation development. A subset of mRNAs encoding pluripotency-related factors are enriched in PB2. Nascent proteins may be synthesized in PB2 after fertilization and transport from PB2 to the zygote before the two-cell stage. The PB2-attached blastomere (pbB) at the two-cell stage, compared to the other blastomere (npbB), likely contributes more descendants to the inner cell mass (ICM) lineage in the blastocyst. Removal of PB2 from the zygote or transient blockage of material exchange between PB2 and the zygote by nocodazole treatment appears to cause a loss of the ICM fate bias of pbB. PB2 removal or nocodazole treatment also results in abnormal post-implantation development. Injection of PB2 lysate into pbB of PB2-removed two-cell-stage embryos may reset the cell-fate preference and rescue post-implantation development. Our data collectively suggest that PB2 would demarcate the earliest cell-fate asymmetry of the mouse zygote and be required for post-implantation development.

Keywords: asymmetry; cell fate; embryo; mouse; polar body.


Figures

Figure 1.
Figure 1.
Translation and transcription activity in PB2. (a) Translation activity revealed by immunostaining with puromycin antibody. Embryos at an indicated stage were incubated in the presence of puromycin for 3 h. The top illustration shows the treated period referred to hours post human chorionic gonadotrophin (HCG) injection (hpi). The right column: negative controls with no signal. P/Z, ratio of mean signal intensity in PB2 to that in the zygote; n, number of observed embryos (same in (b)). (b) Transcription activity revealed by EU incorporation assay. Embryos at an indicated stage were incubated in the presence of EU for 3 h as indicated on the top illustration. (c) Inhibition of transcription activity by α-amanitin. One-cell stage embryos were incubated in the presence of α-amanitin throughout but with the addition of EU at different stages for the indicated duration, followed by EU staining. All images were acquired by confocal microscopy. The ratio of observed embryos with the representative pattern is indicated.
Figure 2.
Figure 2.
Protein and RNA transport between PB2 and the zygote. The embryos were injected at an indicated stage and directly observed by confocal microscopy ∼4 h post injection. The injected cell is indicated by an arrowhead. DNA/nucleus was stained by Hoechst 33342. The ratio of observed embryos with the representative pattern is indicated at the bottom left corner. Zg, zygote. (a) Transport of injected Nls-mCherry protein. (b) Transport of Nls-mCherry following nls-mCherry mRNA. (c) Transport of Cy5-labeled full-length gfp mRNA. The ratio of embryos with the representative pattern is indicated. (d) Transport of Cy5-labeled miR21-3p RNA. P/Z, ratio of mean signal intensity in PB2 to that in the zygote (a), (b) and (d); n, the number of observed embryos.
Figure 3.
Figure 3.
pbB descendants may contribute more to the ICM. (a) Two injection strategies. ZP, zona pellucida; pbB, polar body-attached blastomere; npbB, blastomere opposite to pbB. Right column: Nls-mCherry protein expressed from injected nls-mCherry mRNA. (b) Example of Z-stack confocal and 3D-reconstituted images of blastocysts after immunostaining with mCherry and Cdx2 antibodies together with Hoechst staining. The inner cells were ascertained by viewing Z-slices and 3D images from different angles (see also Supplementary Video S3). (c) and (d) Percentage of pbB- or npbB-derived blastocyst cells (c) or ICM cells (d). Each dot represents the percentage from one blastocyst. Box and whiskers plot (c) and (d), from minimum to maximum with the median indicated by the center line; box limits, upper and lower quartiles; n, number of observed blastocysts. (e) Proportion of ICM or TE cells derived from pbB or npbB. Statistical significance: ns, non-significant (P > 0.05); *P < 0.05; ***P < 0.001.
Figure 4.
Figure 4.
Effect of PB2 removal on pre-implantation cell-fate specification. (a) Schemes of manipulations. (b) Example of confocal images of blastocysts after immunostaining with mCherry and Cdx2 antibodies together with Hoechst staining. Note that blastocysts hatched earlier due to the hole in ZP. (c)–(f) Box and whiskers plots showing total number of ICM cells (c), percentage of ICM cells in the blastocyst (d) and percentage of pbB- or npbB-derived blastocyst cells (e) or ICM cells (f). Each dot represents the percentage from one blastocyst. (g) Effect of PB2 removal on in vitro post-implantation development. Embryos in vitro cultured to 7.5 days post fertilization were observed for morphology (left) and for Oct4 expression (middle). The percentage of embryos with an epiblast-like structure was calculated. (h) Effect of PB2 removal on in vivo post-implantation development. Embryos treated as shown in (a) were transferred to surrogate mice and the percentage of live embryos with normal tissues at 9.5 days post transplantation was calculated (right panel). Morphology of representative embryos is shown in the left panels. The dead embryos included non-implanted blastulas as well as implanted but deformed embryos. In the bar graphs, the total embryo numbers (pooled from several batches) are shown within the bar areas. Statistical significance: ns, non-significant (P > 0.05); *P < 0.05; **P < 0.01; ***P < 0.001.
Figure 5.
Figure 5.
Identification of potential regulators provided by PB2. (a) Volcano plot of differentially expressed genes between PB2 and the zygote at the one-cell stage. The analysis was based on RNA-seq data of PB2 and the zygote. Some genes involved in the pluripotency of stem cells were upregulated in PB2 and marked by black dots in the plot. (b) Kyoto Encyclopedia of Genes and Genomes (KEGG) enrichment analysis of genes highly expressed in PB2. (c) RT-qPCR analysis of some genes that were enriched in PB2 and related to signaling pathways regulating the pluripotency of stem cells. (d) Illustration of manipulations for testing Wnt7a overexpression effect. Embryos were treated with nocodazole for 3 h at the early one-cell stage. Then oil was injected to label the NPB side of the embryos. Wnt7a-HA mRNA was injected into pbB together with nls-mCherry mRNA at the late two-cell stage (II). For the control group, nls-mCherry mRNA was injected into pbB (I). (e) Examples of immunostained blastocysts in each group. (f) and (g) Percentage of pbB- or npbB-derived ICM cells (f) or blastocyst cells (g). Each dot represents the percentage from one blastocyst. (h) Morphology of representative live embryos dissected from surrogate mice. Wild-type (WT) embryos with PB2 removed at the one-cell stage (ΔPB2@1c) or ΔPB2@1c embryos with Wnt7A mRNA injection into pbB at the two-cell stage were transferred to surrogate mice and the mice were dissected at 9.5 days post transplantation. (i) Percentage of live embryos with normal tissues and dead embryos (non-implanted or deformed) at. 9.5 days post transplantation in each group. Statistical significance: ns, non-significant (P > 0.05); *P < 0.05; **P < 0.01; ***P < 0.001.
Figure 6.
Figure 6.
Model of PB2 function. (a) Normal developmental process of the zygote with PB2. Proteins translated from mRNAs in PB2 may transport to the zygote and probably form gradients along the animal–vegetal axis, resulting in higher amounts in pbB and lower amounts in npbB at the two-cell stage. Then, pbB may give rise to more ICM cells than npbB in the blastocyst that would develop normally. (b) Abnormal development of the zygote without PB2. Following PB2 removal, the zygote does not receive PB2-derived proteins, probably resulting in loss of asymmetry between pbB and npbB. In this scenario, the blastocyst looks morphologically normal but the ICM consists of a comparable number of pbB and npbB descendants; this blastocyst may undergo implantation failure or embryonic death, or form a small fetus that cannot survive to birth.

Similar articles

Cited by

References

    1. Roth S, Lynch JA. Symmetry breaking during Drosophila oogenesis. Cold Spring Harb Perspect Biol 2009; 1: a001891.10.1101/cshperspect.a001891 - DOI - PMC - PubMed
    1. Nusslein-Volhard C. Determination of the embryonic axes of Drosophila. Dev Suppl 1991; 1: 1–10. - PubMed
    1. De Robertis EM, Larrain J, Oelgeschlager Met al. . The establishment of Spemann's organizer and patterning of the vertebrate embryo. Nat Rev Genet 2000; 1: 171–81.10.1038/35042039 - DOI - PMC - PubMed
    1. Fuentes R, Tajer B, Kobayashi Met al. . The maternal coordinate system: molecular-genetics of embryonic axis formation and patterning in the zebrafish. Curr Top Dev Biol 2020; 140: 341–89.10.1016/bs.ctdb.2020.05.002 - DOI - PubMed
    1. Yan L, Chen J, Zhu Xet al. . Maternal Huluwa dictates the embryonic body axis through beta-catenin in vertebrates. Science 2018; 362: doi: 10.1126/science.aat1045.10.1126/science.aat1045 - DOI - PubMed