. 2022 Jul 27;8(2):veac063.
doi: 10.1093/ve/veac063. eCollection 2022.

Evolution of ACE2-independent SARS-CoV-2 infection and mouse adaption after passage in cells expressing human and mouse ACE2

Affiliations

Evolution of ACE2-independent SARS-CoV-2 infection and mouse adaption after passage in cells expressing human and mouse ACE2

Kexin Yan et al. Virus Evol. .

Abstract

Human ACE2 Human angiotensin converting enzyme 2 (hACE2) is the key cell attachment and entry receptor for severe acute respiratory syndrome coronavirus 2 (SARS-CoV-2), with the original SARS-CoV-2 isolates unable to use mouse ACE2 (mACE2). Herein we describe the emergence of a SARS-CoV-2 strain capable of ACE2-independent infection and the evolution of mouse-adapted (MA) SARS-CoV-2 by in vitro serial passaging of virus in co-cultures of cell lines expressing hACE2 and mACE2. MA viruses evolved with up to five amino acid changes in the spike protein, all of which have been seen in human isolates. MA viruses replicated to high titers in C57BL/6J mouse lungs and nasal turbinates and caused characteristic lung histopathology. One MA virus also evolved to replicate efficiently in several ACE2-negative cell lines across several species, including clustered regularly interspaced short palindromic repeats/CRISPR-associated protein 9 (CRISPR/Cas9) ACE2 knockout cells. An E484D substitution is likely involved in ACE2-independent entry and has appeared in only ≈0.003 per cent of human isolates globally, suggesting that it provided no significant selection advantage in humans. ACE2-independent entry reveals a SARS-CoV-2 infection mechanism that has potential implications for disease pathogenesis, evolution, tropism, and perhaps also intervention development.

Keywords: ACE2-independent infection; COVID-19; SARS-CoV-2; mouse adaptation.


Figures

Figure 1.
Figure 1.
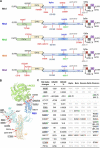
In vitro evolution of SARS-CoV-2QLD02 to mACE2 utilization. (A) Schematic of SARS-CoV-2QLD02 passaging in HEK293T-hACE2 or HEK293T-mACE2N31K/H353K cells, co-cultured with HEK293T-mACE2 cells (nine passages), followed by passaging in HEK293T-mACE2 cells (three passages) and mouse infections. Viruses used to infect mice and viruses derived from mice lungs (2 dpi) were sequenced. Stock virus was prepared for MA1 and MA2 from mouse lungs (2 dpi) for use in subsequent experiments. (B) Supernatants from passages 4 and 9 (from the co-cultures—blue arrows) were used to infect HEK93T-mACE2 cells and viral growth over 72 h determined by CCID50 assays. Dotted line—limit of detection. MA1, MA3, and MA6 (underlined) were derived from HEK293T-hACE2/HEK293T-mACE2 co-cultures, MA2, MA4, and MA5 from HEK293T-mACE2N31K/H353K/HEK293T-mACE2 co-cultures. (C) Inverted light microscopy images of CPE in HEK293T-mACE2 cells infected with passage 9 supernatants at 72 h postinfection. Images are representative of at least three replicates. (D) MA viruses obtained after three passages in HEK293T-mACE2 cells were used to infect C57BL/6J mice. Lung tissue titers are shown for 2 dpi for MA1-5 (n = 1 for each) and for SARS-CoV-2QLD02 (n = 6).
Figure 2.
Figure 2.
Sequencing of MA viruses. (A) Amino acid changes and deletions (∆) in MA1, MA2, MA3, MA4, and MA5 (full dataset in Supplementary Dataset 1). Amino acid changes that only appear in one MA virus are in red, with other colors used to show amino acid changes common between at least two MA viruses. (B) Amino acids changes and deletions in any of the MA viruses as shown on the structure of SARS-CoV-2QLD02 spike bound to hACE2 (PDB: 7DF4). Underlining indicates the non-conservative amino changes. (C) Spike changes in the MA viruses. *—amino acid changes located within the RBD. Underlining indicates the non-conservative amino acid changes. GISAID n—number of GISAID submissions that contain this change; GISAID %—percentage of all GISAID submissions with this change. Alpha, Beta, Gamma, Delta, and Omicron: black text—hallmark changes in variants of concern; gray text—not a hallmark change in variants of concern. Match of amino acid changes in MA viruses with hallmark changes in variants of concern (green—exact match, blue—conservative, and brown—non-conservative change).
Figure 3.
Figure 3.
Modeling RBD changes. RBD substitutions for MA viruses were modeled using PyMOL (PDB: 7DF4) to visualize their potential effects on mACE2 binding. (A) Interactions between SARS-CoV-2QLD02 RBD and mACE2 are predicted between Q493 and N31/Q34, N501, and H353, and Q498 and Y41 (dashed lines/pale turquoise ovals). These interactions are insufficient to support replication and are largely retained for MA viruses and mACE2. (B) MA1 has additional predicted interactions between H498 and Y41 (magenta oval). (C–F) MA2-5 have additional predicted interactions between K/R493 and N31/Q34 (C–F, magenta ovals). Green = ACE2. Yellow = hACE2 residues changed to mACE2. Blue = SARS-CoV-2 spike RBD. Black-dotted interactions represent hydrogen bonds, and yellow-dotted lines represent any interactions within 3.5 Å.
Figure 4.
Figure 4.
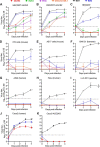
In vitro growth kinetics of mACE2-adapted viruses reveal an ACE2-independent entry mechanism. Growth kinetics of the indicated viruses in HEK293T-hACE2 cells (A), HEK293T-mACE2 cells (B), untransduced HEK293T cells (C), 3T3 cells (D), AE17 cells (E), BHK-21 cells (F), A549 cells (G), HeLa cells (H), and LLC-PK1 cells (I) after infection at MOI ≈ 0.1. (J) Caco2 and (K) Caco2-ACE2 knockout cells were infected at MOI ≈ 1. n = 3–6 replicates per virus strain per cell line. Dotted line—limit of detection. *P < 0.05; statistics by t-test or the Kolmogorov–Smirnov test for 3 or 4 dpi versus 0 dpi.
Figure 5.
Figure 5.
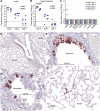
MA1 and MA2 infection in C57BL/6J mice. (A) C57BL/6J mice were infected with MA1 or MA2, lungs were collected at Days 2, 4, or 7 postinfection, and tissue titers were determined by CCID50 assays. (B) As for (A) for nasal turbinates. Statistics by t-test. (C) As for (A) for the indicated tissues. (D–G) IHC using an anti-SARS-CoV-2 spike monoclonal antibody and lungs taken on Day 2 after infection of C57BL/6J mice with MA1. Images are representative of lung sections from four mice. Dark brown staining (Nova Red) indicates infected cells, often with the expected, clearly discernable, cytoplasmic staining pattern. The large unstained areas in (D) and (G) are included to illustrate the specificity of the IHC staining.
Figure 6.
Figure 6.
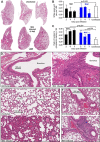
H&E staining of lungs after infection of C57BL/6J mice with MA1 and MA2. (A) Representative low magnification images of H&E-stained lung sections for uninfected and MA1-infected C57BL/6J mice taken 4 days postinfection. (B) Image analysis to measure lung consolidation quantitated as an area of white space (unstained air spaces within the lung) per µm2 (n = 4 mice per group, with three sections scanned per lung and values averaged to produce one value for each lung). Statistics by t-test. (C) Image analysis to quantitate leukocyte infiltration. The ratios of nuclear (blue/dark purple) to cytoplasmic (red) staining of H&E-stained lung (n = 4 mice per group, with three sections scanned per lung and values averaged to produce one value for each lung). Statistics by t-tests, with data from the three time points for infected mice combined. (D) High magnification image showing bronchus from uninfected mice (left) and MA1-infected mice (right) on Day 4 postinfection. The latter shows sloughing of the bronchial epithelium (S) and smooth muscle hyperplasia (M). (E) High magnification image showing uninfected lungs (top) and MA1-infected lungs (4 dpi) (bottom). The latter shows lung consolidation and loss of alveolar air spaces, as well as pulmonary edema (dotted ovals, bottom right). (F) High magnification images of uninfected lungs (top) and in MA1-infected lungs on 4 dpi (bottom). The latter shows dense cellular infiltrate (dotted circle).
Figure 7.
Figure 7.
RNA-Seq comparison of MA1-infected C57BL/6J versus SARS-CoV-2QLD02-infected K18-hACE2 mouse lungs. RNA-Seq was performed on mouse lungs on 4 dpi for MA1 infection of C57BL/6J mice and SARS-CoV-2QLD02 infection of K18-hACE2 mice. DEGs (n = 1,027 for C57BL/6J, n = 1,349 for K18-hACE2) were analyzed by IPA, and z-scores for significant USRs (A) or Diseases and Functions (B) were plotted with C57BL/6J + MA1 on the x-axis and K18-hACE2 + QLD02 on the y-axis. Statistics by Pearson’s correlations. Dotted black lines—95 per cent confidence limits. Solid black line—line of best fit. Annotations outside the 95 per cent confidence limits are colored in red. Selected annotations are labeled (red text). Full data sets are provided in Supplementary Dataset 2.

Similar articles

Cited by

References

    1. Amarilla A. A. et al. (2021) ‘A Versatile Reverse Genetics Platform for SARS-CoV-2 and Other Positive-Strand RNA Viruses’, Nature Communications, 12: 3431. - PMC - PubMed
    1. Amraei R. et al. (2021) ‘CD209L/L-SIGN and CD209/DC-SIGN Act as Receptors for SARS-CoV-2’, ACS Central Science, 7: 1156–65. - PMC - PubMed
    1. Andrews S. (2010) ‘A Quality Control Tool for High Throughput Sequence Data’. https://www.bioinformatics.babraham.ac.uk/projects/fastqc/, accessed 21 July 2022.
    1. Bankhead P. et al. (2017) ‘QuPath: Open Source Software for Digital Pathology Image Analysis’, Scientific Reports, 7: 16878. - PMC - PubMed
    1. Bao L. et al. (2020) ‘Transmission of Severe Acute Respiratory Syndrome Coronavirus 2 via Close Contact and Respiratory Droplets among Human Angiotensin-Converting Enzyme 2 Mice’, The Journal of Infectious Diseases, 222: 551–5. - PMC - PubMed