NanoSIMS combined with fluorescence microscopy as a tool for subcellular imaging of isotopically labeled platinum-based anticancer drugs
- PMID: 35919909
- PMCID: PMC9273000
- DOI: 10.1039/c3sc53426j
NanoSIMS combined with fluorescence microscopy as a tool for subcellular imaging of isotopically labeled platinum-based anticancer drugs
Abstract
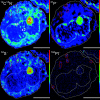
Multi-elemental, isotope selective nano-scale secondary ion mass spectrometry (NanoSIMS) combined with confocal laser-scanning microscopy was used to characterize the subcellular distribution of 15N-labeled cisplatin in human colon cancer cells. These analyses indicated predominant cisplatin colocalisation with sulfur-rich structures in both the nucleus and cytoplasm. Furthermore, colocalisation of platinum with phosphorus-rich chromatin regions was observed, which is consistent with its binding affinity to DNA as the generally accepted crucial target of the drug. Application of 15N-labeled cisplatin and subsequent measurement of the nitrogen isotopic composition and determination of the relative intensities of platinum and nitrogen associated secondary ion signals in different cellular compartments with NanoSIMS suggested partial dissociation of Pt-N bonds during the accumulation process, in particular within nucleoli at elevated cisplatin concentrations. This finding raises the question as to whether the observed intracellular dissociation of the drug has implications for the mechanism of action of cisplatin. Within the cytoplasm, platinum mainly accumulated in acidic organelles, as demonstrated by a direct combination of specific fluorescent staining, confocal laser scanning microscopy and NanoSIMS. Different processing of platinum drugs in acidic organelles might be relevant for their detoxification, as well as for their mode of action.
This journal is © The Royal Society of Chemistry.
Figures


Similar articles
-
Multi-scale imaging of anticancer platinum(iv) compounds in murine tumor and kidney.Chem Sci. 2016 May 1;7(5):3052-3061. doi: 10.1039/c5sc04383b. Epub 2016 Feb 3. Chem Sci. 2016. PMID: 29997796 Free PMC article.
-
Nano-scale imaging of dual stable isotope labeled oxaliplatin in human colon cancer cells reveals the nucleolus as a putative node for therapeutic effect.Nanoscale Adv. 2020 Nov 26;3(1):249-262. doi: 10.1039/d0na00685h. eCollection 2021 Jan 7. Nanoscale Adv. 2020. PMID: 36131874 Free PMC article.
-
Elemental mapping of Neuromelanin organelles of human Substantia Nigra: correlative ultrastructural and chemical analysis by analytical transmission electron microscopy and nano-secondary ion mass spectrometry.J Neurochem. 2016 Jul;138(2):339-53. doi: 10.1111/jnc.13648. Epub 2016 Jun 2. J Neurochem. 2016. PMID: 27121280
-
NanoSIMS chemical imaging combined with correlative microscopy for biological sample analysis.Curr Opin Biotechnol. 2016 Oct;41:130-135. doi: 10.1016/j.copbio.2016.06.006. Epub 2016 Aug 6. Curr Opin Biotechnol. 2016. PMID: 27506876 Review.
-
[Drug discovery research in in-vivo antitumor-active azolato-bridged dinuclear Pt(II) complexes].Yakugaku Zasshi. 2012;132(3):253-9. doi: 10.1248/yakushi.132.253. Yakugaku Zasshi. 2012. PMID: 22382827 Review. Japanese.
Cited by
-
Die Wechselwirkung mit ribosomalen Proteinen begleitet die Stressinduktion des Wirkstoffkandidaten BOLD-100/KP1339 im endoplasmatischen Retikulum.Angew Chem Weinheim Bergstr Ger. 2021 Mar 1;133(10):5121-5126. doi: 10.1002/ange.202015962. Epub 2021 Feb 1. Angew Chem Weinheim Bergstr Ger. 2021. PMID: 38505777 Free PMC article.
-
Cisplatin toxicity is counteracted by the activation of the p38/ATF-7 signaling pathway in post-mitotic C. elegans.Nat Commun. 2023 May 20;14(1):2886. doi: 10.1038/s41467-023-38568-5. Nat Commun. 2023. PMID: 37210583 Free PMC article.
-
Synchrotron X-Ray Fluorescence Nanoprobe Reveals Target Sites for Organo-Osmium Complex in Human Ovarian Cancer Cells.Chemistry. 2017 Feb 21;23(11):2512-2516. doi: 10.1002/chem.201605911. Epub 2017 Jan 26. Chemistry. 2017. PMID: 28012260 Free PMC article.
-
Metallodrugs are unique: opportunities and challenges of discovery and development.Chem Sci. 2020 Nov 12;11(48):12888-12917. doi: 10.1039/d0sc04082g. Chem Sci. 2020. PMID: 34123239 Free PMC article. Review.
-
In Situ Detection and Single Cell Quantification of Metal Oxide Nanoparticles Using Nuclear Microprobe Analysis.J Vis Exp. 2018 Feb 3;(132):55041. doi: 10.3791/55041. J Vis Exp. 2018. PMID: 29443063 Free PMC article.
References
LinkOut - more resources
Full Text Sources

