

Store-operated calcium entry controls innate and adaptive immune cell function in inflammatory bowel disease
- PMID: 35919953
- PMCID: PMC9449601
- DOI: 10.15252/emmm.202215687
Store-operated calcium entry controls innate and adaptive immune cell function in inflammatory bowel disease
Abstract
Inflammatory bowel disease (IBD) is characterized by dysregulated intestinal immune responses. Using mass cytometry (CyTOF) to analyze the immune cell composition in the lamina propria (LP) of patients with ulcerative colitis (UC) and Crohn's disease (CD), we observed an enrichment of CD4+ effector T cells producing IL-17A and TNF, CD8+ T cells producing IFNγ, T regulatory (Treg) cells, and innate lymphoid cells (ILC). The function of these immune cells is regulated by store-operated Ca2+ entry (SOCE), which results from the opening of Ca2+ release-activated Ca2+ (CRAC) channels formed by ORAI and STIM proteins. We observed that the pharmacologic inhibition of SOCE attenuated the production of proinflammatory cytokines including IL-2, IL-4, IL-6, IL-17A, TNF, and IFNγ by human colonic T cells and ILCs, reduced the production of IL-6 by B cells and the production of IFNγ by myeloid cells, but had no effect on the viability, differentiation, and function of intestinal epithelial cells. T cell-specific deletion of CRAC channel genes in mice showed that Orai1, Stim1, and Stim2-deficient T cells have quantitatively distinct defects in SOCE, which correlate with gradually more pronounced impairment of cytokine production by Th1 and Th17 cells and the severity of IBD. Moreover, the pharmacologic inhibition of SOCE with a selective CRAC channel inhibitor attenuated IBD severity and colitogenic T cell function in mice. Our data indicate that SOCE inhibition may be a suitable new approach for the treatment of IBD.
Keywords: Crohn's disease; T cell transfer models of colitis; mass cytometry; store-operated calcium entry (SOCE); ulcerative colitis.
© 2022 The Authors. Published under the terms of the CC BY 4.0 license.
Figures

- A–E
Naïve CD4+ T cells were isolated from the spleen and LNs of WT, Stim2 fl/fl Cd4Cre (S2), Orai1 fl/fl Cd4Cre (O1), and Stim1 fl/fl Cd4Cre (S1) mice and differentiated into Th1, Th17, and iTreg cells. (A) Fura‐2 loaded cells were stimulated with 0.3 μM ionomycin to induce SOCE. Representative Ca2+ traces (left) and peak Ca2+ levels (right). Data are from the mean ± SEM of four mice per group. (B) Induction of colitis in Rag1 −/− mice by adoptive transfer of naive CD4+ T cells from wildtype, Stim2 fl/fl Cd4Cre, Orai1 fl/fl Cd4Cre and Stim1 fl/fl Cd4Cre mice. Weight curves of recipient Rag1 −/− mice following injection of naive CD4+ T cells. Data are from two independent experiments with eight recipient mice per group. (C) H&E stains of colon tissues and histological inflammation scores of Rag1 −/− mice 8 weeks after T cell transfer. Data are from one representative experiment with five mice per group. (D, E) Representative flow cytometry plots and frequencies of donor CD4+ T cells producing IFNγ, IL‐17A, TNF or expressing Foxp3 that were isolated from the mesenteric LNs of recipient Rag1 −/− mice. Data are from two independent experiments with 3–8 mice per group. Statistical analyses by unpaired student's t‐test: ***P < 0.001 **P < 0.01 *P < 0.05.

- A, B
Ca2+ influx in human lamina propria CD4+ and CD8+ T cells from three IBD patient samples analyzed by flow cytometry. (A) Experimental design. (B) Ca2+ influx rates in T cells pre‐incubated for 4 h in the presence of 15–1,000 nM BTP2, which was present until data acquisition. SOCE was induced by stimulation with the sarco‐endoplasmic reticulum Ca2+ ATPase (SERCA) inhibitor thapsigargin (TG) in Ca2+ free buffer followed by the addition of 2 mM Ca2+. Bar graphs show the mean ± SEM of Ca2+ influx rates after Ca2+ readdition from one experiment (n = three IBD patients). Statistical difference were calculated using a RM one‐way ANOVA test: ****P < 0.0001 ***P < 0.001 **P < 0.01 *P < 0.05.
- C–G
Analysis of LPMC from five CD patients. (C) Experimental design for mass cytometry. (D) viSNE plots of CD45+CD3+ LPMCs stimulated with 20 ng/ml PMA and 1 μg/ml ionomycin for 4 h in the presence of various (v) concentrations (15–1,000 nM) of BTP2. viSNE plots are colored according to the expression level of IL‐2 (blue: low, red: high) and are representative of one CD patient. (E) Dose–response curves of the frequencies of cytokine producing CD4+ and CD8+ T cells after PMA/ionomycin stimulation for 4 h in the presence of
increasing doses of BTP2. The frequencies of cytokine producing cells were normalized to control samples treated with PMA/ionomycin alone. Bar graphs show the mean ± SEM of five CD patient samples. (F) Heatmaps representing the median fold change of cytokine and cell surface marker expression in CD45+CD3+ LPMCs stimulated for 4 h with PMA/ionomycin in the presence of BTP2; data are normalized to PMA/ionomycin treatment alone. Statistical significance was calculated using a one‐tailed Wilcoxon matched‐pairs signed rank test, *P < 0.05. (G) Cytokine production by CD19+HLA‐DR+ B cells and CD11c+ myeloid cells in the presence of various (v)increasing doses (15–1,000 nM) of BTP2. Left: Dose–response curves showing frequencies of cytokine‐producing cells after 4 h stimulation with PMA/ionomycin ex vivo. Data are normalized to control samples stimulated with PMA/ionomycin in the absence of BTP2. Error bars represent SEM obtained from one experiment (n = 5 CD patients). Right: heatmaps showing the median fold change of cytokines and surface markers in CD19+HLA‐DR+ B cells and CD11c+ myeloid cells treated as described for the left panel. Significant fold changes in expression levels between samples were calculated using a one‐tailed Wilcoxon matched‐pairs signed rank test, *P < 0.05.


- A
Experimental setup for mass cytometric assays. Non‐inflamed: n = 4, CD: n = 6, UC: n = 6.
- B
FlowSOM plot of merged FCS files from LPMCs of non‐inflamed controls, UC or CD patients after stimulation with PMA/ionomycin ± 1 μM BTP2 for 4 h ex vivo. Colors of the t‐SNE plot represent 20 clusters of distinct CD45+ LPMC lineages. The heatmap shows the expression levels of 21 markers used for defining cell clusters.
- C
FlowSOM map of merged FCS files from CD45+ cells of non‐inflamed controls, UC and CD patients that were left unstimulated or treated with PMA/ionomycin ± 1 μM BTP2. Colors indicate altered cell clusters in CD patients vs. controls, UC patients vs. controls and CD vs. UC patients.
- D
viSNE plots of one exemplary non‐inflamed control, UC and CD patient colored by marker expression levels (blue: low, red: high).
- E
Quantified frequencies (%) of each cell subset defined by the cluster analysis. Statistical significance was calculated using the edgeR statistical framework with negative binomial GLM and a false discovery rate adjusted to 10% using the Benjiamini–Hochberg procedure (*P adj < 0.05, **P adj < 0.01, ***P adj < 0.001). Boxes extend from the 25th to 75th percentiles. Whisker plots show the min (smallest) and max (largest) values. The line in the box denotes the median from one experiment (non‐inflamed n = 4, CD: n = 6, UC: n = 6 patients).
- F
Heatmaps representing the median fold change of cytokine and surface marker expression in CD45+ LPMCs that were isolated from non‐inflamed, UC and CD samples and activated for 4 h with PMA/ionomycin ex vivo. Statistical significance was calculated using an unpaired t test with FDR adjustment to 1% using the Benjamini, Krieger, and Yekutieli procedure; *P adj < 0.05, **P adj < 0.01, ***P adj <0.001.

- A
FlowSOM plot of merged FCS files from samples treated with PMA/ionomycin ± 1 μM BTP2 (non‐inflamed: n = 4, CD: n = 6, UC: n = 6). Colors of FlowSOM plot indicate 20 distinct clusters of CD45+CD3+ LPMCs. Heatmaps show the expression levels of 24 markers used for cluster determination. The table shows the mean ± SEM of frequencies (%) for each cell subset defined in non‐inflamed controls, UC and CD patients after 4 h stimulation with PMA/ionomycin in vitro. Statistical significance was calculated using the edgeR statistical framework with negative binomial GLM and a false discovery rate adjusted to 10% using the Benjiamini–Hochberg procedure.
- B
Box plots showing frequencies (%) of each cell subset defined by the cluster analysis in non‐inflamed, UC and CD samples following stimulation with PMA/ionomycin ± BTP2 for 4 h in vitro. Statistical significances were calculated using a one‐tailed paired Wilcoxon matched‐pairs signed‐rank test, *P < 0.05. Boxes range from the 25th to 75th percentiles. Whisker plots show the min (smallest) and max (largest) values. The line in the box denotes the median obtained from one experiment (non‐inflamed: n = 4, CD: n = 6, UC: n = 6 patients).
- C
viSNE plots of one exemplary CD patient. Identification of cell subsets (left) and expression levels of cytokines after PMA/ionomycin stimulation in the presence or absence of BTP2 (blue; low, red: high).
- D
Heatmaps indicating the median fold change expression of cytokines and surface molecules in CD45+CD3+ LPMCs stimulated with PMA/ionomycin ± BTP2 for 4 h in vitro. Values are normalized to stimulated, non‐BTP2 treated samples. Statistical significance was calculated using a one‐tailed paired Wilcoxon matched‐pairs signed‐rank test, *P < 0.05.

- A
FlowSOM plot of merged FCS files from unstimulated samples or samples treated with PMA/ionomycin ± 1 μM BTP2 (non‐inflamed: n = 4, CD: n = 6, UC: n = 6). Colors of FlowSOM plot indicate 20 distinct clusters of CD45+CD3− LPMCs. Heatmap clusters showing the expression levels of 34 markers used for cluster determination. The table shows the mean ± SEM of frequencies (%) for each cell subset defined in non‐Inflamed, UC, and CD samples after stimulation with PMA/ionomycin for 4 h. Statistical significance was calculated using the edgeR statistical framework with negative binomial GLM and a false discovery rate adjusted to 10% using the Benjiamini–Hochberg procedure.
- B
Box plots show frequencies (%) of each cell subset defined by the cluster analysis in samples of non‐inflamed controls, UC or CD patients after stimulation with PMA/ionomycin ± BTP2 for 4 h ex vivo. Statistical significances were calculated by one‐tailed paired Wilcoxon matched‐pairs signed‐rank test, *P < 0.05. Boxes range from the 25th to 75th percentiles. Whisker plots show the min (smallest) and max (largest) values. The line in the box denotes the median obtained from one experiment (non‐inflamed: n = 4, CD: n = 6, UC: n = 6 patients).
- C
viSNE plots of one exemplary CD patient. Identification of cell subsets (left) and expression levels of cell markers after PMA/ionomycin stimulation in the presence or absence of BTP2 (blue; low, red: high).
- D
Heatmaps indicating the median fold change expression of cytokines and surface markers in CD45+CD3− LPMCs activated with PMA/ionomycin ± BTP2 for 4 h in vitro. Values are normalized to stimulated, non‐BTP2 treated samples. Significant differences were calculated using a one‐tailed paired Wilcoxon matched‐pairs signed‐rank test, *P < 0.05.

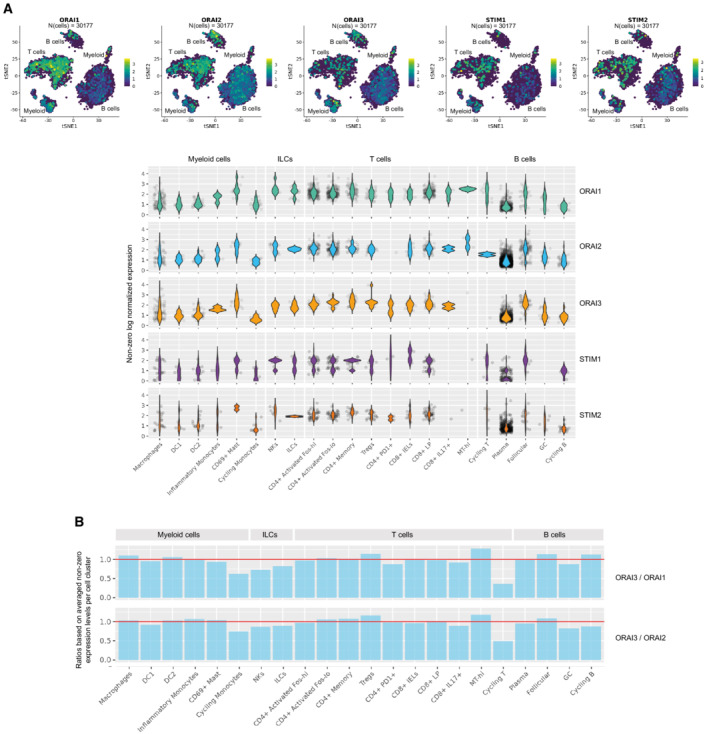
- A
viSNE plots and violin plots showing mRNA expression levels of ORAI1, ORAI2, ORAI3, STIM1 and STIM2 in subsets of LPMC. Expression data were reanalyzed from Smillie et al (2019).
- B
Bar graphs showing the ratios of mRNA expression for ORAI3/ORAI1 and ORAI3/ORAI2 in different subsets of LPMC. Expression data were reanalyzed from Smillie et al (2019).

- A, B
Adult stem cell–derived intestinal epithelial spheroids of wild‐type C57BL/6 mice were cultured for 4 days in Wnt‐free medium to induce differentiation. Initial viability was determined on day 0. DMSO control (vehicle, white bars) or 1 μM BTP2 (blue bars) were added to the culture medium and viability was measured every 24 h by resazurin viability assay and microscopy. Scale bar depicts 100 μm.
- C
Transepithelial electrical resistance (TEER) was measured on differentiated murine colon monolayers in the presence or absence of 1 μM BTP2.
- D
Human colonic spheroids were generated from primary human epithelial crypts obtained from colon resectates of two CD patients and cultured for 6 days in Wnt‐free medium to induce differentiation into colonic organoids. Initial viability was determined on day 0. DMSO control or 1 μM BTP2 were added to the culture medium and viability was measured on days 2, 4, and 6.
- E
TEER of differentiated human colon monolayers was analyzed in the presence or absence of 1 μM BTP2.
- F
Relative mRNA expression of markers for enterocytes (ALPI), goblet cells (MUC2), and entero‐endocrine cells (CHGA) was quantified by RT‐PCR in differentiated human colon monolayers after addition of 1 μM BTP2.
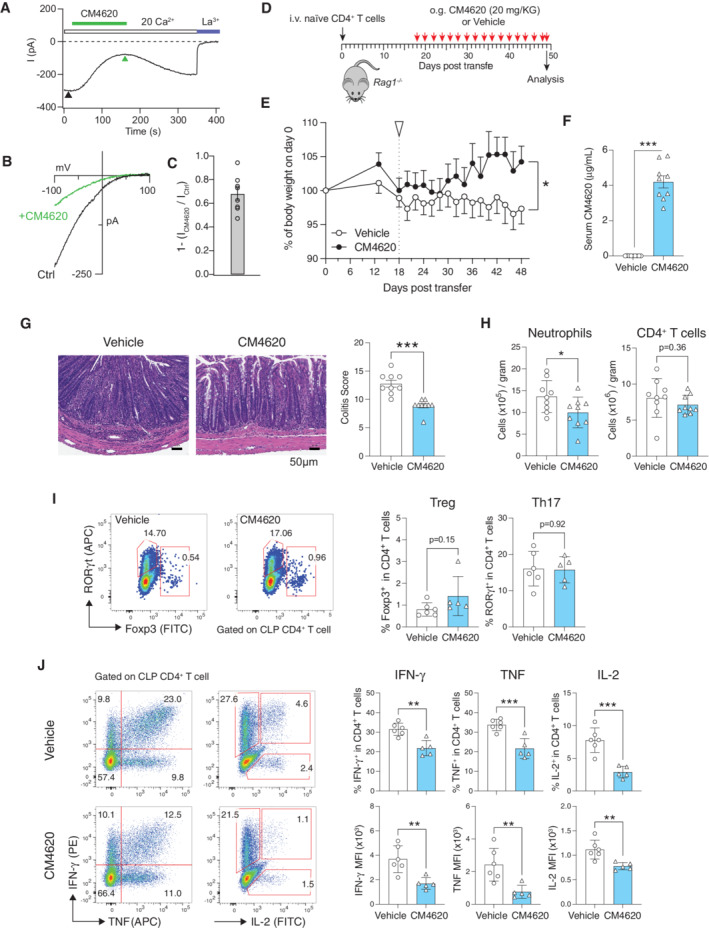
- A–C
Acute administration of the CRAC channel blocker CM4620 inhibits CRAC currents (Icrac). (A) Time course of peak amplitudes of ICRAC before and after application of 3 μM CM4620 to HEK293 cells transfected with ORAI1 and STIM1. (B) Current–voltage (I–V) relationship of ICRAC before and after CM4620 treatment. I–Vs were obtained at the time points indicated by the arrowheads in (A). (C) Fractional blockade of ICRAC by CM4620 was measured by comparing current amplitudes before and after CM4620 administration (arrowheads) using the formula 1 − (ICM4620/ICtrl). Data are from eight cells per conditions and shown as the mean ± SEM.
- D
IBD was induced by i.v. injection of 5 × 10⁵ naïve CD4+ T cells into Rag1 −/− host mice followed by oral gavage of mice with 20 mg/kg CM4620 or vehicle (SDD) every other day from days 18–49.
- E
Relative weight loss of mice treated with vehicle or CM4620; the start of treatment is indicated by the white arrow. Data are the mean ± SEM of nine mice per cohort, statistical analysis by unpaired Student's t‐test, *P < 0.05.
- F
Concentrations of CM4620 in the serum of mice at day 49, data are the mean ± SEM. Statistical analysis by unpaired Student's t‐test, ***P < 0.001.
- G
Representative H&E staining of the distal colon of Rag1 −/− mice treated with vehicle or CM4620. Colitis scores of nine mice per cohort. Each symbol represents one mouse. Statistical analysis by Mann–Whitney U test Data are the mean ± SEM, ***P < 0.001.
- H
Number of CD11b+Gr‐1+ neutrophils and CD4+ T cells (normalized to grams of tissue) in the colon lamina propria (CLP) of mice on day 49 quantified by flow cytometry. Each dot represents one mouse. Data are the mean ± SEM of nine mice per cohort.
- I
Frequencies of RORγt+ Th17 cells and Foxp3+ Treg cells in the CLP of mice treated with CM4620 or vehicle. Each dot represents one mouse. Data are the mean ± SEM of six control and five CM4620 treated mice.
- J
Frequencies of IFN‐γ, TNF‐α, and IL‐2 producing CD4+ T cells isolated from the CLP, restimulated ex vivo with PMA and ionomycin for 4 h (without addition of CM4620 during stimulation in vitro) and analyzed by flow cytometry. Bar graphs represent the percentages of IFN‐γ+, TNF‐α+, IL‐2+ cells in CD4+ cells (top row) and mean fluorescent intensity (MFI) of IFN‐γ, TNF‐α, IL‐2 on CD4+ cells (bottom row). Each dot represents one mouse. Data are the mean ± SEM of six control and five CM4620 treated mice.
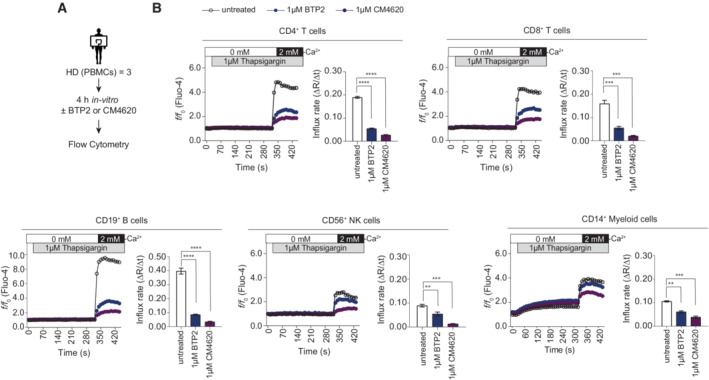
- A
Experimental design for Ca2+ influx measurements in PBMCs of three healthy donors (HD) by flow cytometry.
- B
Ca2+ influx rates were measured in CD4+ or CD8+ T cells, CD19+ B cells, CD56+ NK cells and CD14+ myeloid cells following pre‐incubation with 1 μM BTP2 or 1 μM CM4620 for 4 h. Cells were stimulated with thapsigargin in Ca2+ free buffer followed by addition of 2 mM Ca2+ Ringer solution. Bar graphs show the mean values of influx rates after addition of 2 mM Ca2+ from one experiment (samples of n = 3 HD run in technical triplicates). Statistical significance was calculated using repeated measures (RM) one‐way ANOVA test. ****P < 0.0001; ***P < 0.001; **P < 0.01; *P < 0.05.
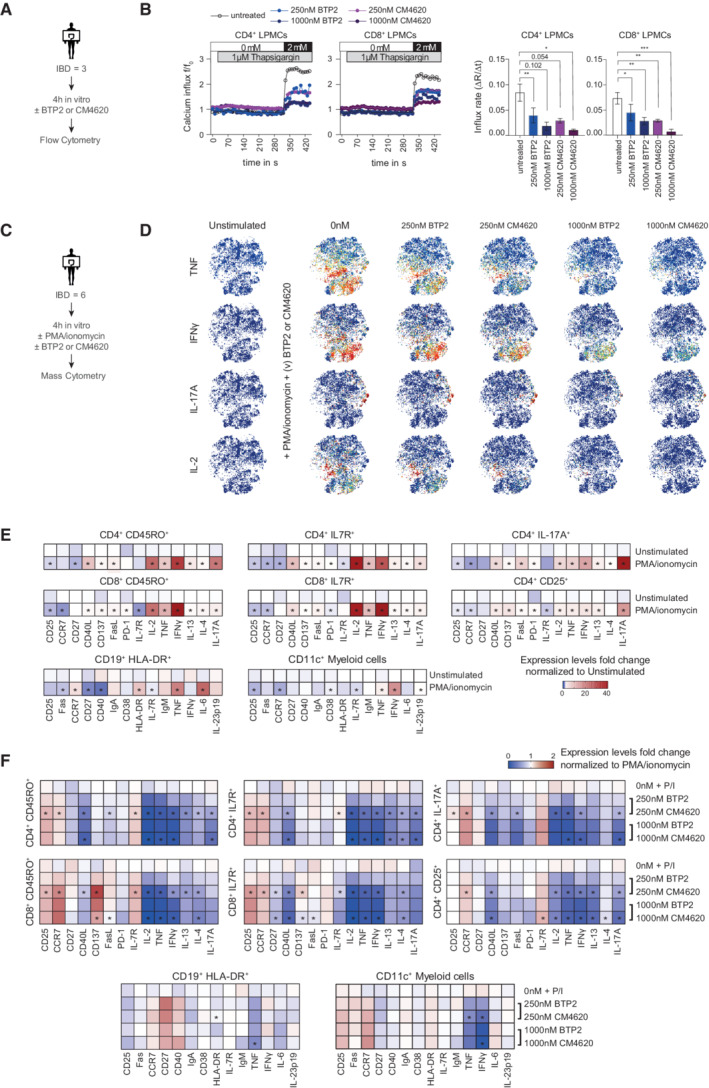
- A
Experimental setup for Ca2+ influx measurements of LPMCs from three IBD patients by flow cytometry.
- B
Human lamina propria CD4+ and CD8+ T cells were pretreated with 250 nM or 1,000 nM BTP2 or CM4620 for 4 h in vitro and added to the cell suspension until acquisition. Cells were stimulated with 1 μM thapsigargin (TG) in Ca2+ free Ringer solution followed by the readdition of 2 mM Ca2+ Ringer solution. Bar graphs show the mean ± SEM of Ca2+ influx rates after the addition of 2 mM Ca2+ Ringer solution from one experiment (n = 3 IBD patients). Statistical significance was calculated with repeated measures (RM) one‐way ANOVA test. ****P < 0.0001; ***P < 0.001; **P < 0.01; *P < 0.05.
- C–F
Mass cytometry analysis of LPMCs from six IBD patients. (C) Experimental design. (D) viSNE plots of CD45+CD3+ LPMCs stimulated with PMA/ionomycin in the presence of various (v) concentrations (250 or 1,000 nM) of BTP2 or CM4620 with unstimulated samples serving as controls. Colors indicate the expression level of IL‐2, IL‐17, IFNγ, and TNFα (blue: low, red: high) and are representative of one CD patient. (E) Heatmaps representing the median fold change of cytokines and cell surface molecules on CD45+CD3+ or CD45+CD3− LPMCs that were stimulated with PMA/ionomycin for 4 h in vitro. Data are normalized to unstimulated samples. (F) Heatmaps representing the median fold change of cytokine and cell surface marker expression in CD45+CD3+ and CD45+CD3− LPMCs stimulated with PMA/ionomycin for 4 h in the presence or absence of 250 nM or 1,000 nM BTP2 or 250 nM or 1,000 nM CM4620. Data were normalized to samples treated with PMA/ionomycin alone. Statistical significance in (E, F) was calculated using a one‐tailed paired Wilcoxon matched‐pairs signed rank test. *P < 0.05.
References
-
- Akbari O, Stock P, Meyer E, Kronenberg M, Sidobre S, Nakayama T, Taniguchi M, Grusby MJ, DeKruyff RH, Umetsu DT (2003) Essential role of NKT cells producing IL‐4 and IL‐13 in the development of allergen‐induced airway hyperreactivity. Nat Med 9: 582–588 - PubMed
-
- Benjamini Y, Drai D, Elmer G, Kafkafi N, Golani I (2001) Controlling the false discovery rate in behavior genetics research. Behav Brain Res 125: 279–284 - PubMed
Publication types
MeSH terms
Substances
Grants and funding
LinkOut - more resources
Full Text Sources
Research Materials
Miscellaneous
